Time-Lapse Fluorescence Microscopy
Live Cell Study
Changes in the cytoplasmic free Ca2+ concentration [Ca2+]c constitute one of the main pathways by which information is transferred from extracellular signals received by animal cells to intracellular sites. In eukaryotic cells, one major route for Ca2+ influx is through store-operated calcium released activated channels (CRAC), which are activated following a fall in Ca2+ content within the endoplasmic reticulum. Mitochondria are key regulators of this ubiquitous Ca2+ influx pathway. In the next step, the role of mitochondria in regulating the activity and dynamics of calcium channels through time lapse fluorescence microscopy and cytometry is evaluated. The hypothesis is that alterations in the various ion channels of the cell membrane by chemical stress would result in dynamically changing concentrations of cytosolic calcium. In addition, inhibition of one of these channels using a mitochondrial uncoupler will result in a smaller change in concentration compared to normal conditions.
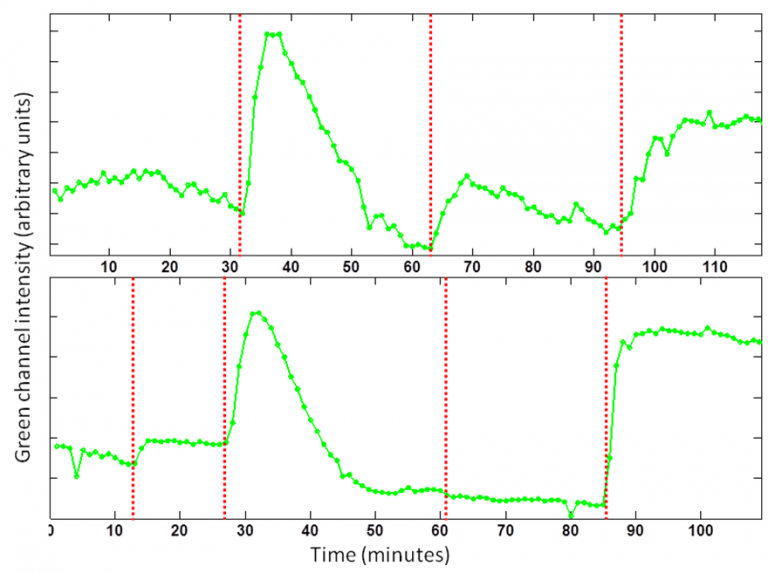
Fig 1. Plotting the profile of the segmented cells over time. Red dotted lines shows addition of thapsigargin, calcium, and ionomycin in top, and DNP, thapsigargin, calcium, and ionomycin in the bottom panels over time.
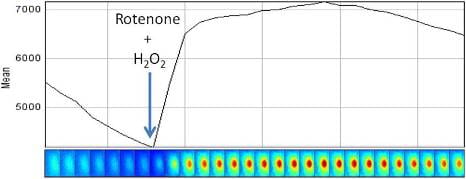
Reactive oxygen species (ROS) are chemically reactive molecules containing oxygen and have important roles in cell signaling and homeostasis. Oxidative stress, often due to an irregularity in the level of oxygen introduced to the mitochondria, represents an imbalance between production and consumption of this species. As the final step in cell studies, the dynamics of production of ROS are studied in different stress conditions (modeling oxidative stress) including the addition of chain perturbers (PCP and KCN) in fibroblasts to be further compared with differentiated cells.
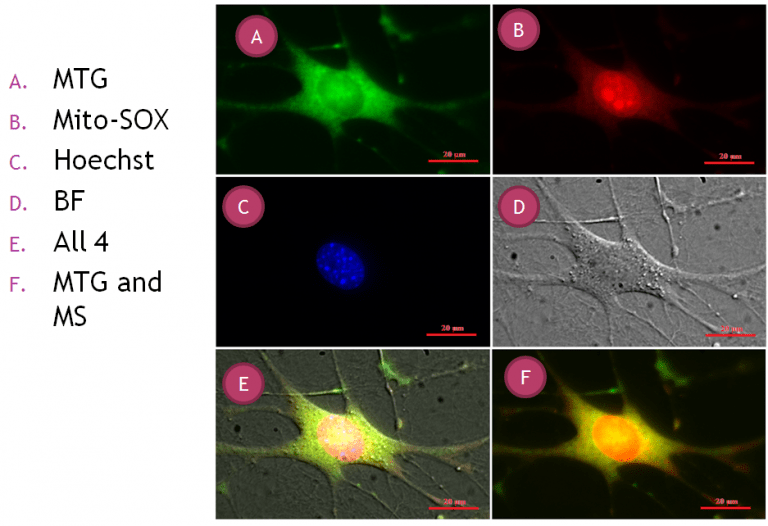
Fig 2. The result of mitochondria imaging. Top left and right shows Mito-tracker green and Mito-SOX in green and red channels, the middle panel shows cell nuclei in blue and left whole cell in bright-field. The bottom panel shows the overlay of different channels, left: all four channels mentioned above and right only red and green channels.
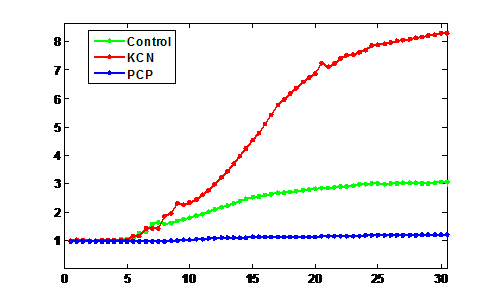
Fig 3. Plotting the profile of the cells in red channel over time. Mito-SOX is added to the dish 5 minute after the start of the imaging. The first dish (green) is imaged in the presence of Mito-SOX only while for the second and third dishes Mito-SOX is added at the same time with KCN (red) and PCP (blue), respectively
Fixed Cell Study
Fluorescence Imaging is a type of imaging which relies on fluorescent proteins to create images. It is commonly used to study cellular processes, including those of diseases, both in tissue as well as neurological. However, fluorescence imaging is not limited to diseases. It has also been used to observe normal cell processes, and probe gene functions.
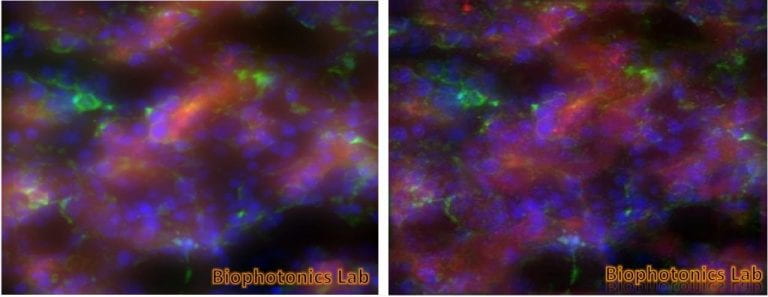
Fig 4. These images are of a rat embryo acquired using a Nikon microscope and three different excitation wavelengths. The images of each wavelength are merged to create this three color image. The image on left is raw and the image on right was deconvolved with SoftWorks image processing software.
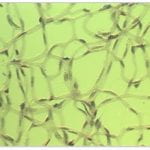
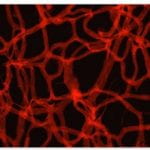
Retina Cell and Vasculature Distribution
The images shown are of a retina from mice models of retinopathic injury. These images are used to determine the quantity of endothelial cells and pericytes as well as extracting features from the structure of the vasculature and vasculature development, which are important factors in the development of retinopathy.