Optical Coherence Tomography
Ex vivo OCT
In our preliminary studies so far, we have shown the changes in the structure of the alveoli versus different ventilator pressure (pulmonary compliance) to verify that OCT system works for fast real-time imaging and the image processing tool is able to extract needed information about the dynamic change of alveoli structure.
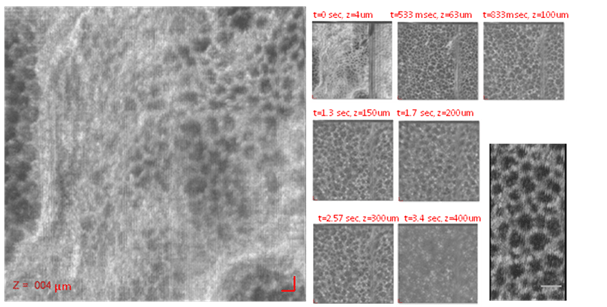 Fig. 1: Left : A stack of 2D cross section images with field of view of 3mm × 3mm. These images show the alveoli structure in different depth constructed from the SD-OCT data collected from the surface of the ex vivo rat lung. Right: The 3D volume image of alveolar walls. Please note that scale bar is 100um in both x and y directions
Aveolar Structure Segmentation
3D OCT scans were taken from different spots at all lobes of an ex vivo rat lung (left panel in figure 2). Figure 2 (right- top panel) shows one of the images with average quality which the contour of individual alveoli can’t be clearly seen. Right-bottom panel in figure 2 reveals that our segmentation algorithm works accurate even on the pretty poor resolution images with accuracy of 98.6% compared to manual detection. The segmentation code is capable of finding the contour of each alveolus and calculating 2D cross section area of each alveolus, the total area of alveoli, maximum, minimum, and average diameter of alveolar sacs in the image and the total number of alveolar sacs.
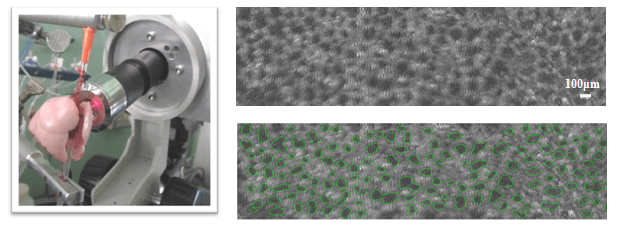 Fig. 2: Left: Head of the OCT probe on the ex vivo rat lung. Right-top: Average quality of 2D images of alveoli from rat lung at a depth of 63µm captured and reconstructed by SD-OCT in the ventilated pressure of 5 TORR. Right-bottom: Green contours show segmented alveolar walls. Total number of alveoli in this image is 145, 2D cross section area of an alveolus is 3467 (µm)2 on average, and diameter of an alveolus is 72µm on average.
Pulmanary Compliance Experiment
The pressure-volume (PL-VL) curve of an excised lung inflated-deflated between minimum lung volume and total lung capacity (TLC) is characterized by a nonlinear relationship and is typified by a large hysteretic area indicating an irreversible energy loss. In order to see the dynamic change of structure, SD-OCT data collected from the surface of a fixated, buffer perfused and ventilated rat lung at 3 different ventilator pressures: 2.5, 5, and 6.5 TORR. The images was reconstructed and segmentation algorithm was applied and the information about the structure changes of lung extracted. Top panel in figure 3 shows the histograms of alveoli diameters at aforementioned pressures. As expected, this parameter directly change with ventilator pressure. The higher the lung ventilation pressure, the greater alveoli diameter and 2D area. Bottom panel shows the slope of linear curve fitting of alveoli diameter versus ventilator pressure. We assume this slope differs for diseased (obstructive and restrictive) lungs compared to normal lungs and will help to classify these groups.
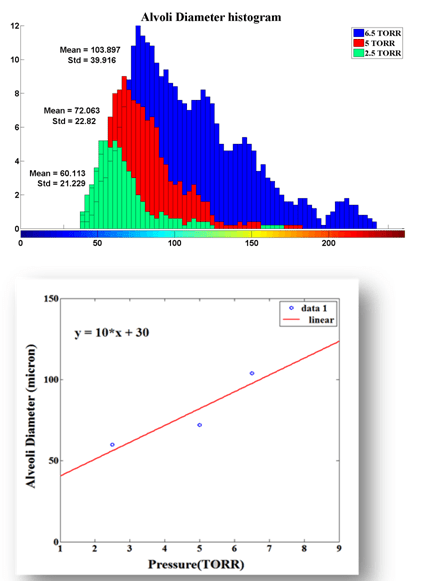 Fig. 3: (Top) Histograms of alveoli diameters (µm) at three pressures: 2.5 TORR (green), 5 TORR (red), 6.5 TORR (blue). (Bottom) Linear curve fitting of alveoli diameters versus pressure.