Hidden Currents
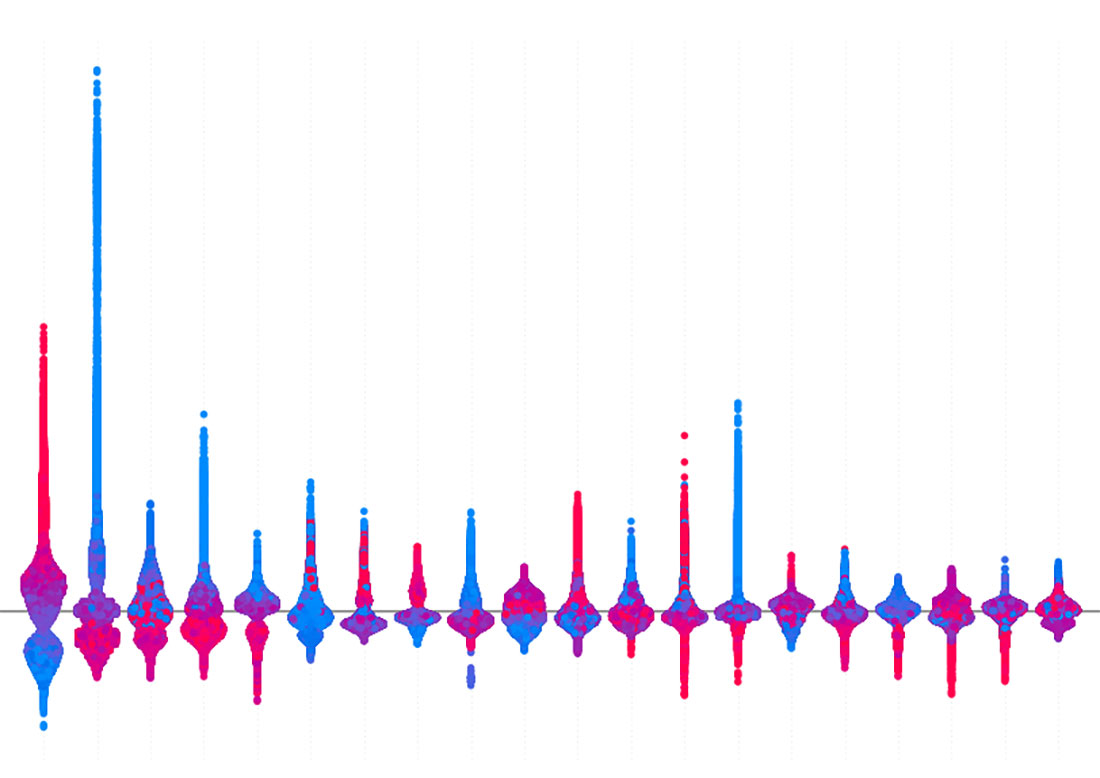
Visualizing the Flow of Fraud Detection - This image captures the invisible currents that flow within a complex system, blending art and science to reveal the hidden information related to the Medicare fraud detection. Like a river winding over unseen landscapes, the vibrant reds and calming blues represent the interaction of different factors, each ripple and swirl symbolizing the movement of data. The harmonious symmetry offers a sense of balance, transforming abstract, technical concepts into a visually engaging piece. Each dot in this visual story stands for a feature's influence on the machine learning model, with colors indicating feature values‚ red for high, blue for low.
Technically, this image is a SHAP (SHapley Additive exPlanations) summary plot, which decodes the fraud detection model. Features like "time" and "amount" are shown as rows of dots, with their horizontal spread revealing how much each feature impacts the model's predictions. Larger spreads signify stronger influences, either pushing the model towards detecting fraud or away from it. This fusion of form and function allows us to appreciate the complexity behind detecting fraudulent activity, while also recognizing the hidden beauty within data-driven decision-making.