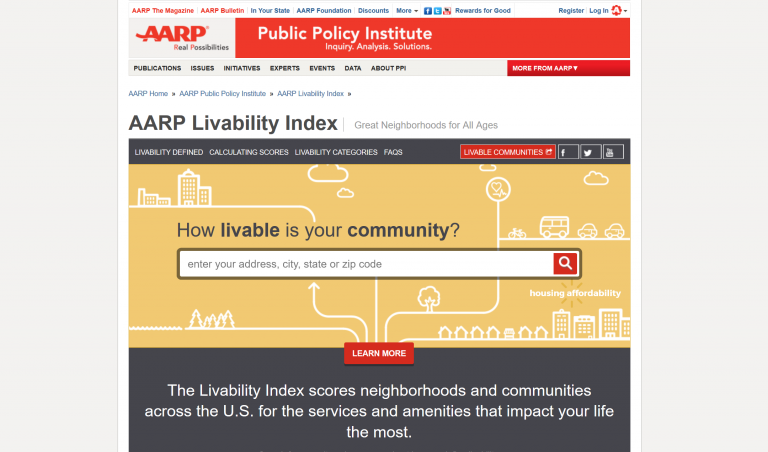
The AARP Livability Index assesses seven broad categories of community livability: housing, neighborhood, transportation, environment, health, engagement, and opportunity.
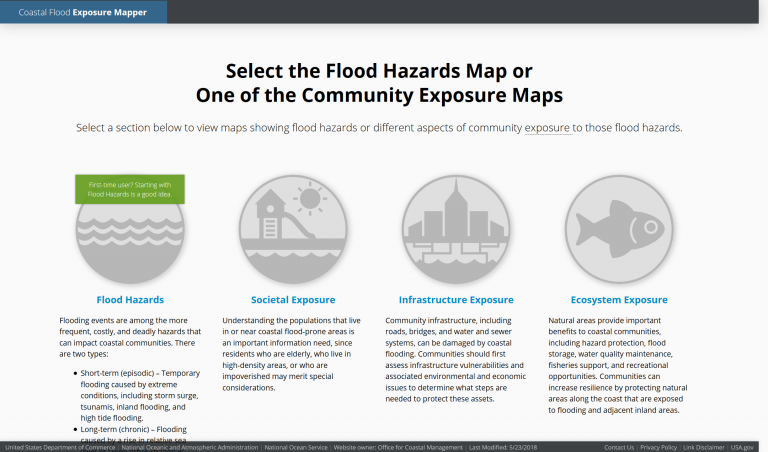
The purpose of this mapping application is to provide a preliminary look at exposure to common types of coastal flooding.
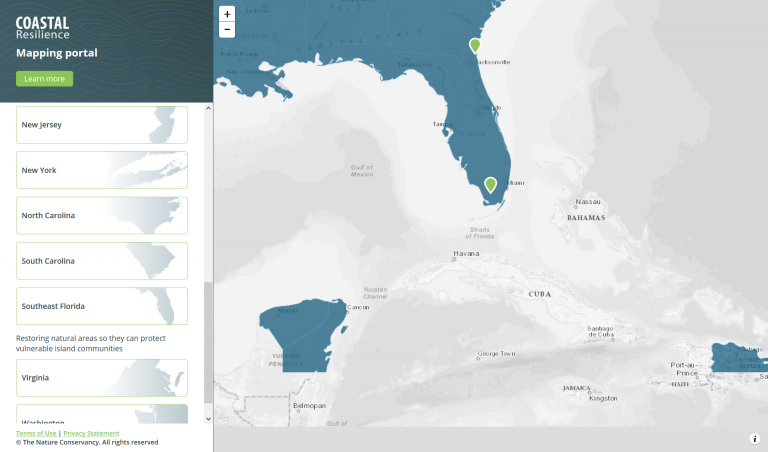
An online mapping tool customized for local and state decision makers showing potential impacts from sea level rise and coastal hazards designed to help communities develop and implement solutions that incorporate ecosystem-based...
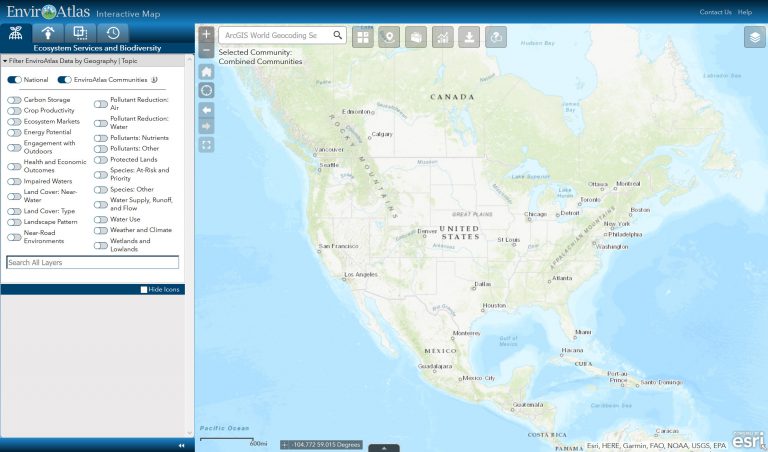
EnviroAtlas is designed for staff from all levels of government, environmental and public health professionals, researchers, educators, non-governmental organizations, and anyone else with an interest in ecosystem services...
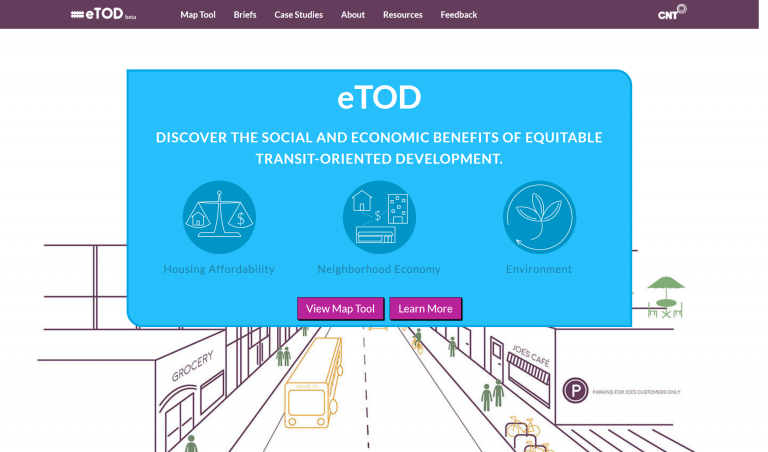
The Calculator reveals the benefits of affordable housing near transit to help developers select better sites, design unit mix, and educate the public and decision makers.
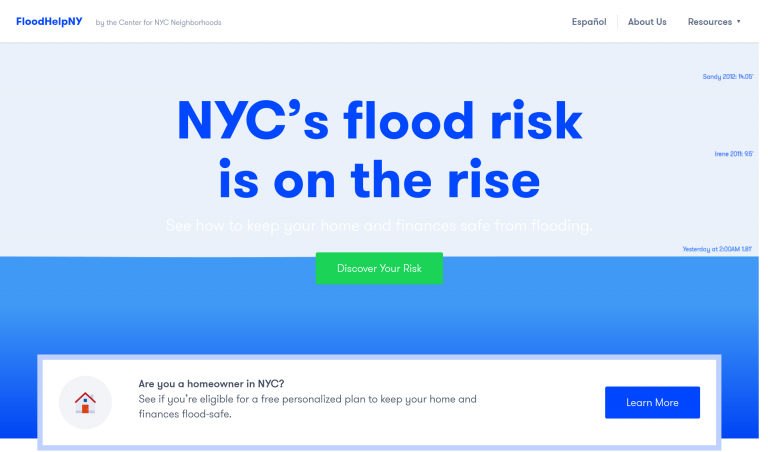
FloodHelpNY is a platform for engaging and informing New York City homeowners about how they can protect their home and finances from flooding that is expected to worsen with rising sea levels caused by climate change.
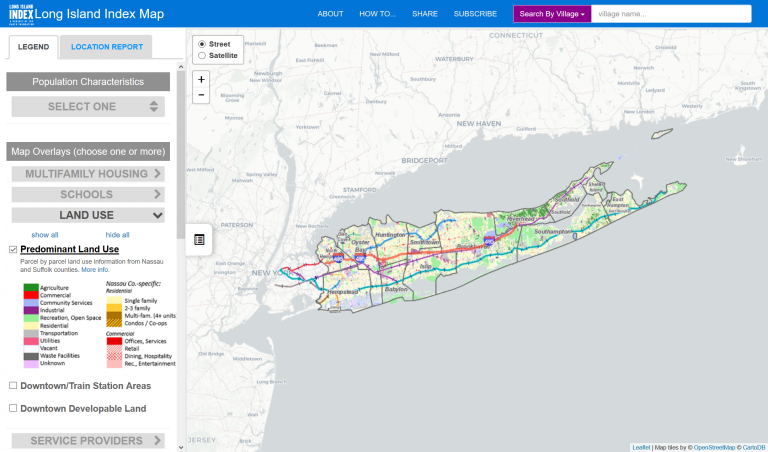
The map displays Long Island’s latest land use patterns on a property-by-property basis, small-area population and housing statistics from the Census Bureau, a district-by-district analysis of educational data, special...
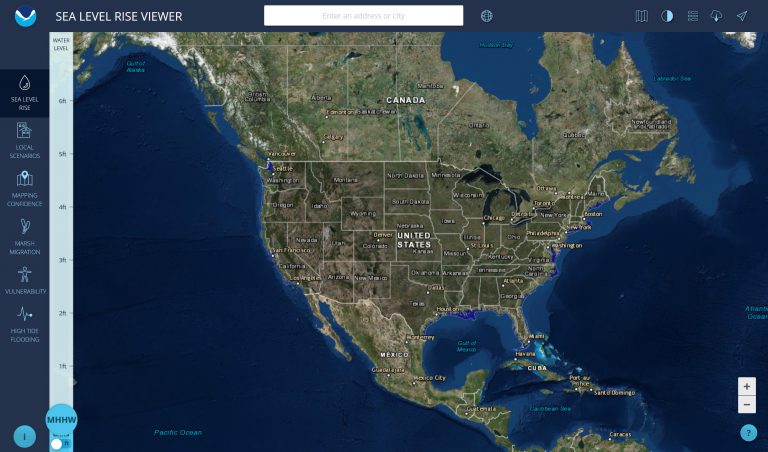
This tool allows users to visualize community-level impacts from coastal flooding or sea level rise and provides easy access to inundation and elevation data via NOAA’s Digital Coast.
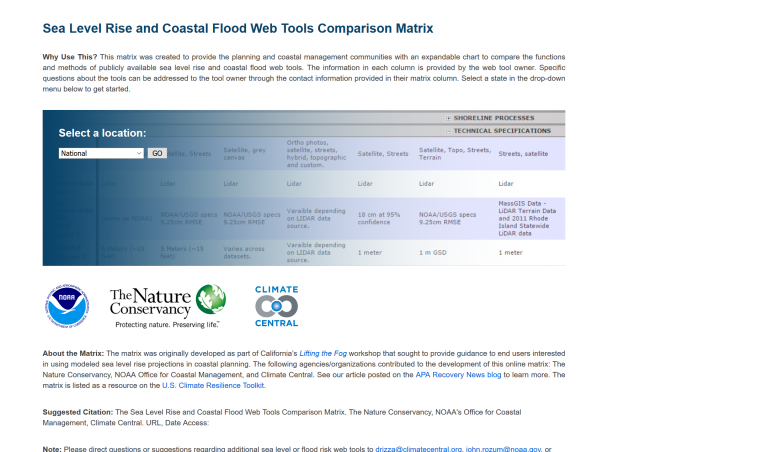
This matrix helps coastal management communities compare web-based sea level rise and coastal flood risk tools available for their state.
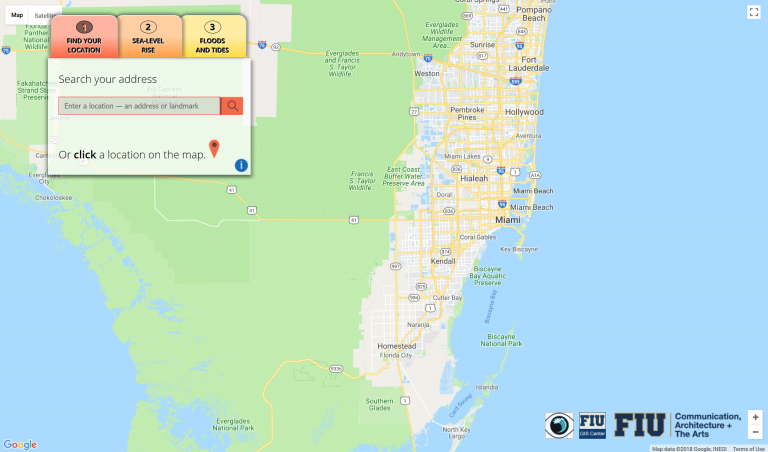
An interactive sea level rise viewer designed to give South Floridians a better understanding of how sea level rise might impact their neighborhoods.