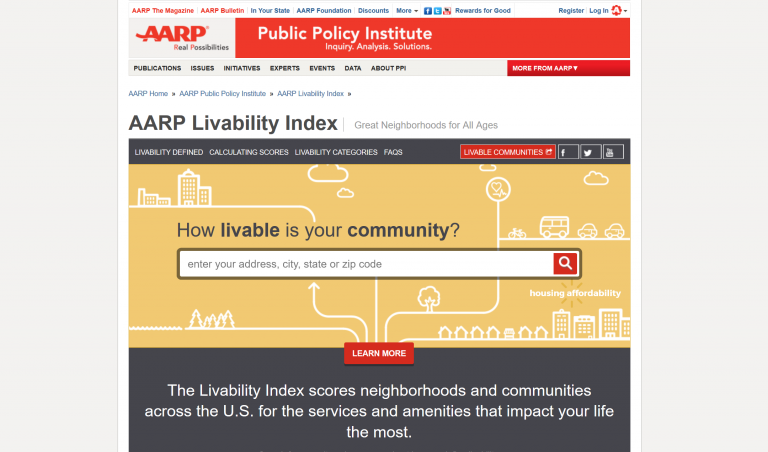
The AARP Livability Index assesses seven broad categories of community livability: housing, neighborhood, transportation, environment, health, engagement, and opportunity.
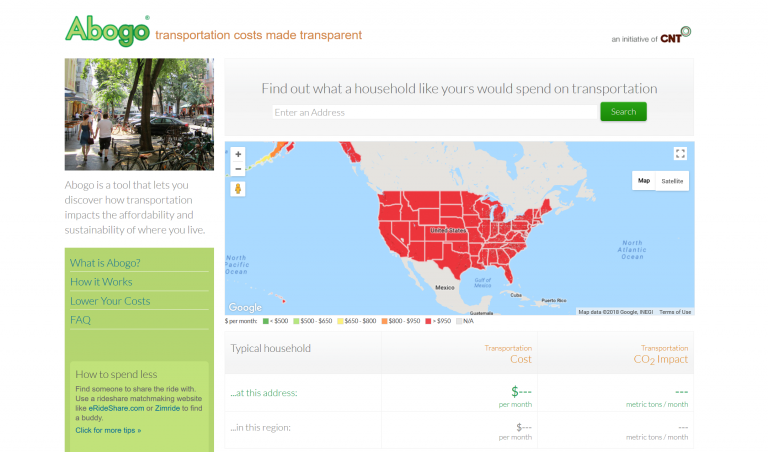
Abogo reveals how transportation impacts the affordability and sustainability of where you live.
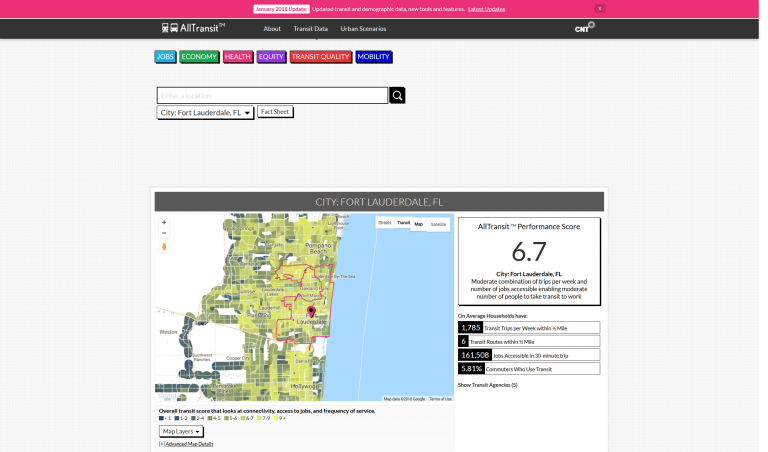
The All Transit Performance Score is a comprehensive score that looks at connectivity, access to land area and jobs, frequency of service, and the percent of commuters who use transit to travel to work.
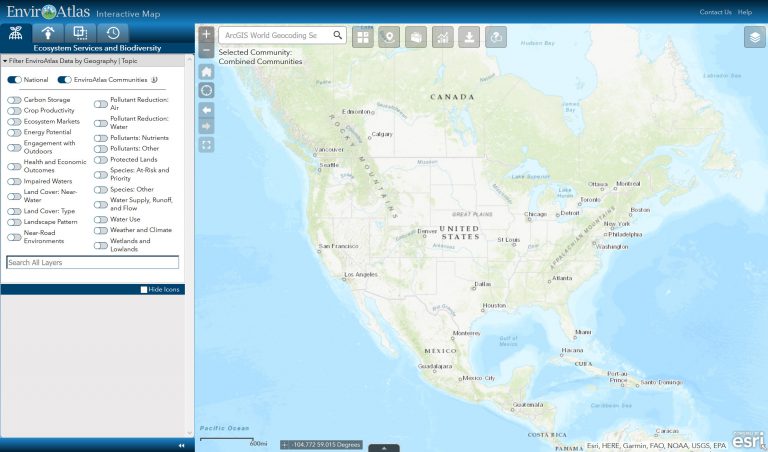
EnviroAtlas is designed for staff from all levels of government, environmental and public health professionals, researchers, educators, non-governmental organizations, and anyone else with an interest in ecosystem services...
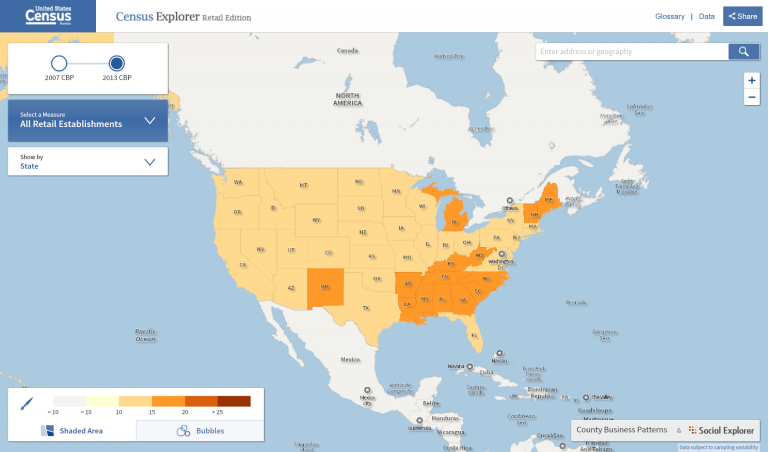
Census Explorer is the U.S. Census Bureau’s interactive map series, including Young Adults: Then and Now Edition; Population Estimate Edition; People, Education, and Income Edition; and Commuting Edition.
The Calculator reveals the benefits of affordable housing near transit to help developers select better sites, design unit mix, and educate the public and decision makers.
FloodHelpNY is a platform for engaging and informing New York City homeowners about how they can protect their home and finances from flooding that is expected to worsen with rising sea levels caused by climate change.
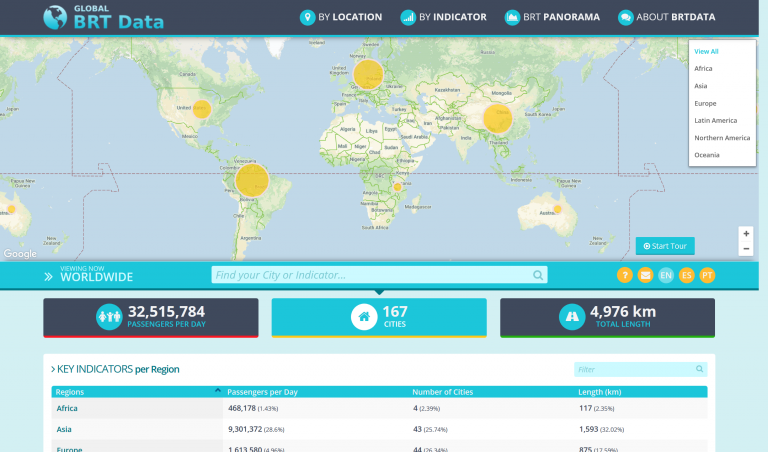
The BRTData is a public platform to share Bus Rapid Transit (BRT) and bus priority systems data.
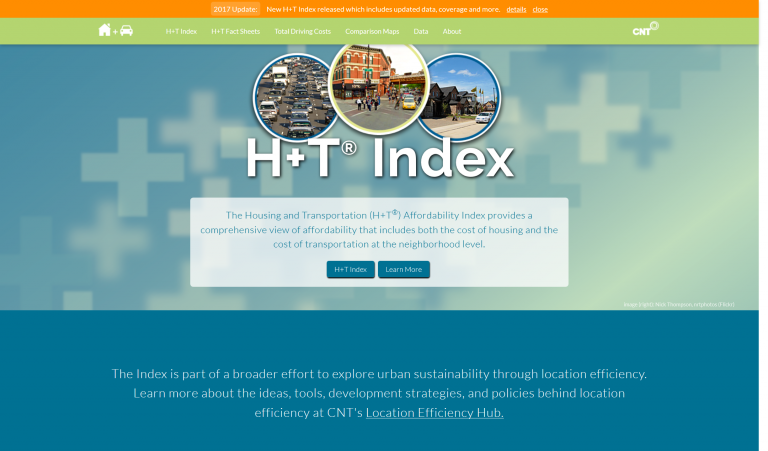
The Housing and Transportation (H+T®) Affordability Index provides a comprehensive view of affordability that includes both the cost of housing and the cost of transportation at the neighborhood level.
