Pompano Culture in Recirculating Aquaculture Systems
Pompano Culture in Recirculating Aquaculture Systems
Paul S. Wills
Funding Thanks to Florida Department of Agriculture, Division of Aquaculture
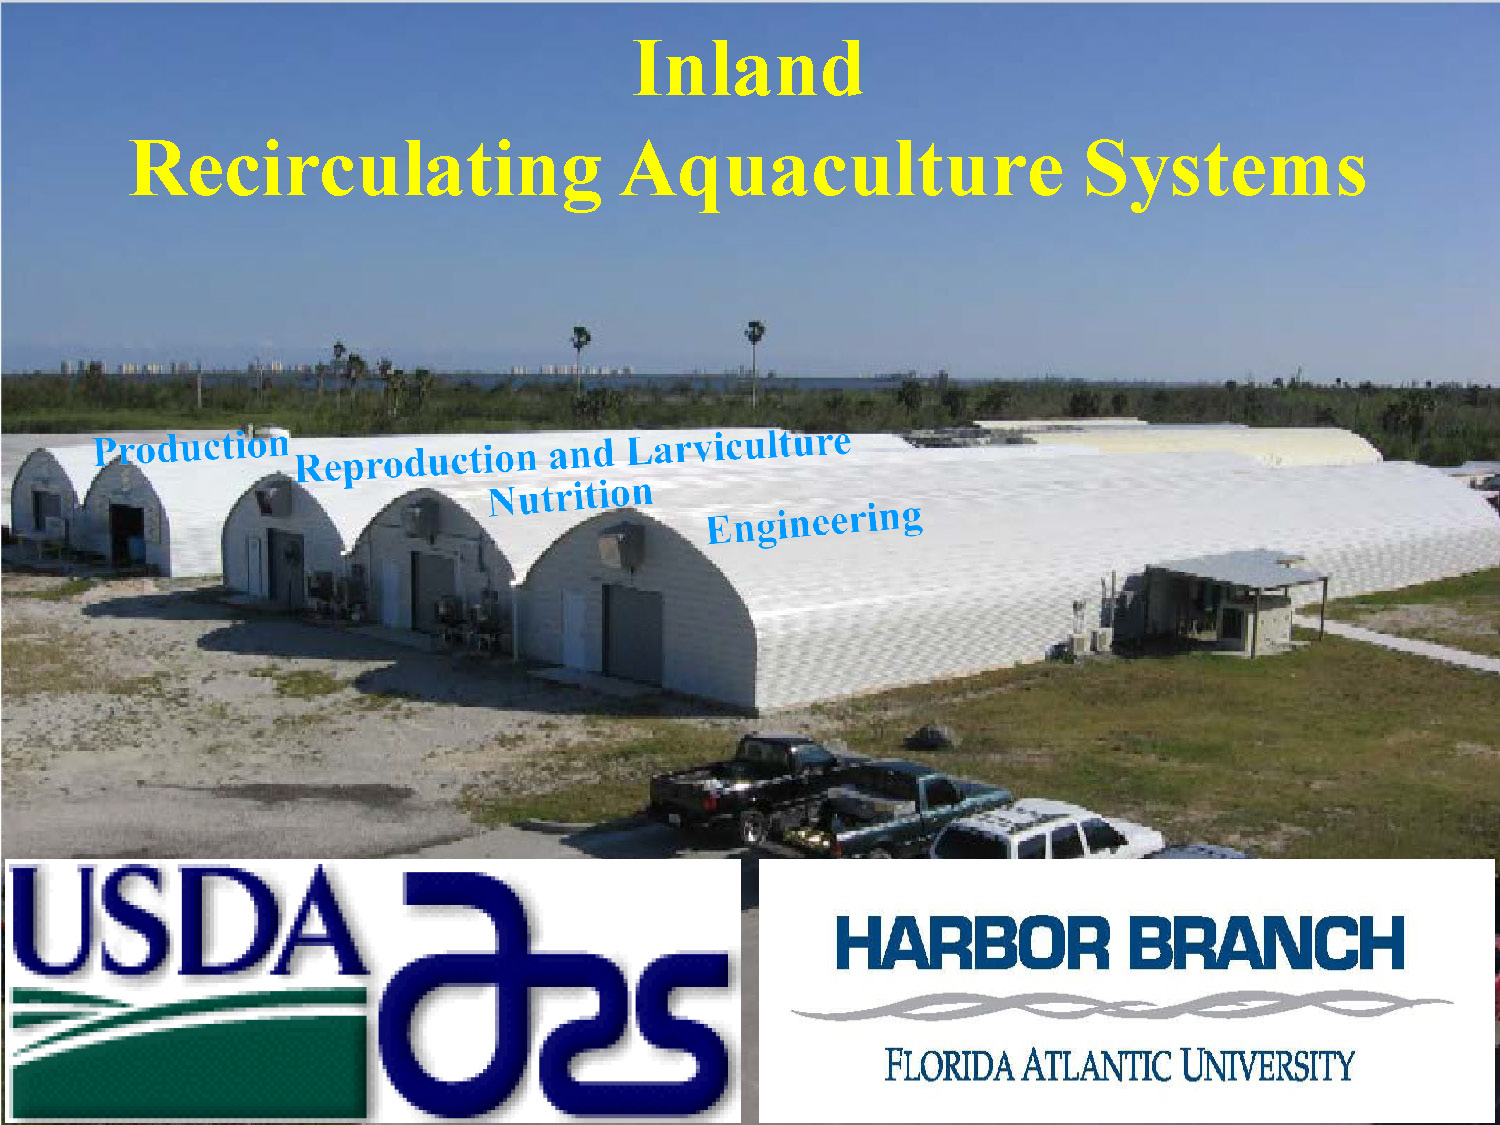
Title: Inland Recirculating Aquaculture Systems
This is an aerial-level photograph of a research complex located in a flat, coastal landscape. Five long, white, arched Quonset-style buildings are lined up in a row. Overlaid blue text identifies the functions of the buildings: Production, Reproduction and Larviculture, Nutrition, and Engineering. At the bottom, logos for the USDA Agricultural Research Service (ARS) and Harbor Branch Oceanographic Institute at Florida Atlantic University are displayed.
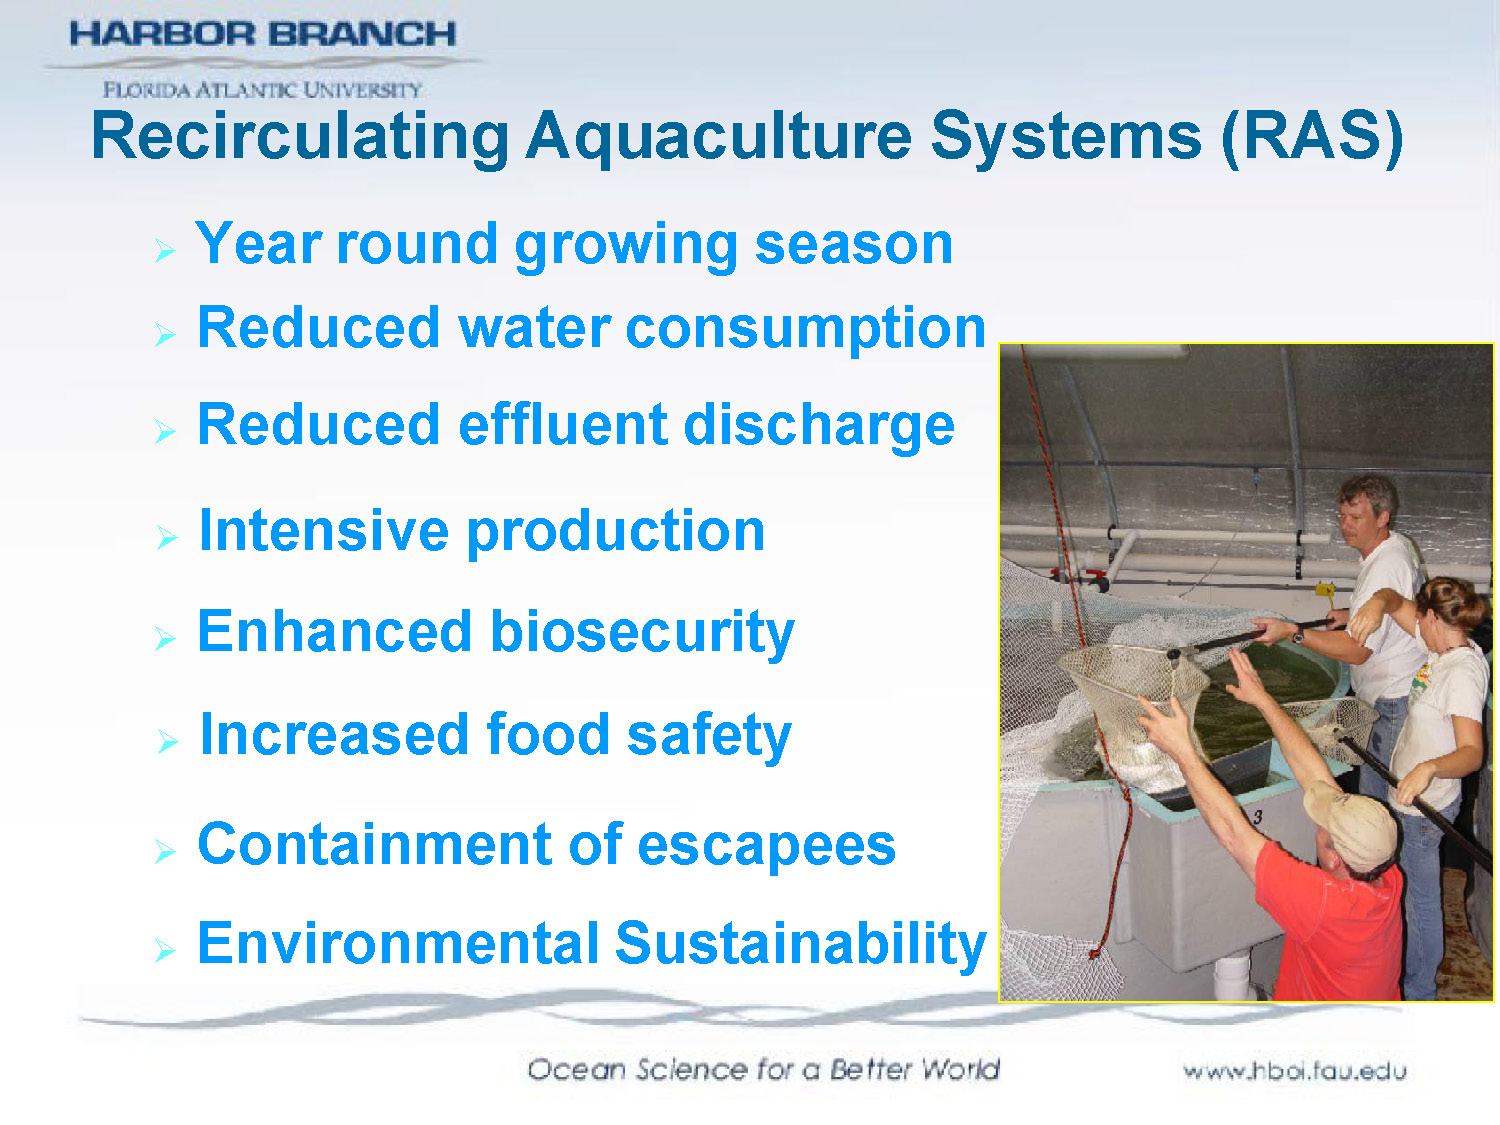
Recirculating Aquaculture Systems (RAS)
- Year round growing season
- Reduced water consumption
- Reduced effluent discharge
- Intensive production
- Enhanced biosecurity
- Increased food safety
- Containment of escapees
- Environmental Sustainability
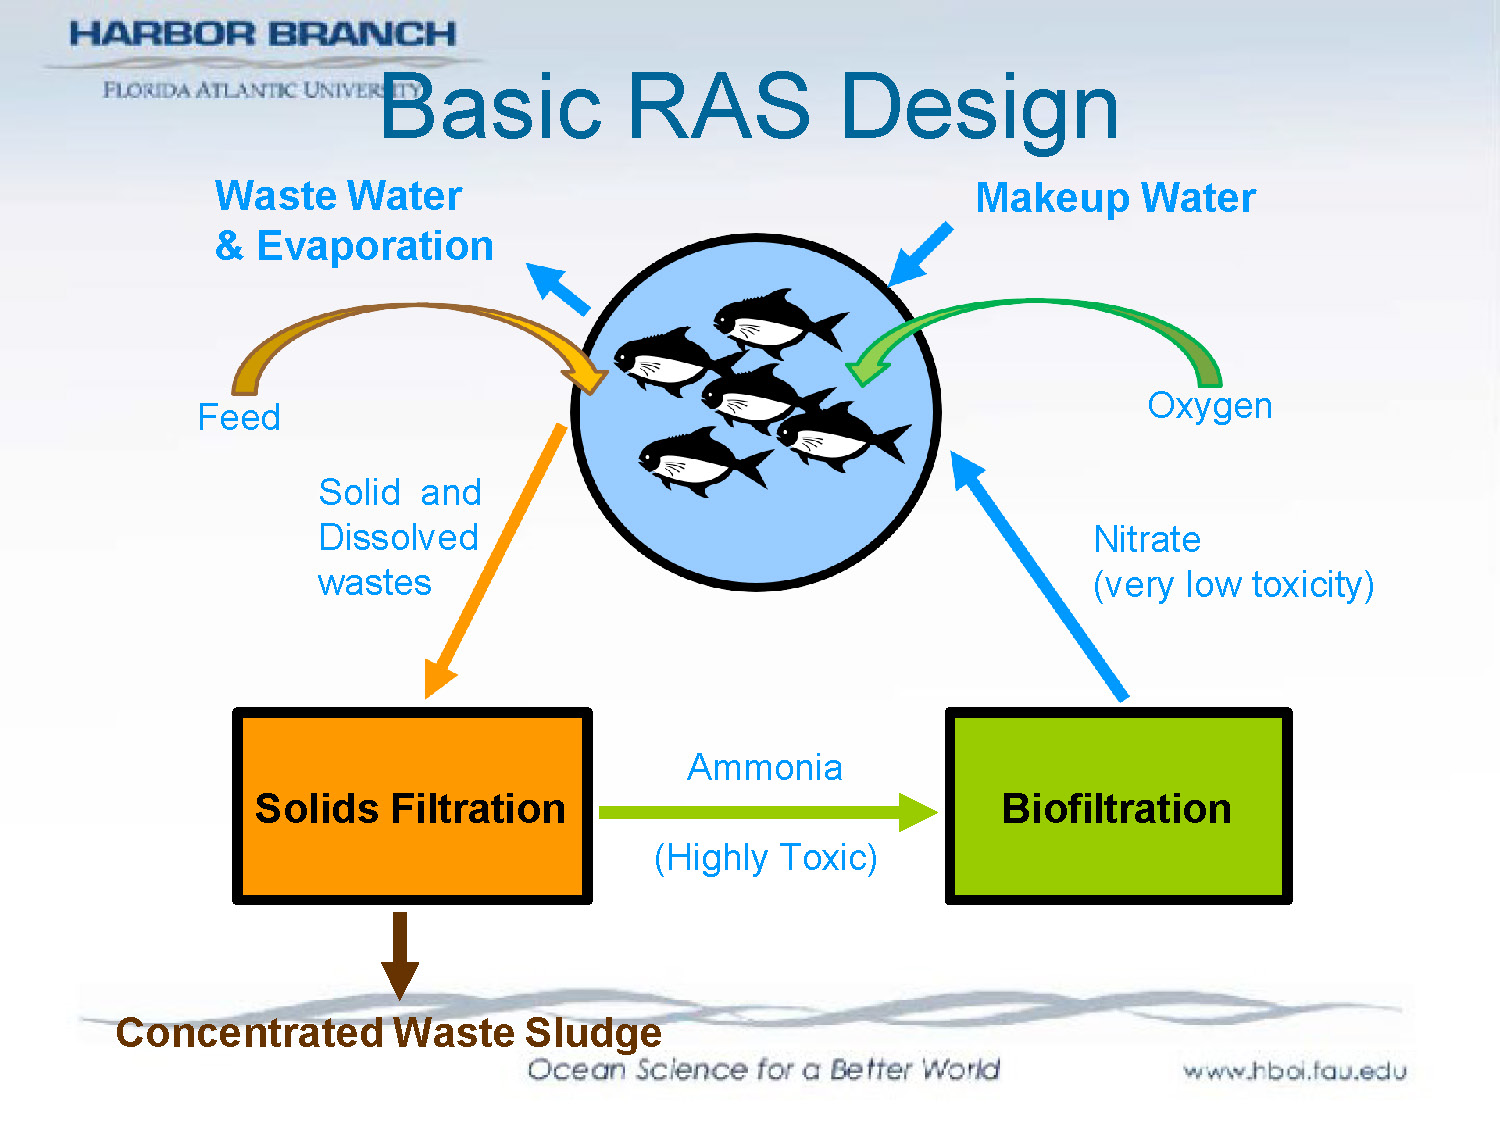
Basic RAS Design
The diagram illustrates the basic recirculating aquaculture system design showing the flow of water and waste treatment processes. Key components include:
Solids Filtration: Removes solid and dissolved wastes from the system.
Biofiltration: Converts ammonia (highly toxic) to nitrate (very low toxicity).
System Inputs: Makeup water & evaporation, oxygen, and feed enter the system.
System Outputs: Waste water and concentrated waste sludge exit the system.
The water continuously recirculates through the filtration systems to maintain water quality for the fish.
Advanced RAS design and Operation
HBOI-FAU ACTED Workshop:
"Recirculating Aquaculture Systems: Design, Engineering and Operation"
Instructors: Michael Timmons and Jim Ebeling
Dates: October 17-19, 2013
Cost: $450
Information: See Jill Sunderland
or, www.aquaculture-online.org
or, www.fau.edu/hboi
or, call 772-242-2506
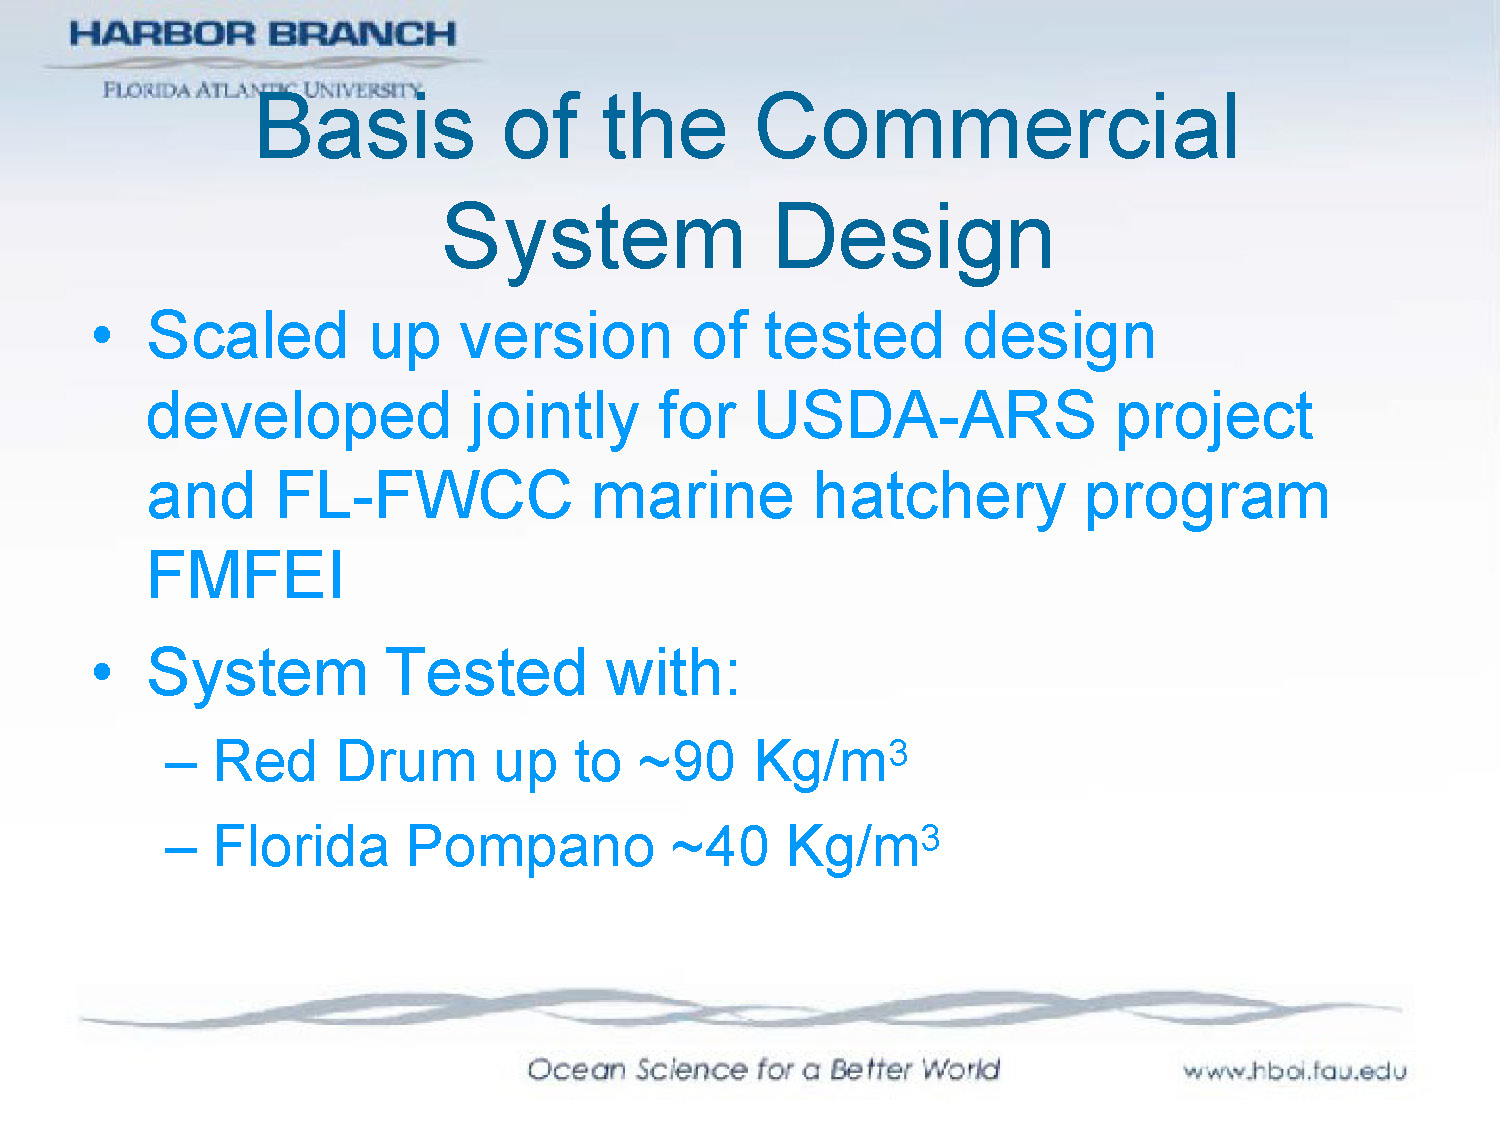
Basis of the Commercial System Design
- Scaled up version of tested design developed jointly for USDA-ARS project and FL-FWCC marine hatchery program FMFEI
- System Tested with:
- Red Drum up to ~90 Kg/m3
- Florida Pompano ~40 Kg/m3
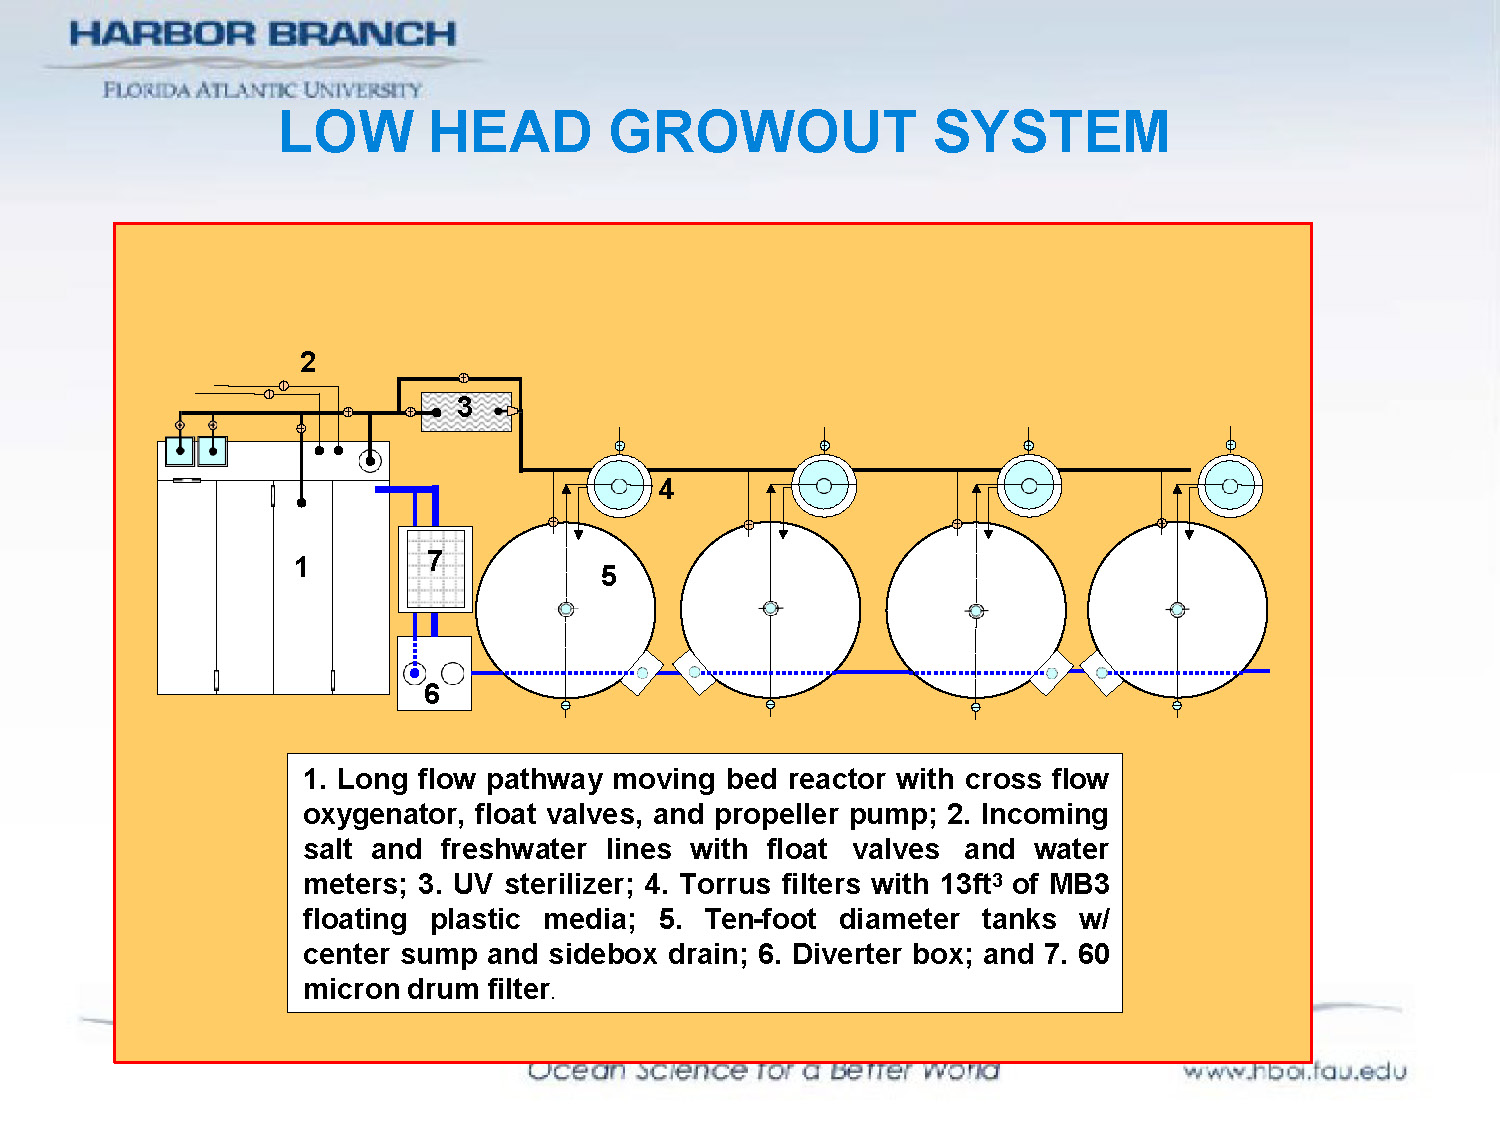
LOW HEAD GROWOUT SYSTEM
System components labeled 1-7:
- Long flow pathway moving bed reactor with cross flow oxygenator, float valves, and propeller pump
- Incoming salt and freshwater lines with float valves and water meters
- UV sterilizer
- Torrus filters with 13ft3 of MB3 floating plastic media
- Ten-foot diameter tanks w/ center sump and sidebox drain
- Diverter box
- 60 micron drum filter
The image shows both a schematic diagram and a photograph of the actual system installation.
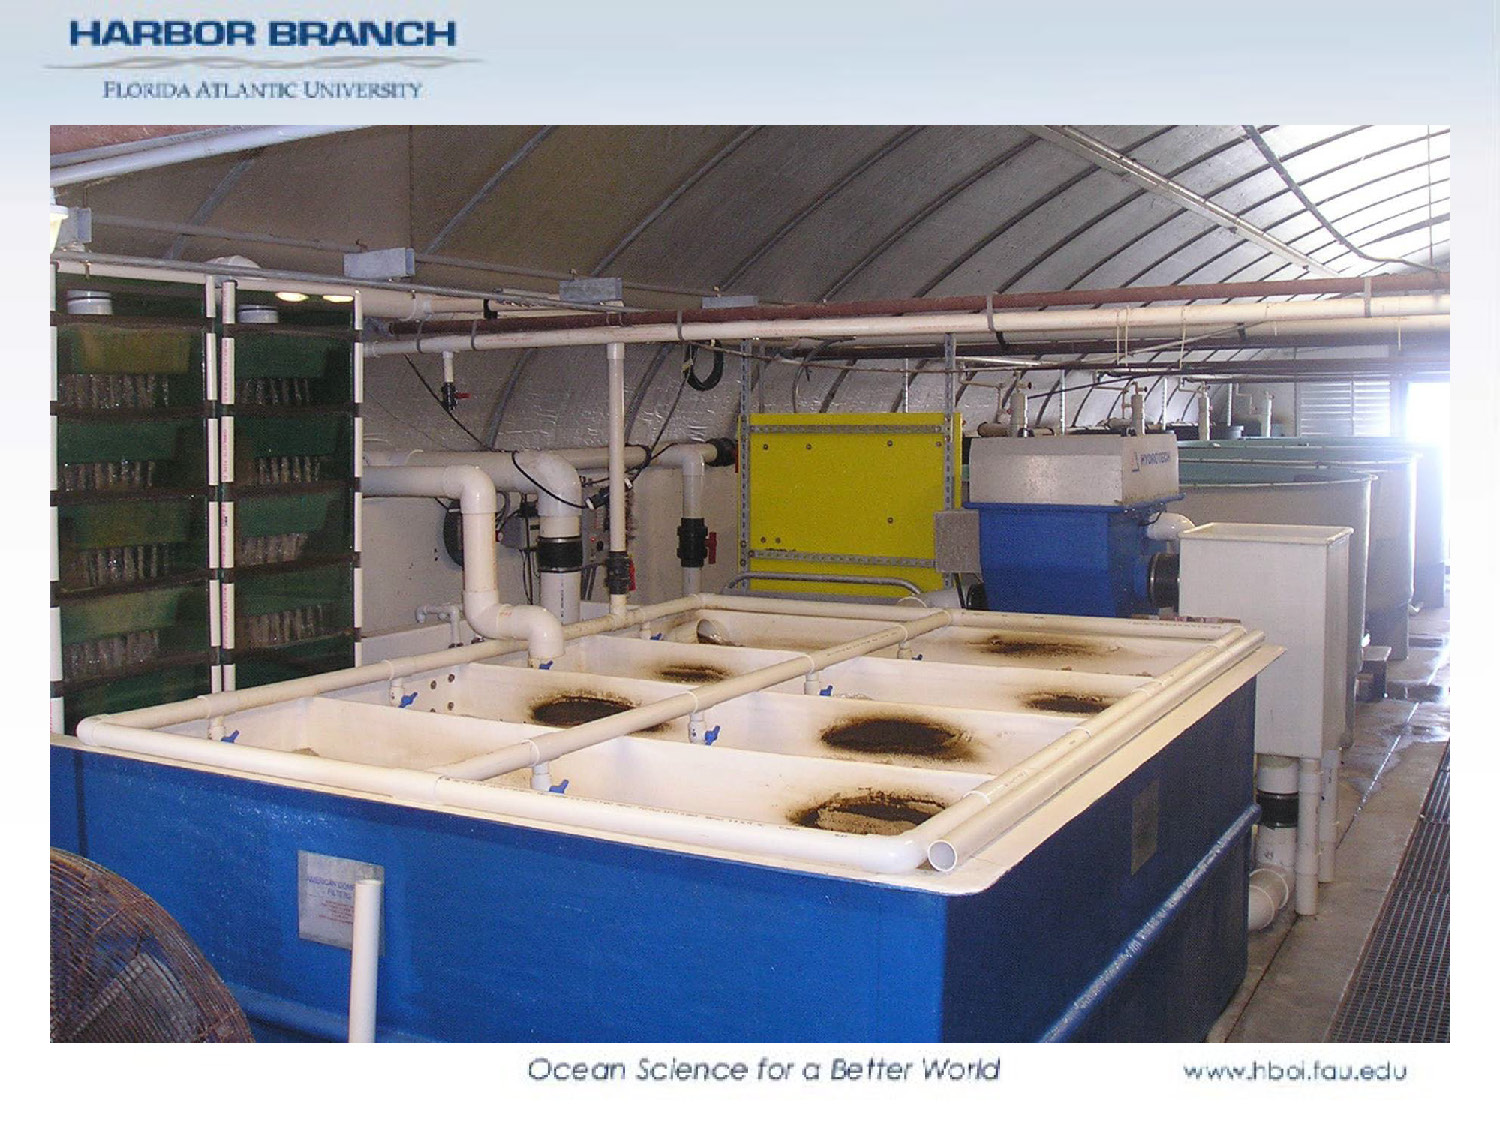
TIndustrial aquaculture equipment. In the foreground is a large, rectangular blue tank with white PVC framing on top, divided into several sections with visible dark sediment or bio-matter. Extensive white PVC plumbing runs along the walls and ceiling. In the background, there is a blue mechanical filtration unit and several large circular tanks.
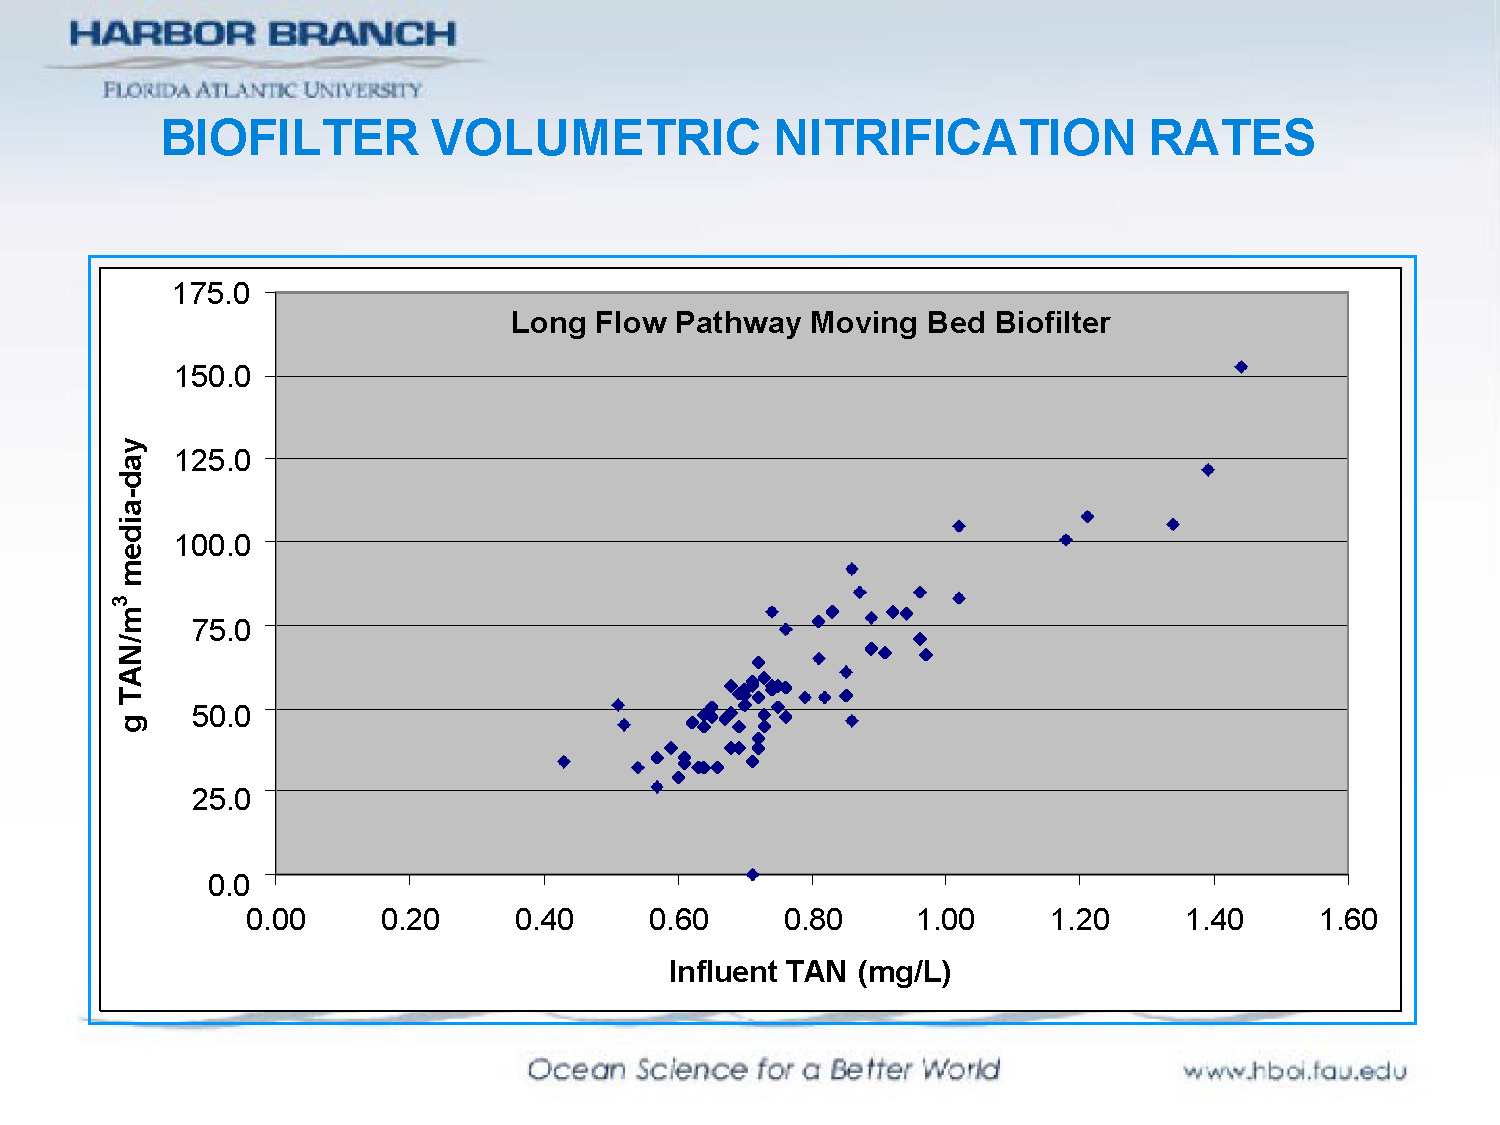
Long Flow Pathway Moving Bed Biofilter
BIOFILTER VOLUMETRIC NITRIFICATION RATES
The graph displays the relationship between influent TAN (Total Ammonia Nitrogen) concentration and nitrification rates in the moving bed biofilter.
X-axis: Influent TAN (mg/L), ranging from 0.00 to 1.60
Y-axis: g TAN/m3 media-day, ranging from 0.0 to 175.0
Data trend: The graph shows an increasing nitrification rate as influent TAN concentration increases, demonstrating the biofilter's capacity to process ammonia. The rate increases from near zero at low TAN concentrations to approximately 125-150 g TAN/m3 media-day at higher influent TAN concentrations around 1.4-1.6 mg/L.
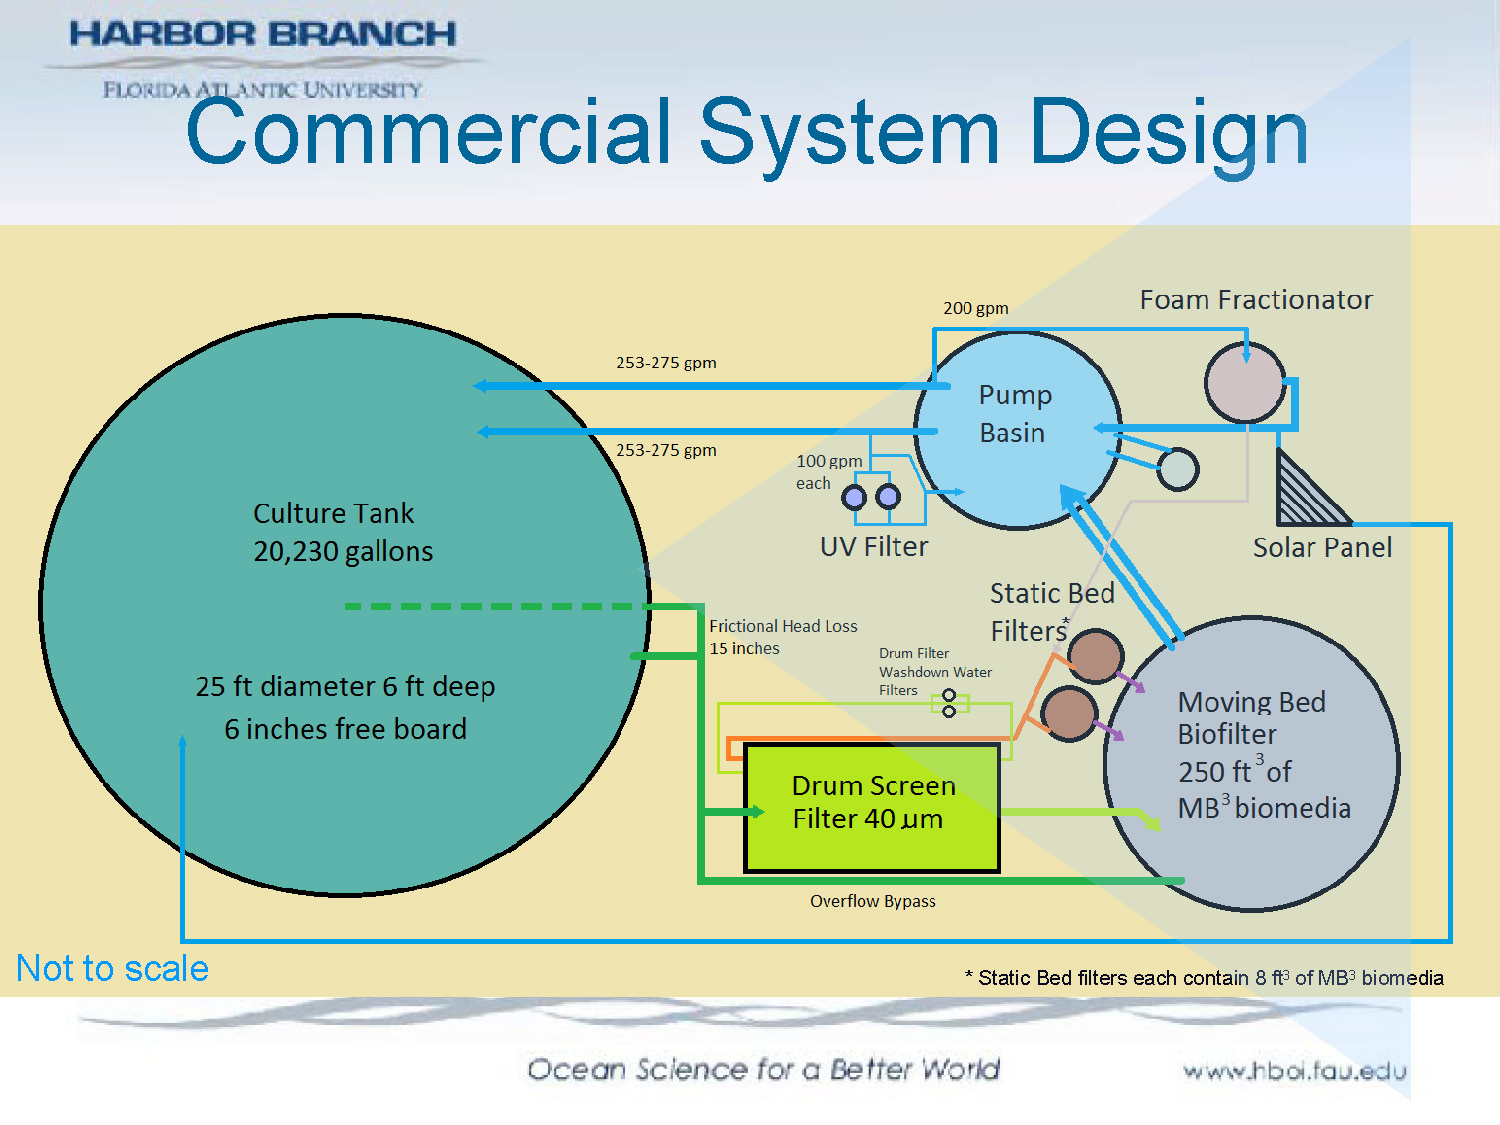
Commercial System Design
Not to scale
* Static Bed filters each contain 8 ft3 of MB3 biomedia
The diagram shows a comprehensive commercial RAS layout including culture tanks, moving bed biofilters, static bed filters, drum screen filter, UV sterilizers, foam fractionator, oxygen injection systems, and water flow pathways connecting all components.
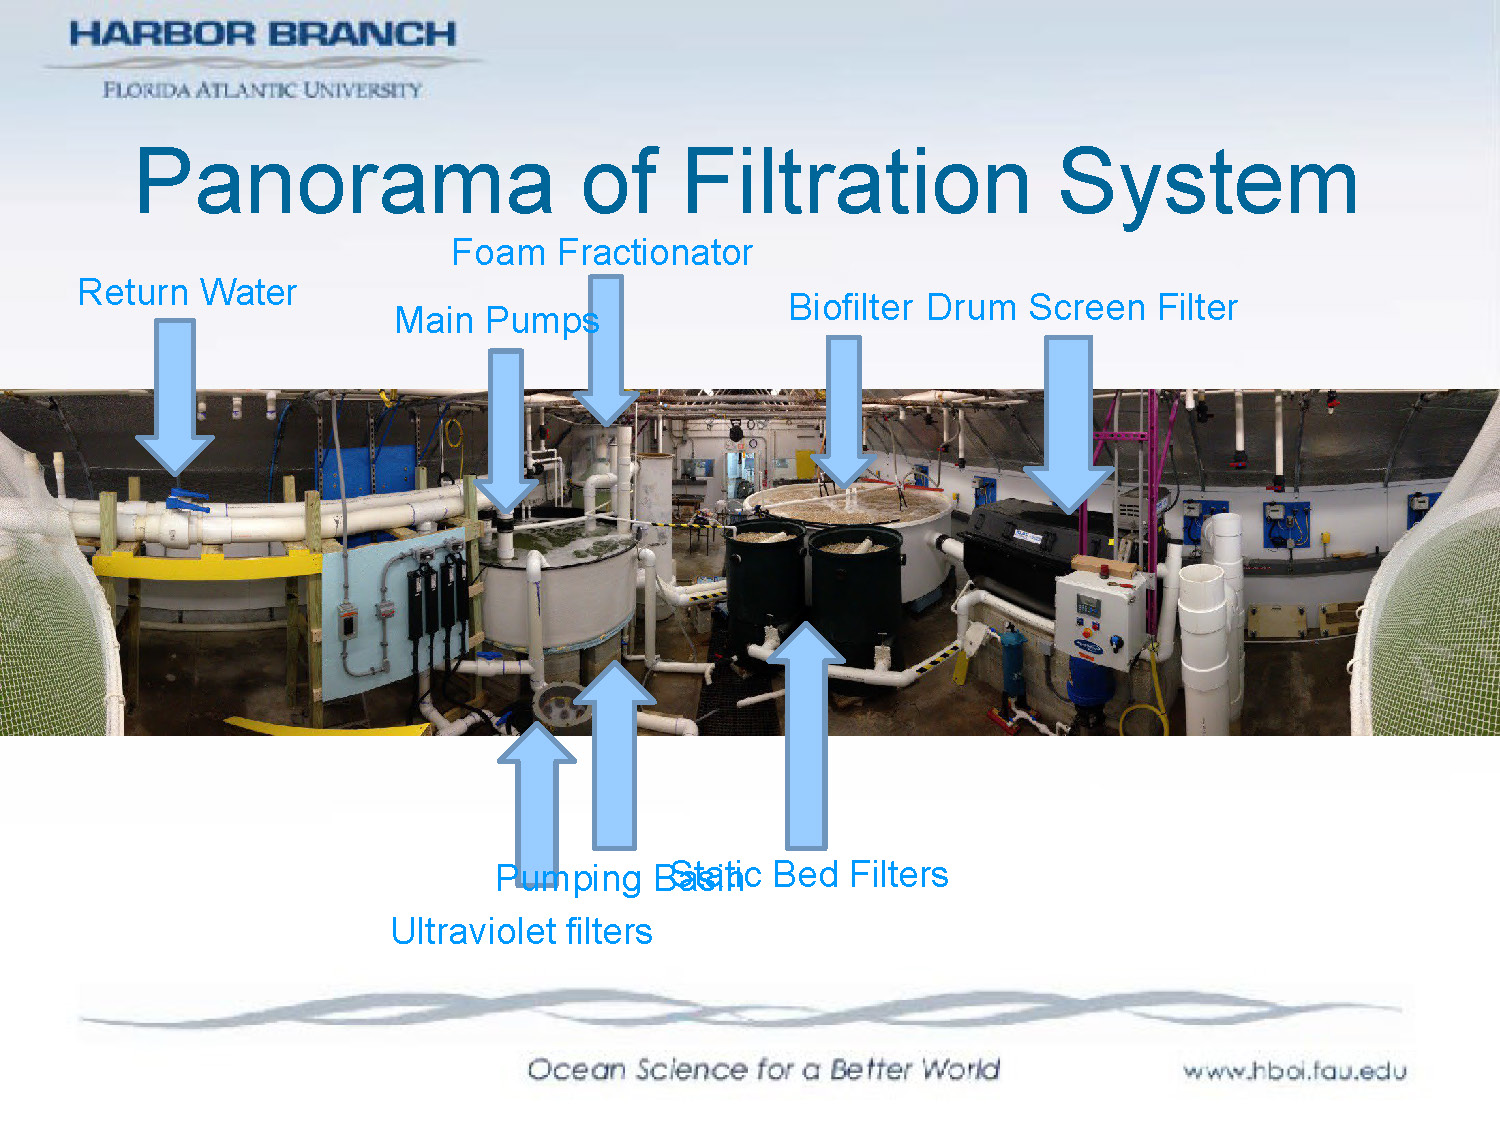
Panorama of Filtration System
The photograph shows the complete filtration system with labeled components including:
- Biofilter
- Drum Screen Filter
- Foam Fractionator
- Main Pumps
- Return Water Pumping
- Static Bed Filters
- Ultraviolet filters
The image provides a real-world view of how these components are arranged in the operational system.
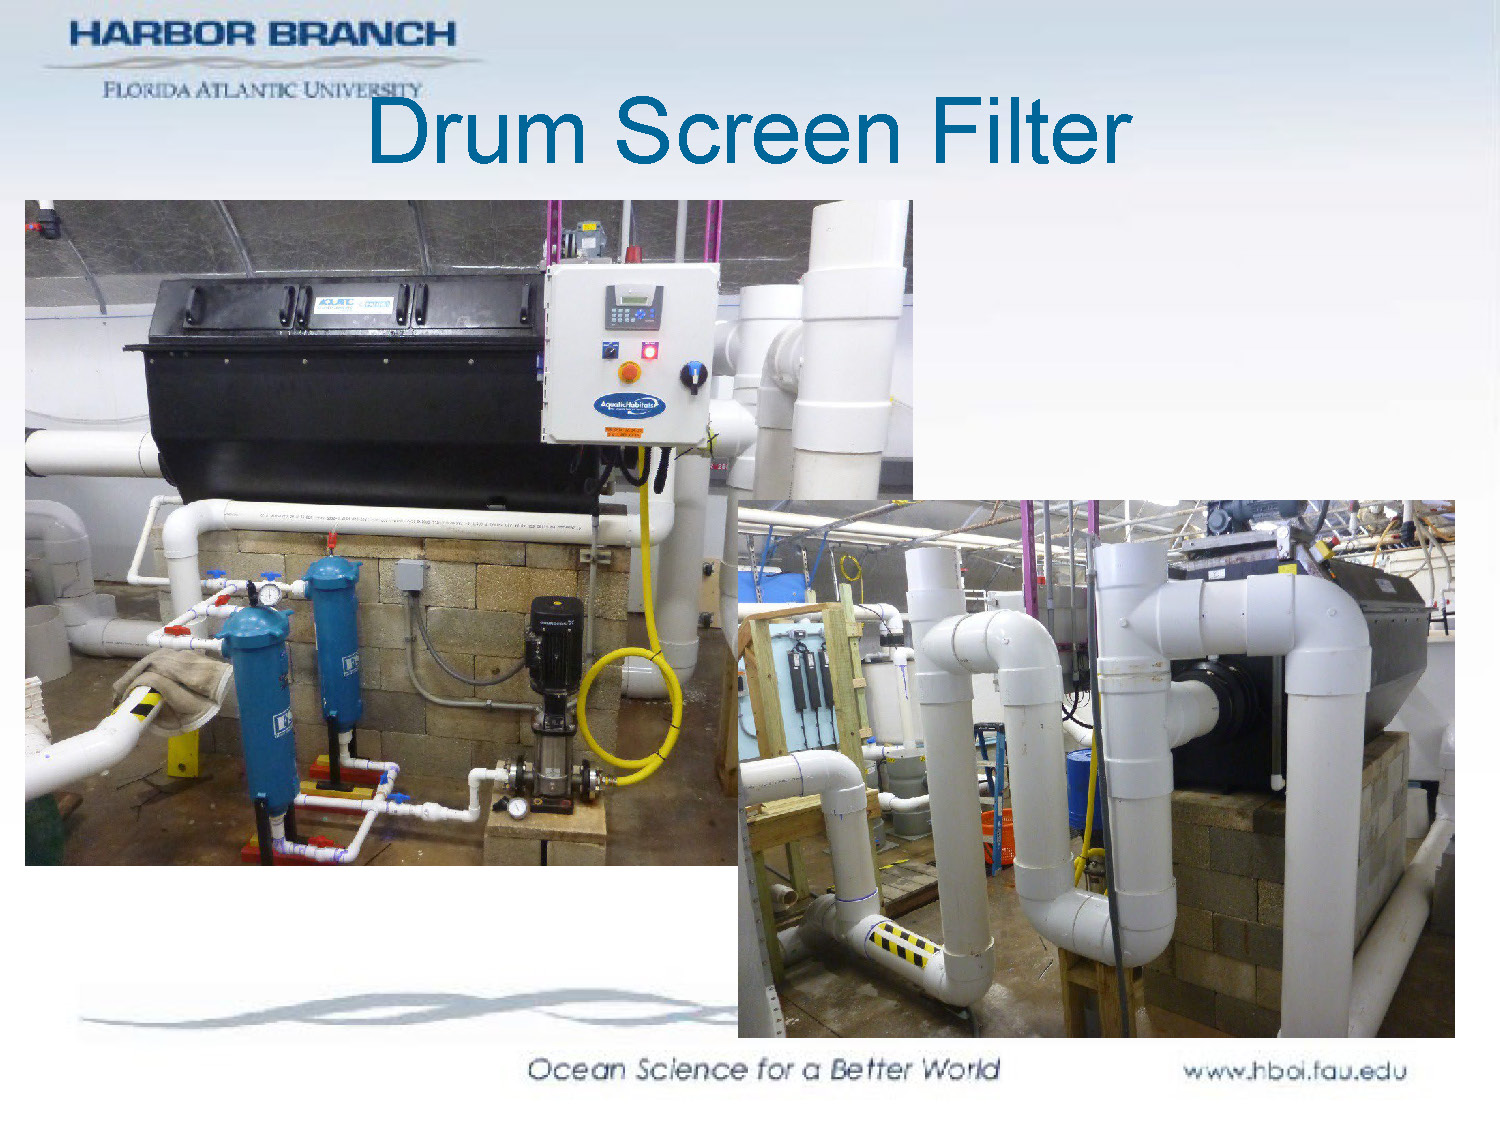
Drum Screen Filter
The image shows a close-up view of the drum screen filter, which is a cylindrical rotating filter used to remove solid waste particles from the water.

Microscreen Cleaning Process
The image captures the microscreen filter during its cleaning cycle, showing water spray removing accumulated solids from the screen surface.
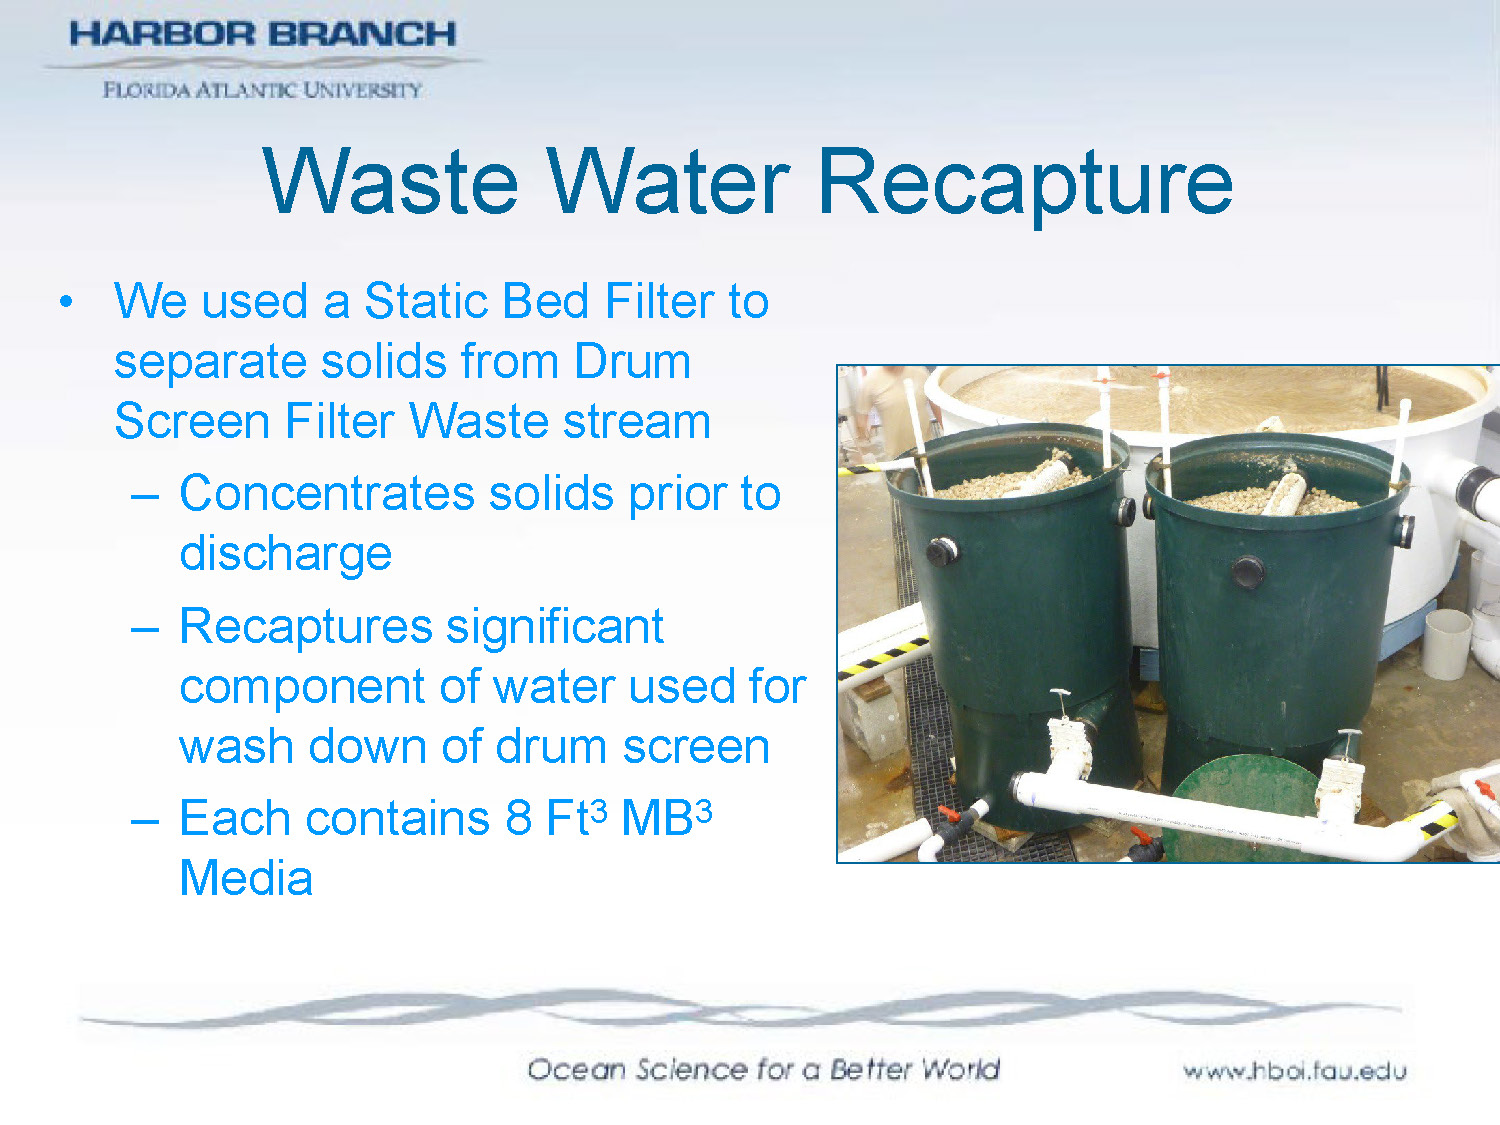
Waste Water Recapture
- We used a Static Bed Filter to separate solids from Drum Screen Filter Waste stream
- Concentrates solids prior to discharge
- Recaptures significant component of water used for wash down of drum screen
- Each contains 8 Ft3 MB3 Media
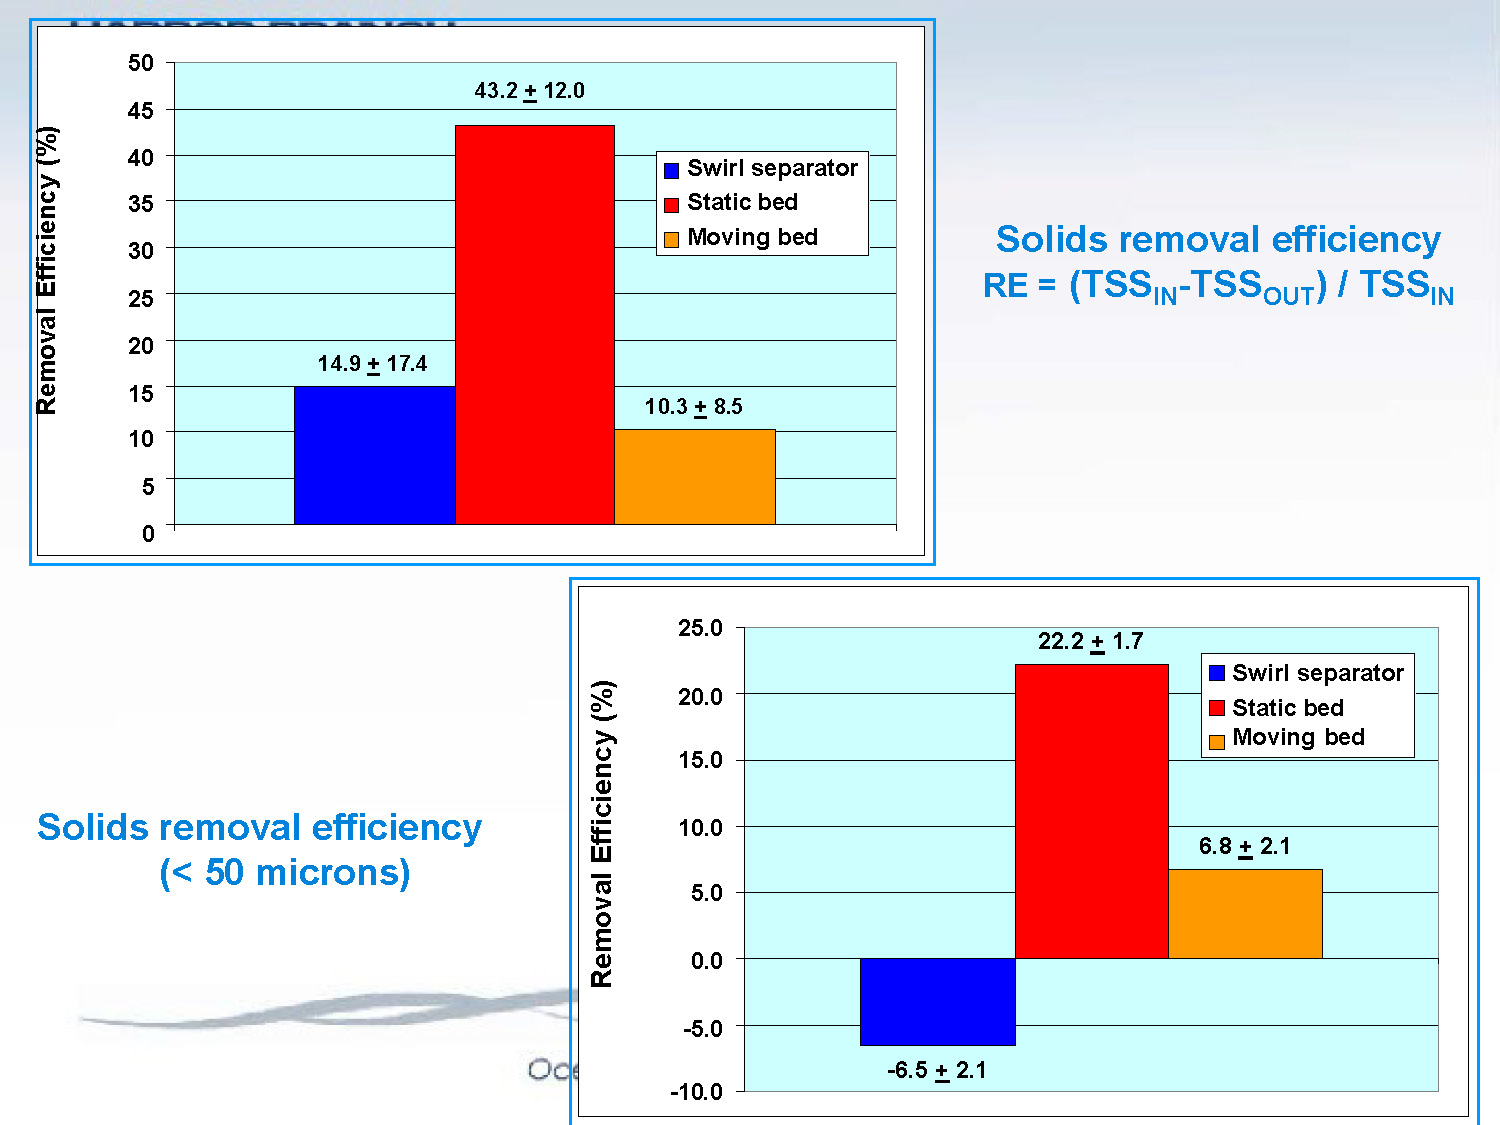
Solids removal efficiency
RE = (TSSIN-TSSOUT) / TSSIN
The slide contains two bar charts showing removal efficiency percentages:
Chart 1: Overall Solids Removal Efficiency
| Filter Type | Removal Efficiency (%) |
|---|---|
| Swirl separator | 14.9 ± 17.4 |
| Static bed | 43.2 ± 12.0 |
| Moving bed | 10.3 ± 8.5 |
Chart 2: Solids removal efficiency (< 50 microns)
| Filter Type | Removal Efficiency (%) |
|---|---|
| Swirl separator | -6.5 ± 2.1 |
| Static bed | 22.2 ± 1.7 |
| Moving bed | 6.8 ± 2.1 |
The static bed filter shows the highest removal efficiency for both overall solids and fine particles less than 50 microns.
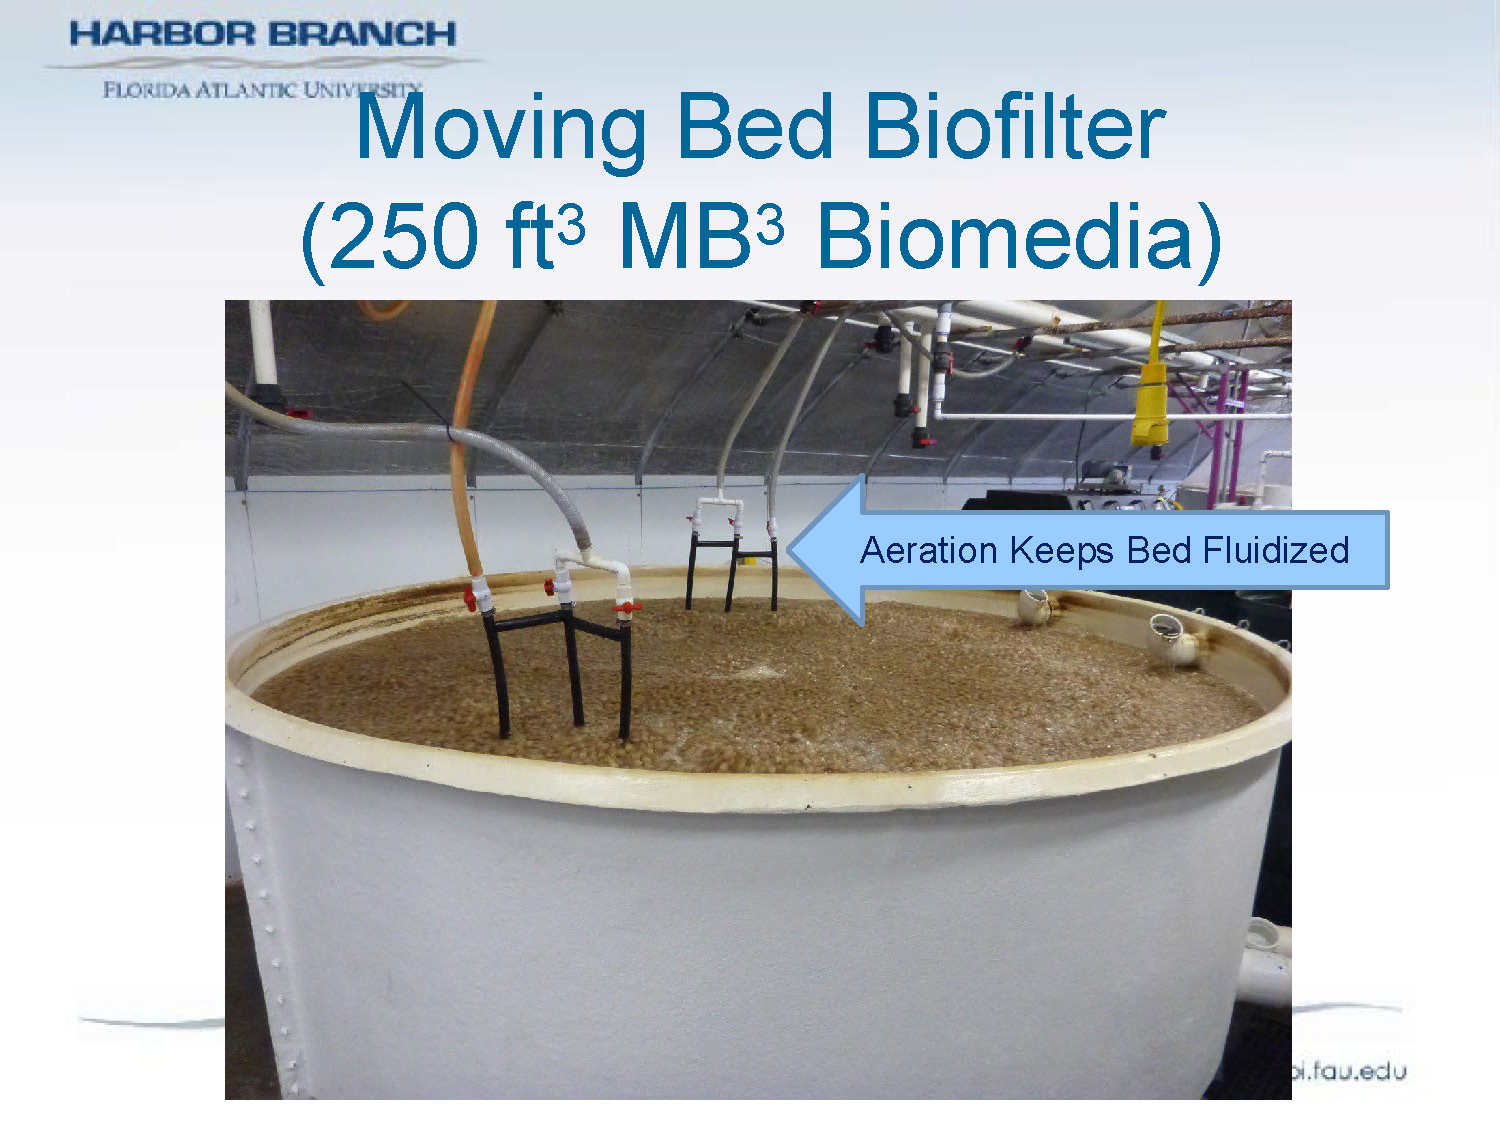
Moving Bed Biofilter (250 ft3 MB3 Biomedia)
Aeration Keeps Bed Fluidized
The image shows the moving bed biofilter in operation with visible aeration bubbles keeping the plastic biomedia in constant motion for optimal biological filtration.
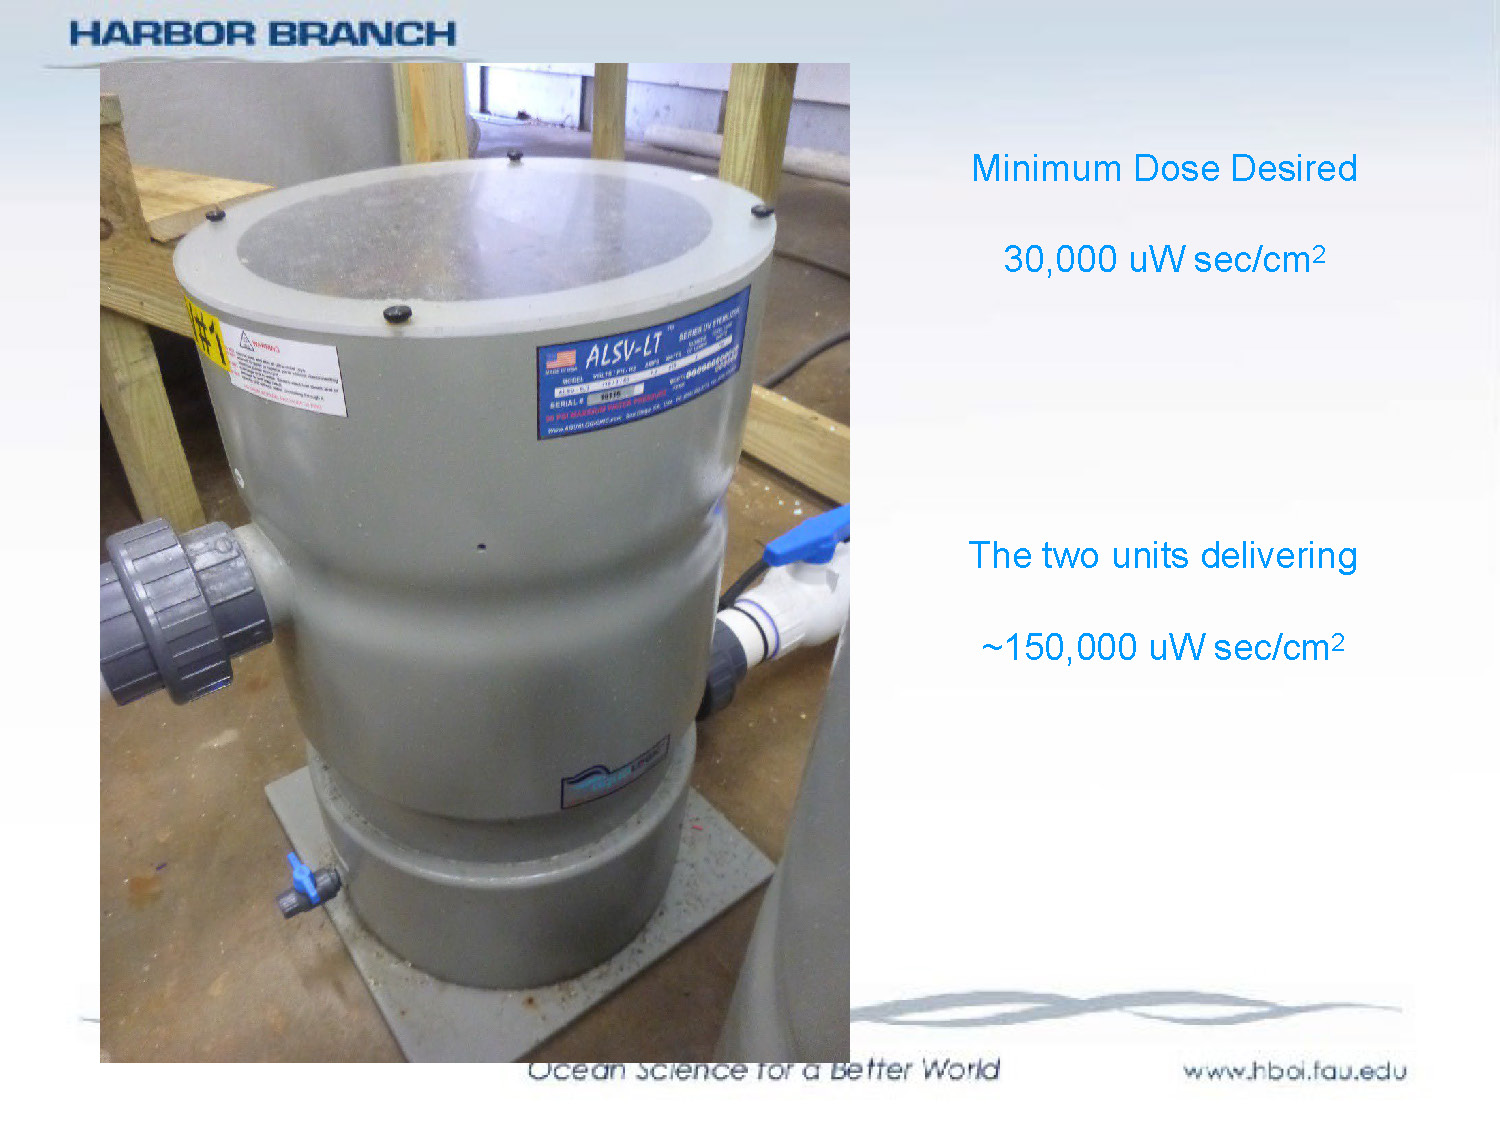
UV Sterilization
Minimum Dose Desired
30,000 uW sec/cm2
The two units delivering
~150,000 uW sec/cm2
The photograph shows two large UV sterilization units that provide significantly higher dosage than the minimum required for effective pathogen control.
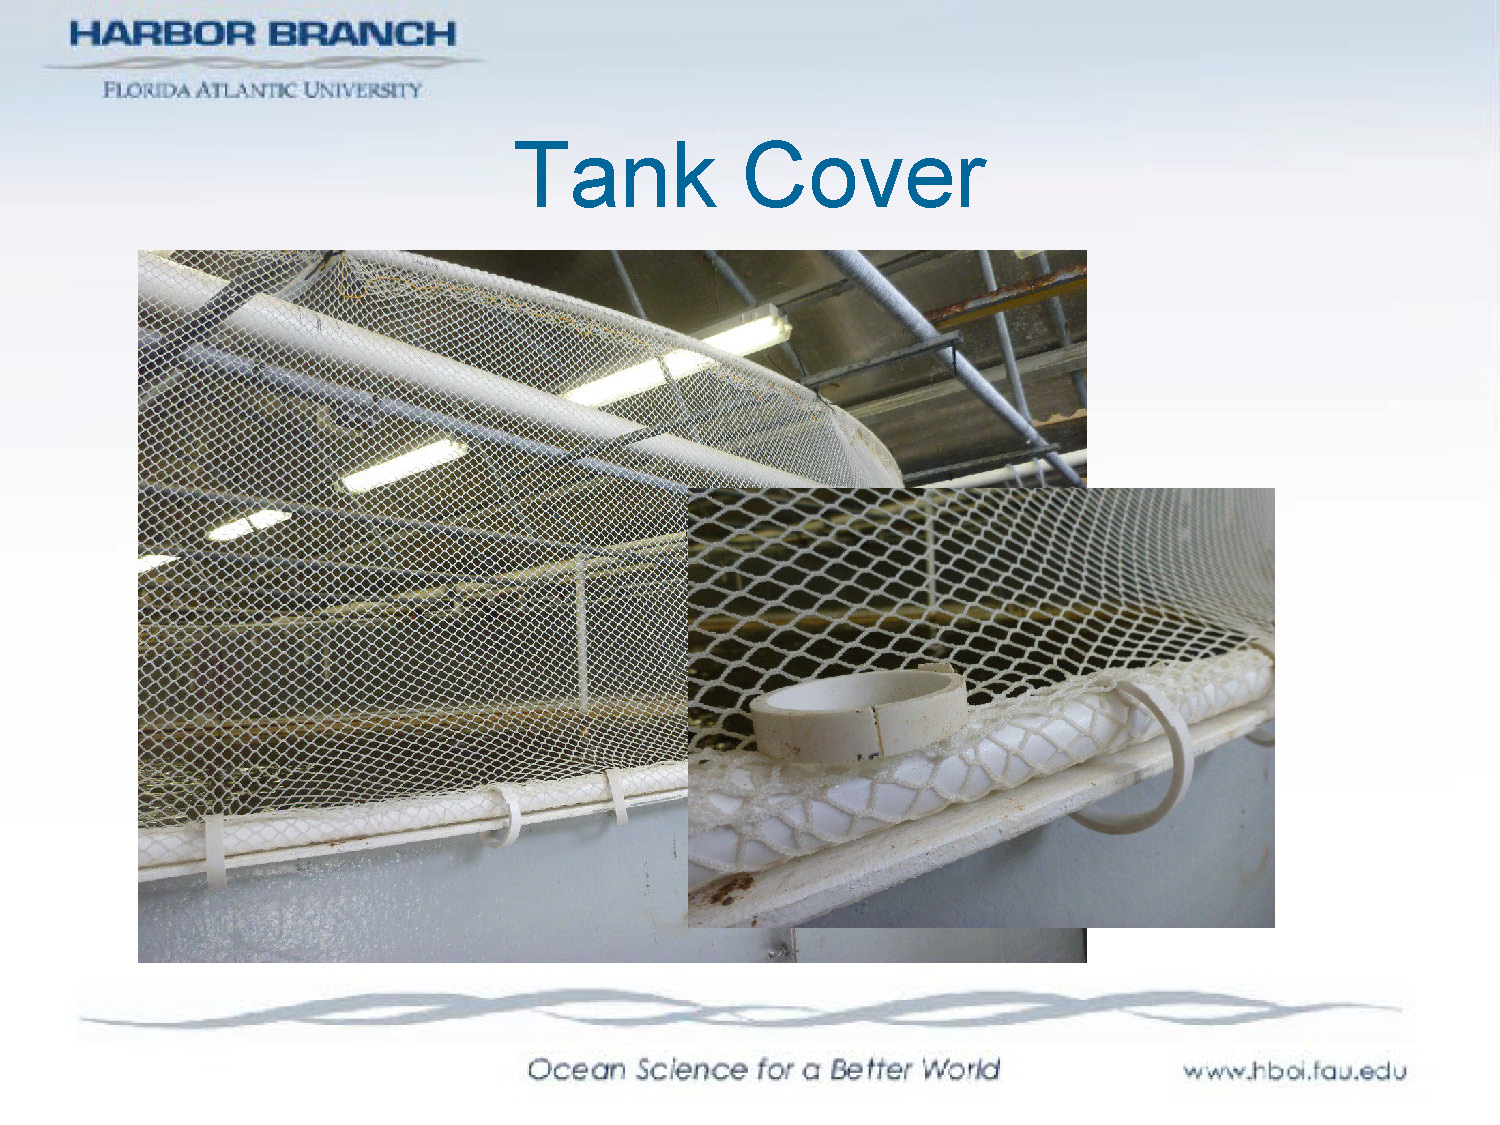
Tank Cover
The image displays the covered culture tanks, which help maintain stable environmental conditions and reduce evaporation.
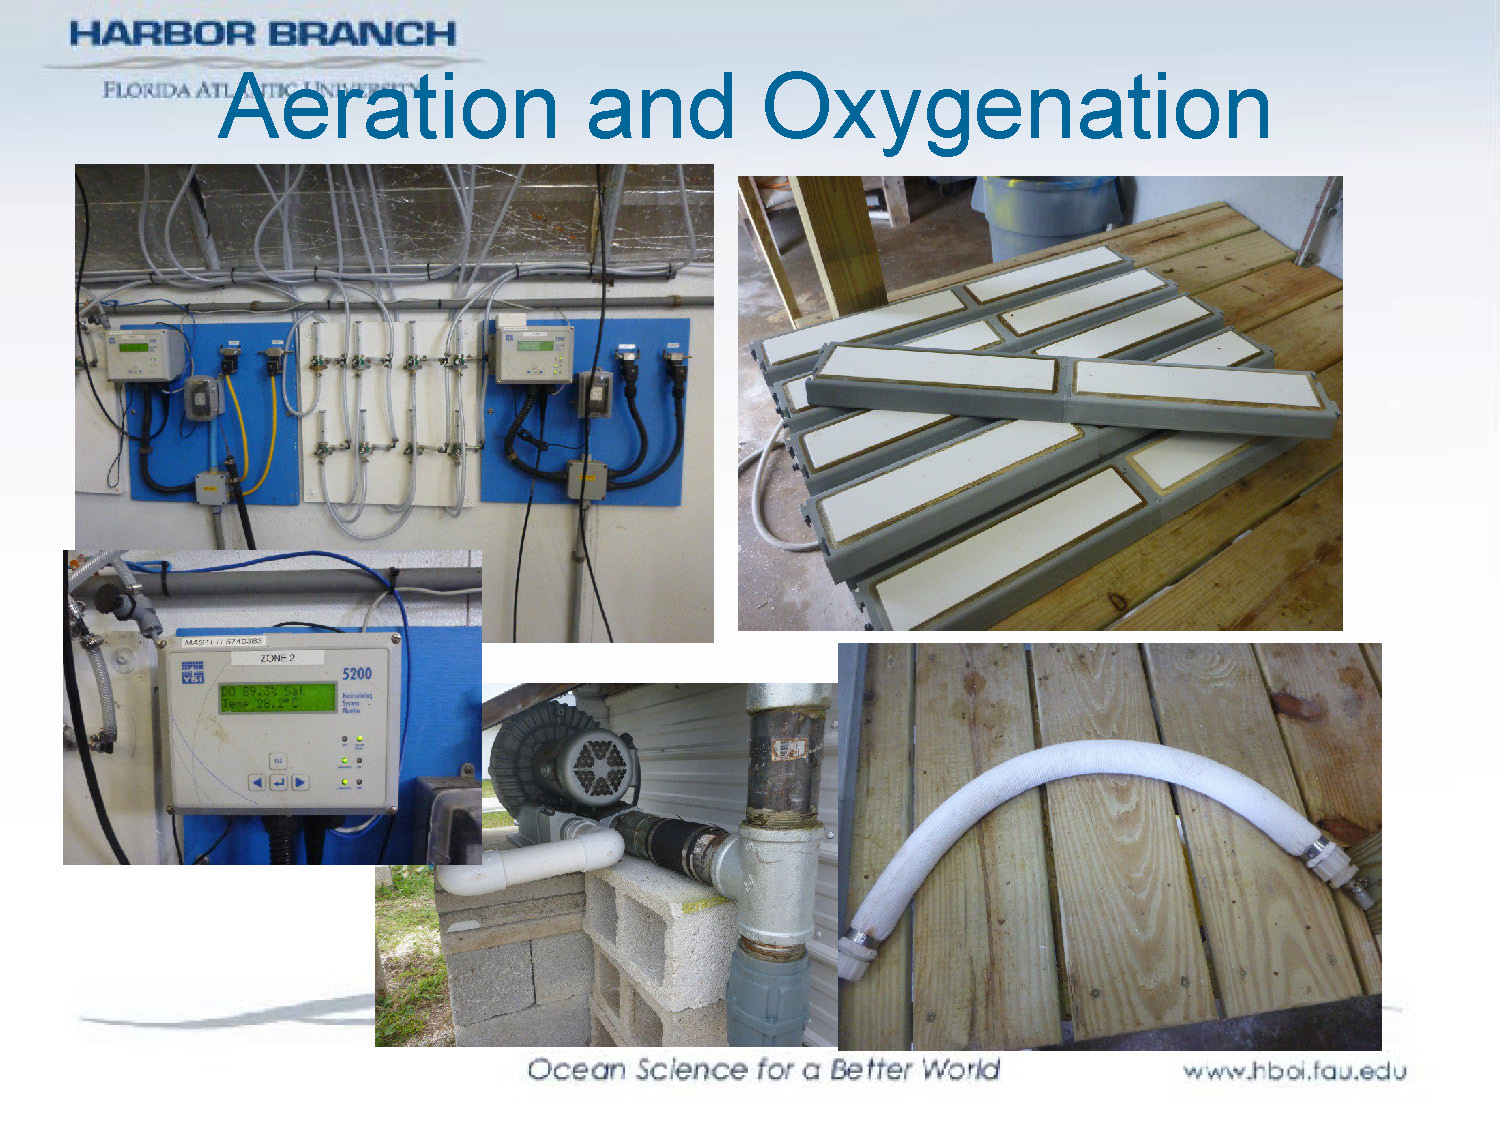
Aeration and Oxygenation.
A collage shows various technical components: 1) A wall-mounted control panel with numerous gray tubes and wires. 2) A close-up of a YSI 5200 monitoring screen showing Dissolved Oxygen at 89.3% and Temperature at 28.2°C. 3) Several long, rectangular white ceramic air diffusers sitting on a wooden pallet. 4) A large industrial regenerative blower motor. 5) A flexible white "soaker" style aeration hose on a wooden deck.
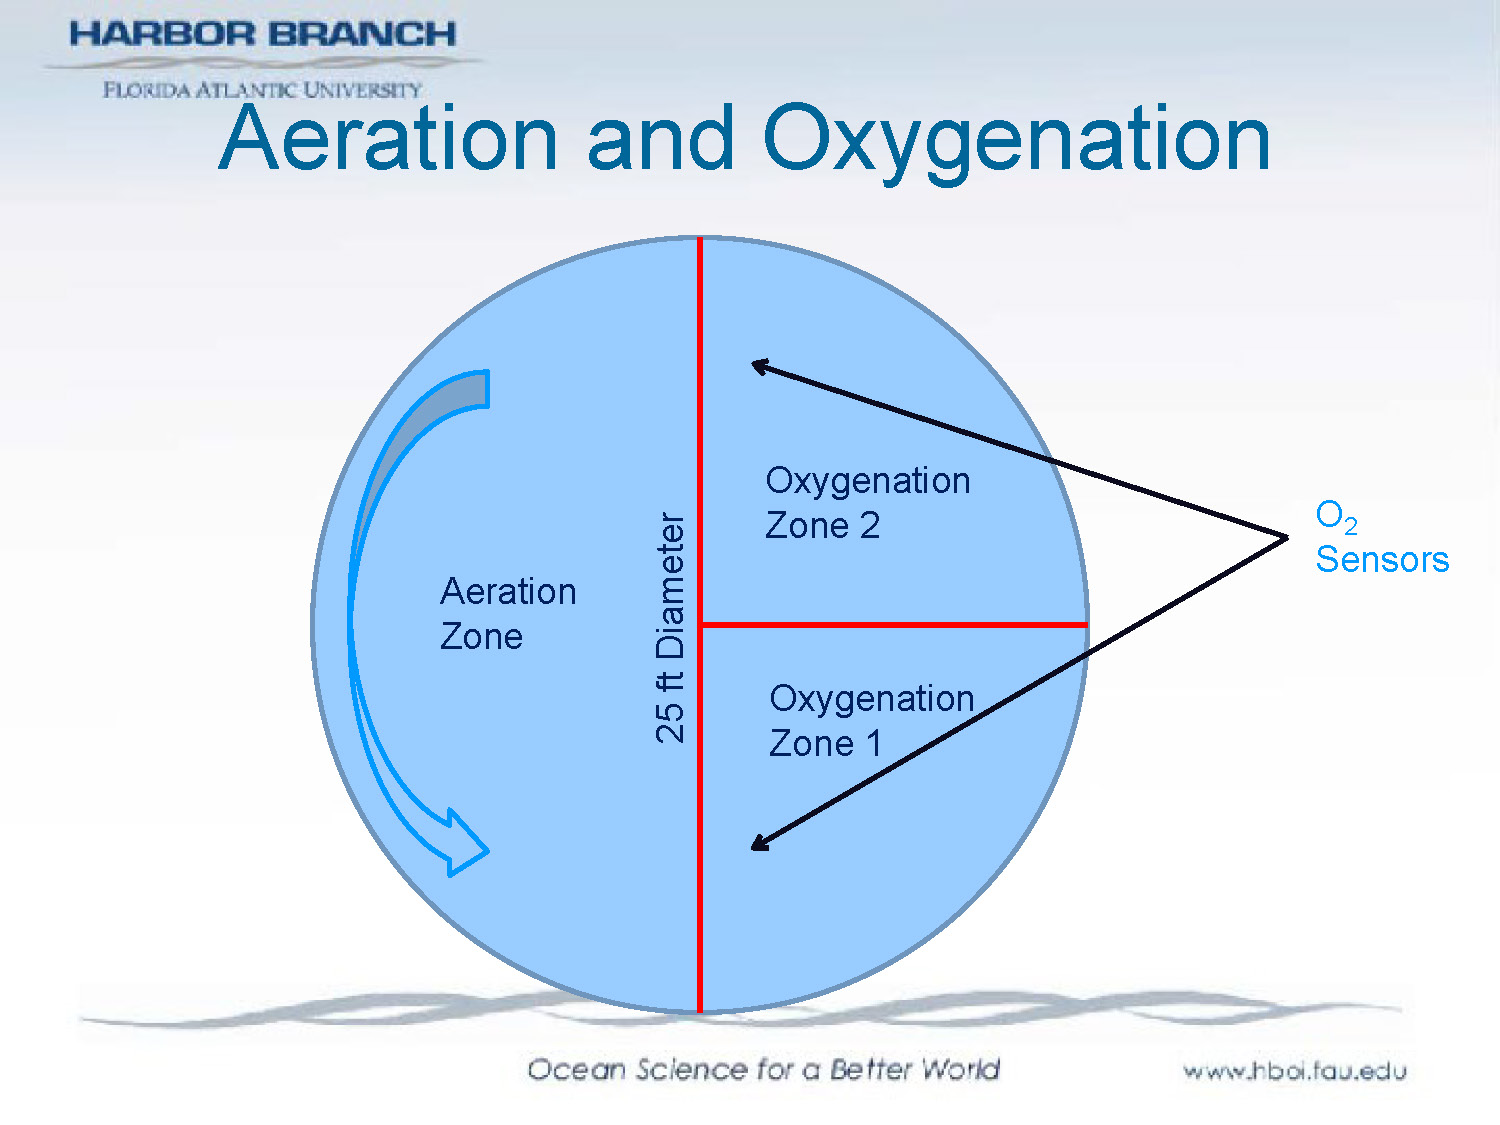
Aeration and Oxygenation
25 ft Diameter
The diagram illustrates a circular tank divided into three zones:
- Oxygenation Zone 1: Primary oxygen injection area
- Aeration Zone: Central area with air diffusion
- Oxygenation Zone 2: Secondary oxygen injection area
O2 Sensors are positioned to monitor dissolved oxygen levels throughout the tank. The layout ensures optimal oxygen distribution for fish health and growth.
Backup Systems
- Systems designed to combat "Murphys Law"
- "If anything can go wrong it will"
- Therefore managers must:
- Anticipate
- Plan
- Train
- Respond
- (an automatic system that "cries wolf" can derail this necessary task)
Backup Systems
- Generators
- Automatic oxygen system
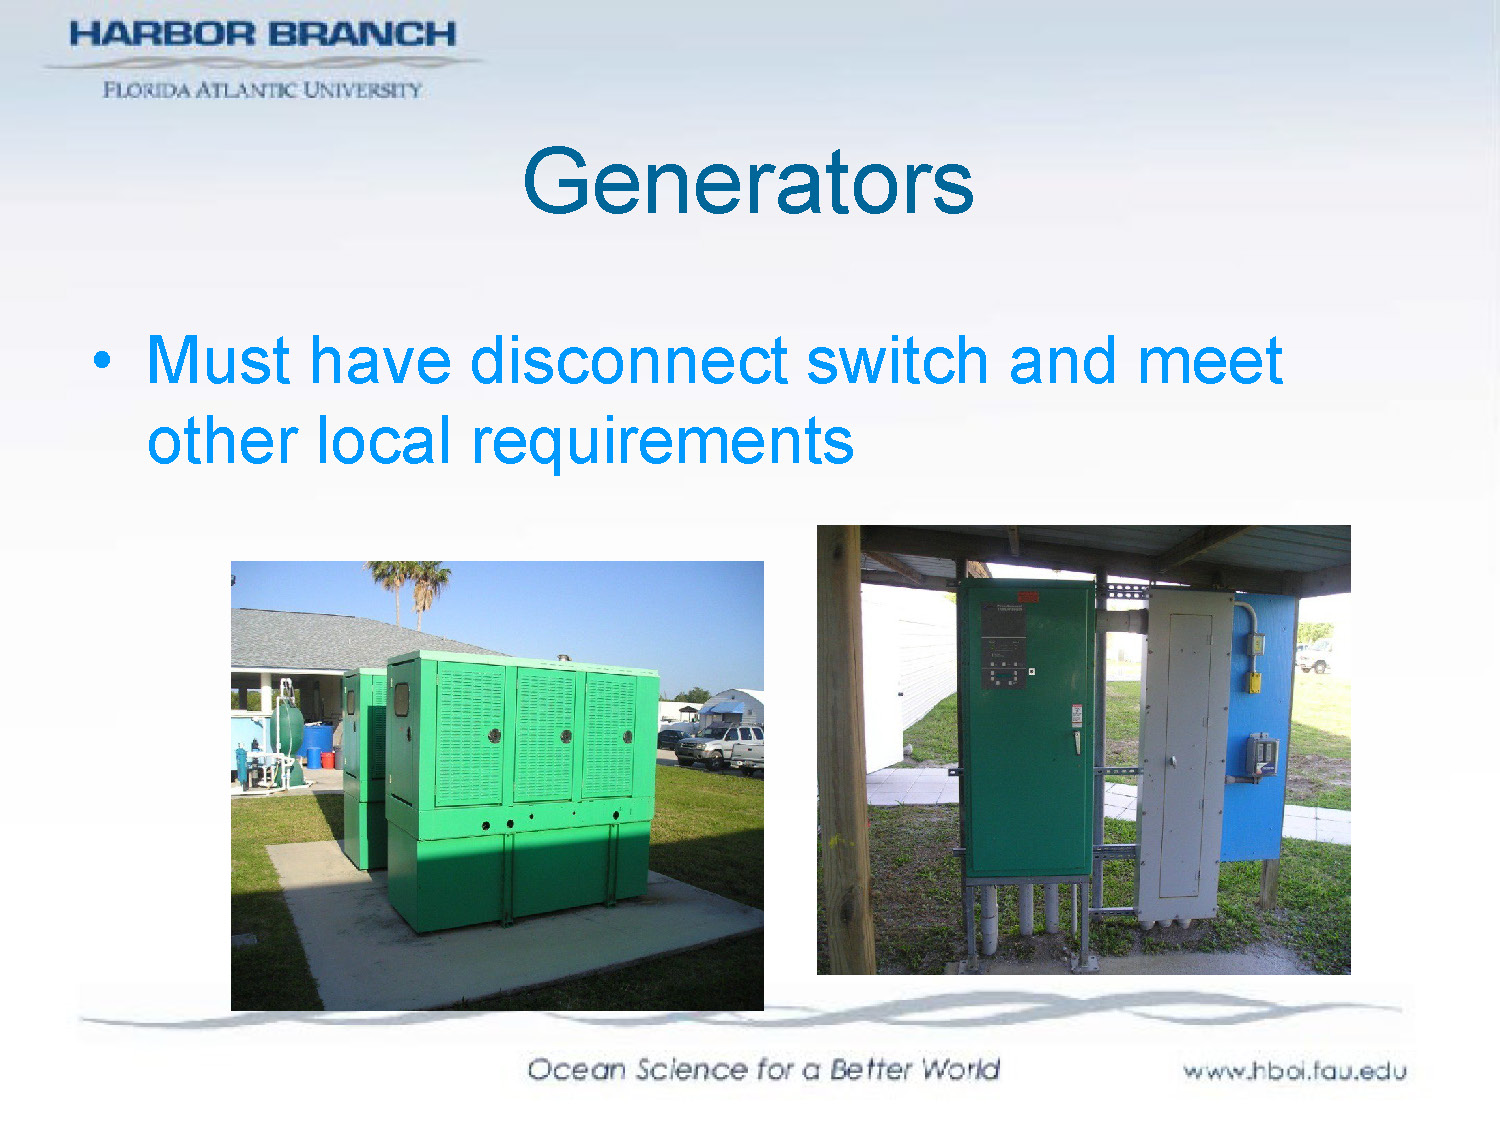
Generators
- Must have disconnect switch and meet other local requirements
The image shows an installed backup generator system for the facility.
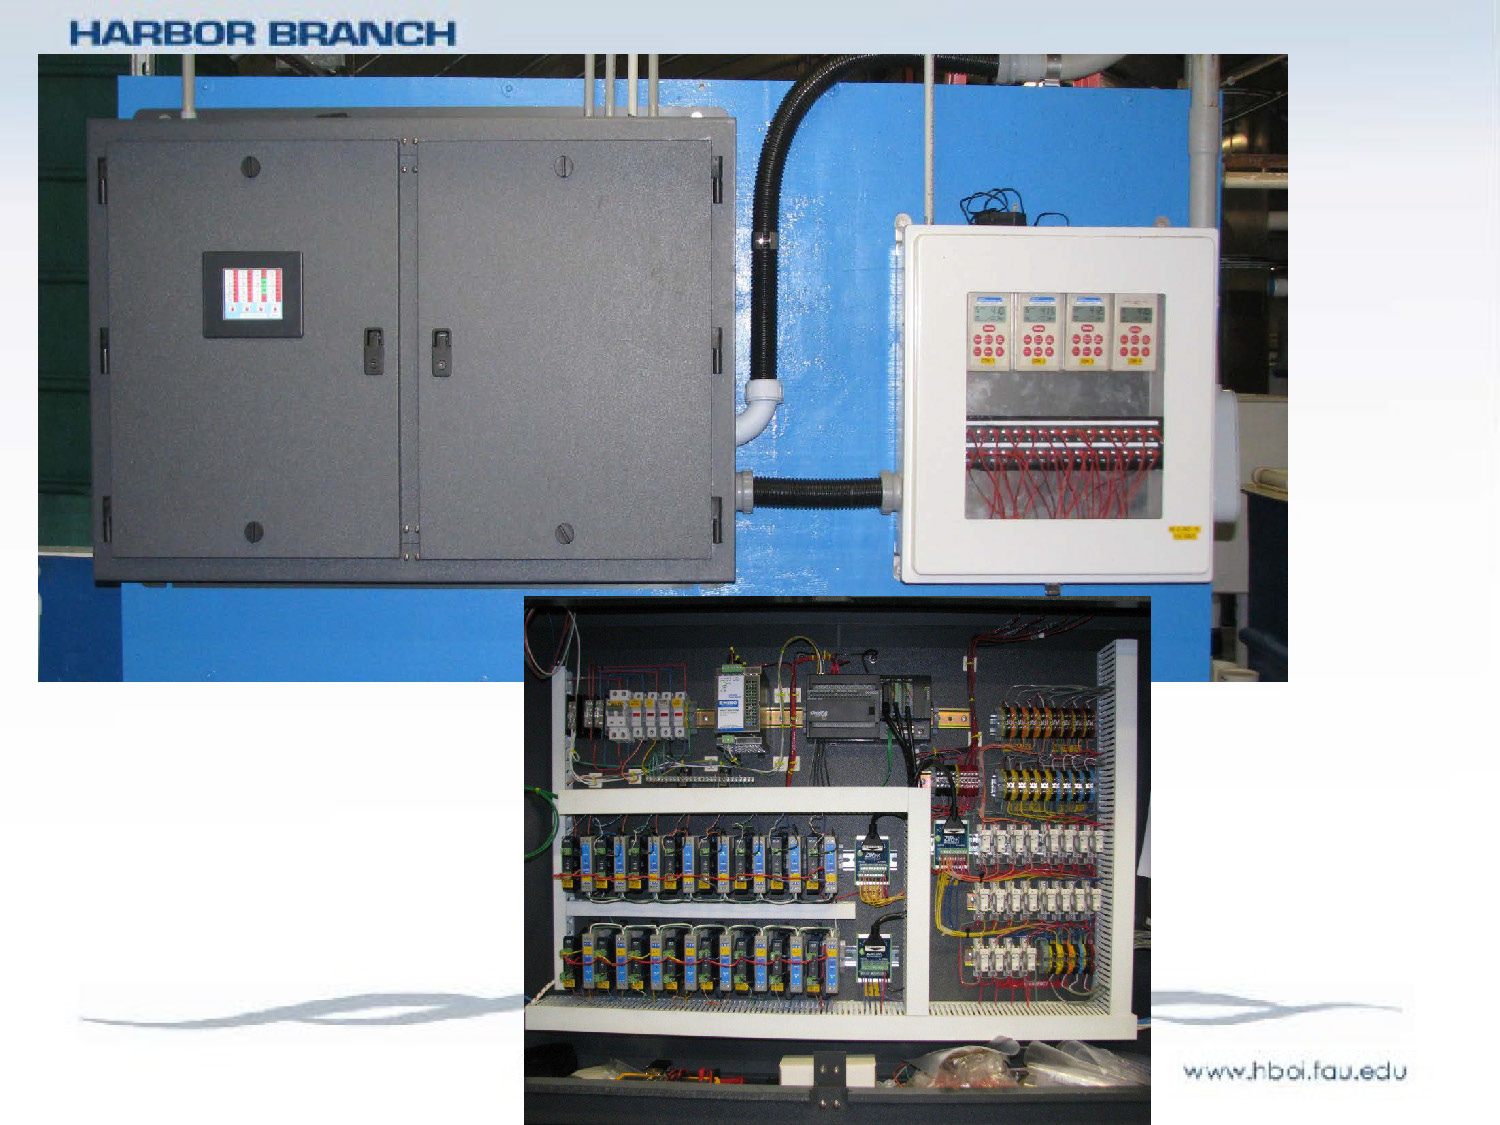
Two main control boxes are mounted on a blue wall. The left box is a large, dark gray double-door metal enclosure with a small digital status display. To the right is a smaller white box with a transparent window showing four digital controllers and organized red wiring. An inset photo shows the interior of a panel filled with complex electrical components, including rows of blue relays, circuit breakers, and a programmable logic controller (PLC).
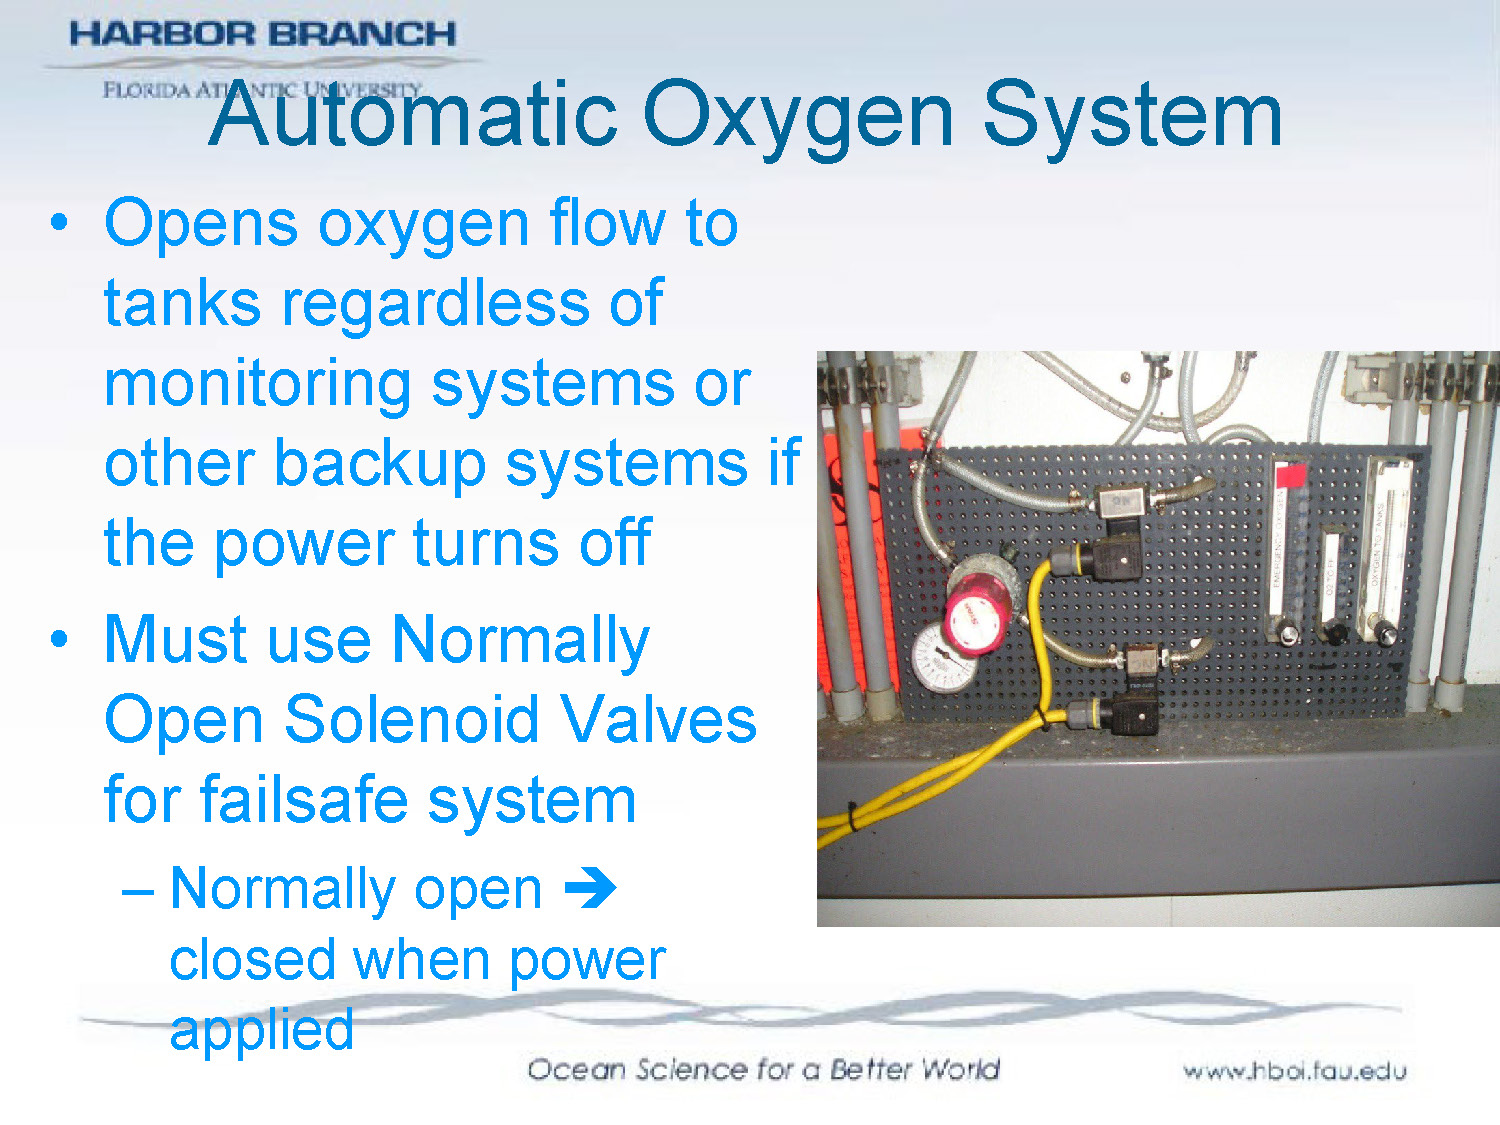
Automatic Oxygen System
- Opens oxygen flow to tanks regardless of monitoring systems or other backup systems if the power turns off
- Must use Normally Open Solenoid Valves for failsafe system
- Normally open closed when power applied
The slide includes a diagram showing the oxygen system configuration with normally open solenoid valves that ensure oxygen continues to flow to tanks during power failures.
Broodstock Conditioning and Spawning System
USDA-ARS/HBOI-FAU Design
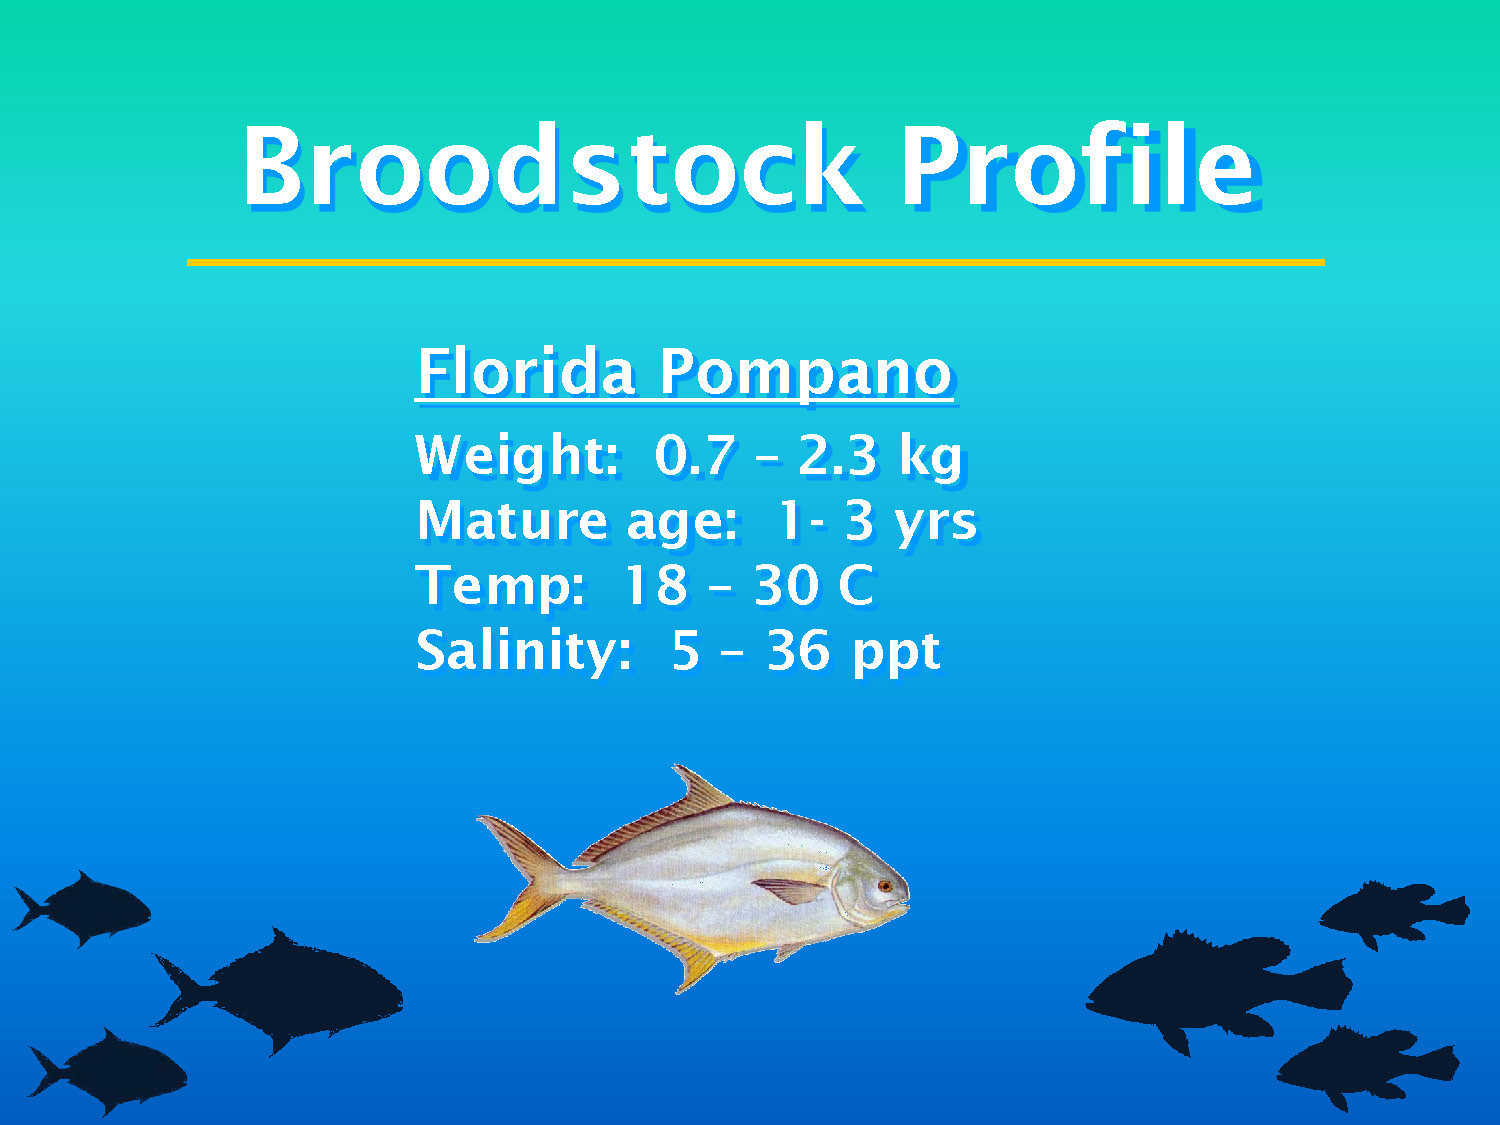
Broodstock Profile
Florida Pompano
| Weight: | 0.7 – 2.3 kg |
| Mature age: | 1- 3 yrs |
| Temp: | 18 – 30 C |
| Salinity: | 5 – 36 ppt |
The slide includes a photograph of Florida Pompano fish.
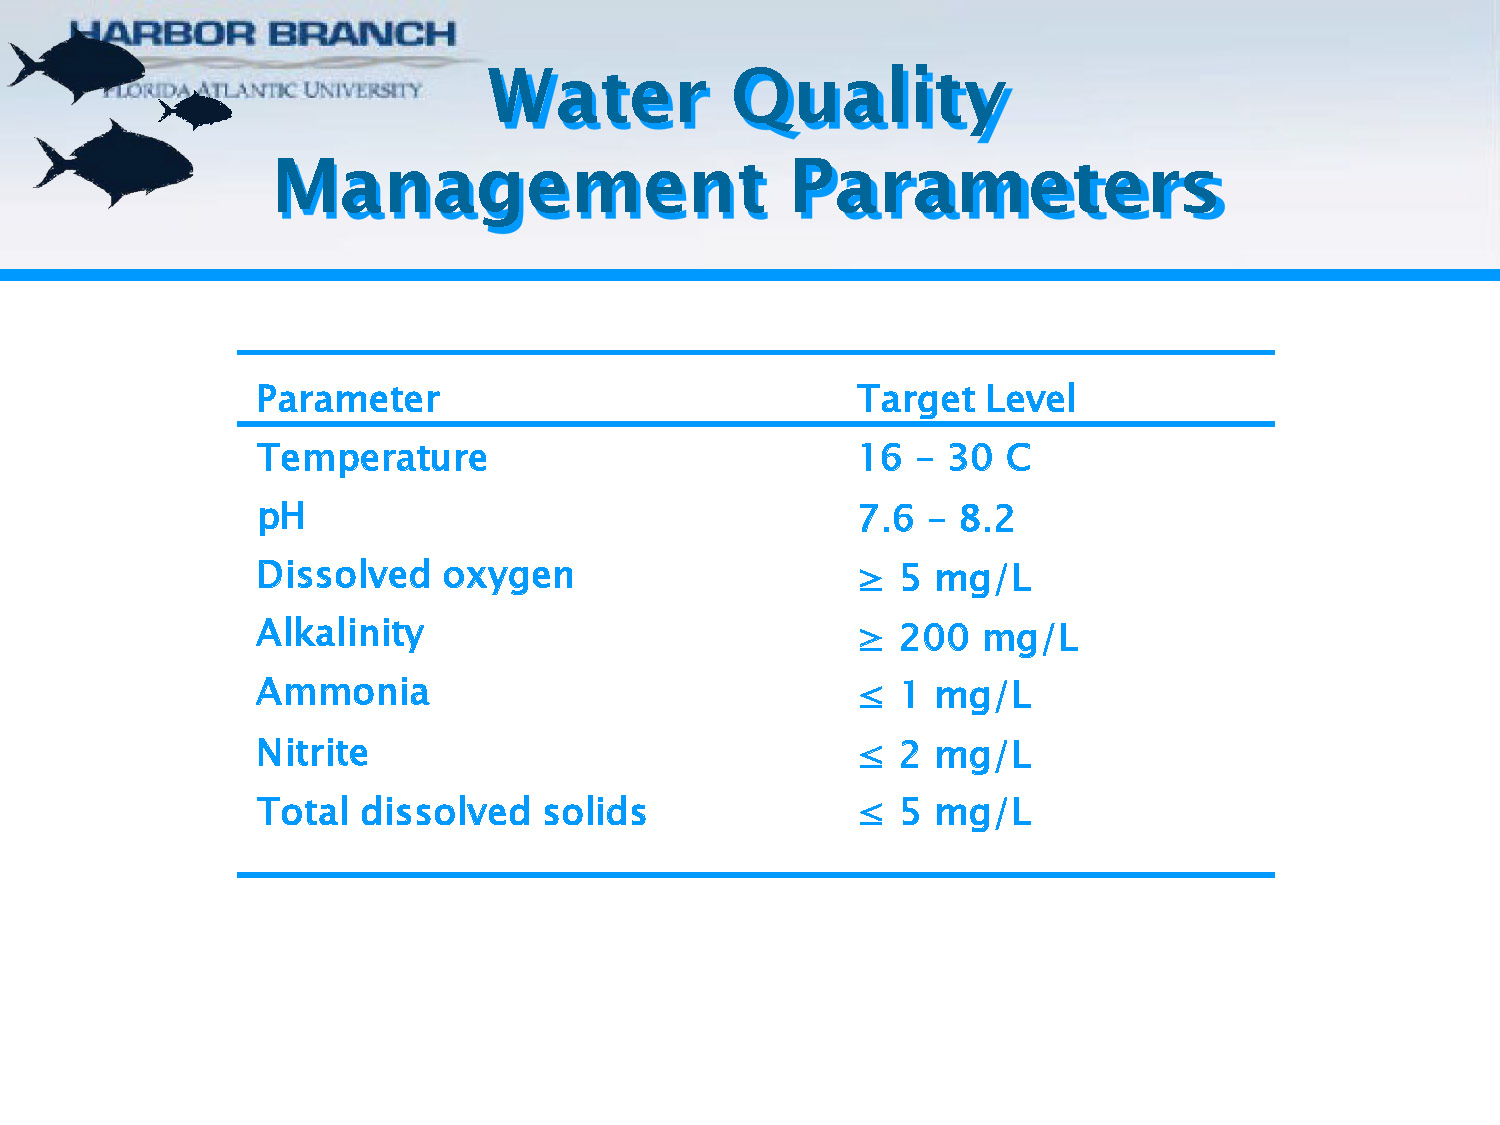
Water Quality Management Parameters
| Parameter | Target Level |
|---|---|
| Temperature | 16 – 30 C |
| pH | 7.6 – 8.2 |
| Dissolved oxygen | ≥ 5 mg/L |
| Alkalinity | ≥ 200 mg/L |
| Ammonia | ≤ 1 mg/L |
| Nitrite | ≤ 2 mg/L |
| Total dissolved solids | ≤ 5 mg/L |
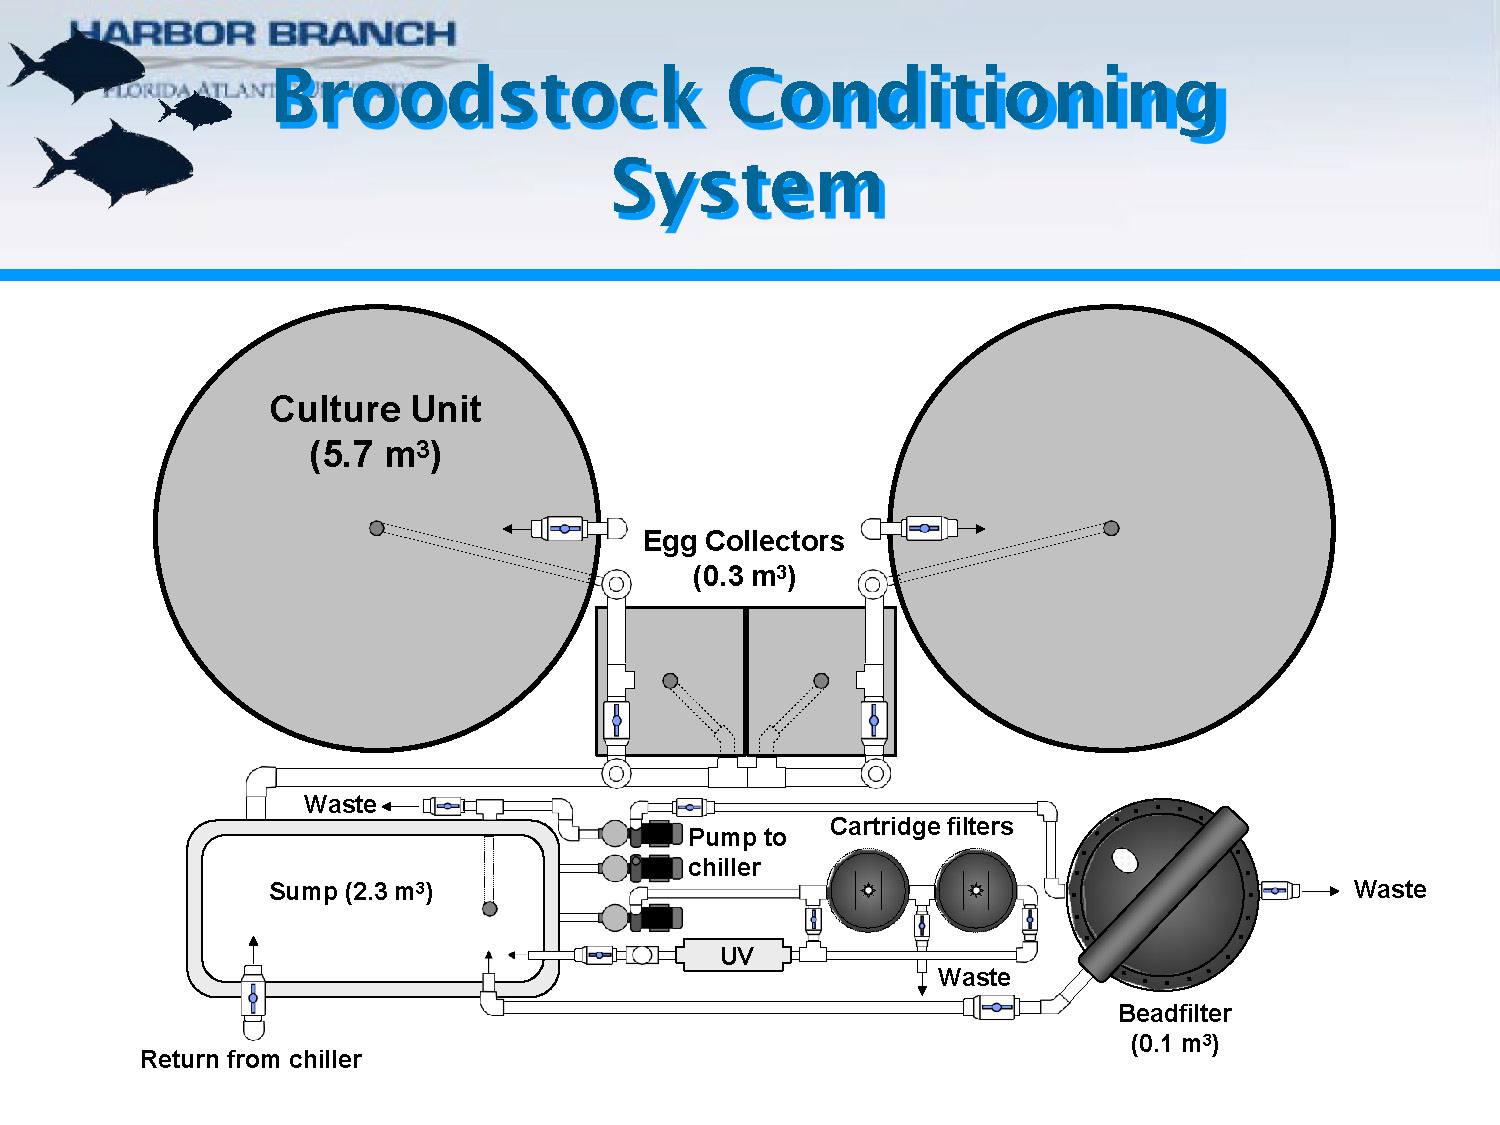
Broodstock Conditioning System
The slide shows a flow diagram of the broodstock conditioning system with the following components and volumes:
- Sump (2.3 m3)
- Culture Unit (5.7 m3)
- Egg Collectors (0.3 m3)
- Beadfilter (0.1 m3)
- Pump to chiller
- Cartridge filters
- Return from chiller
- UV sterilization
- Waste outlets at multiple points
The diagram illustrates the complete recirculation pathway for maintaining optimal conditions for broodstock spawning. The slide also includes photographs of the actual system components.
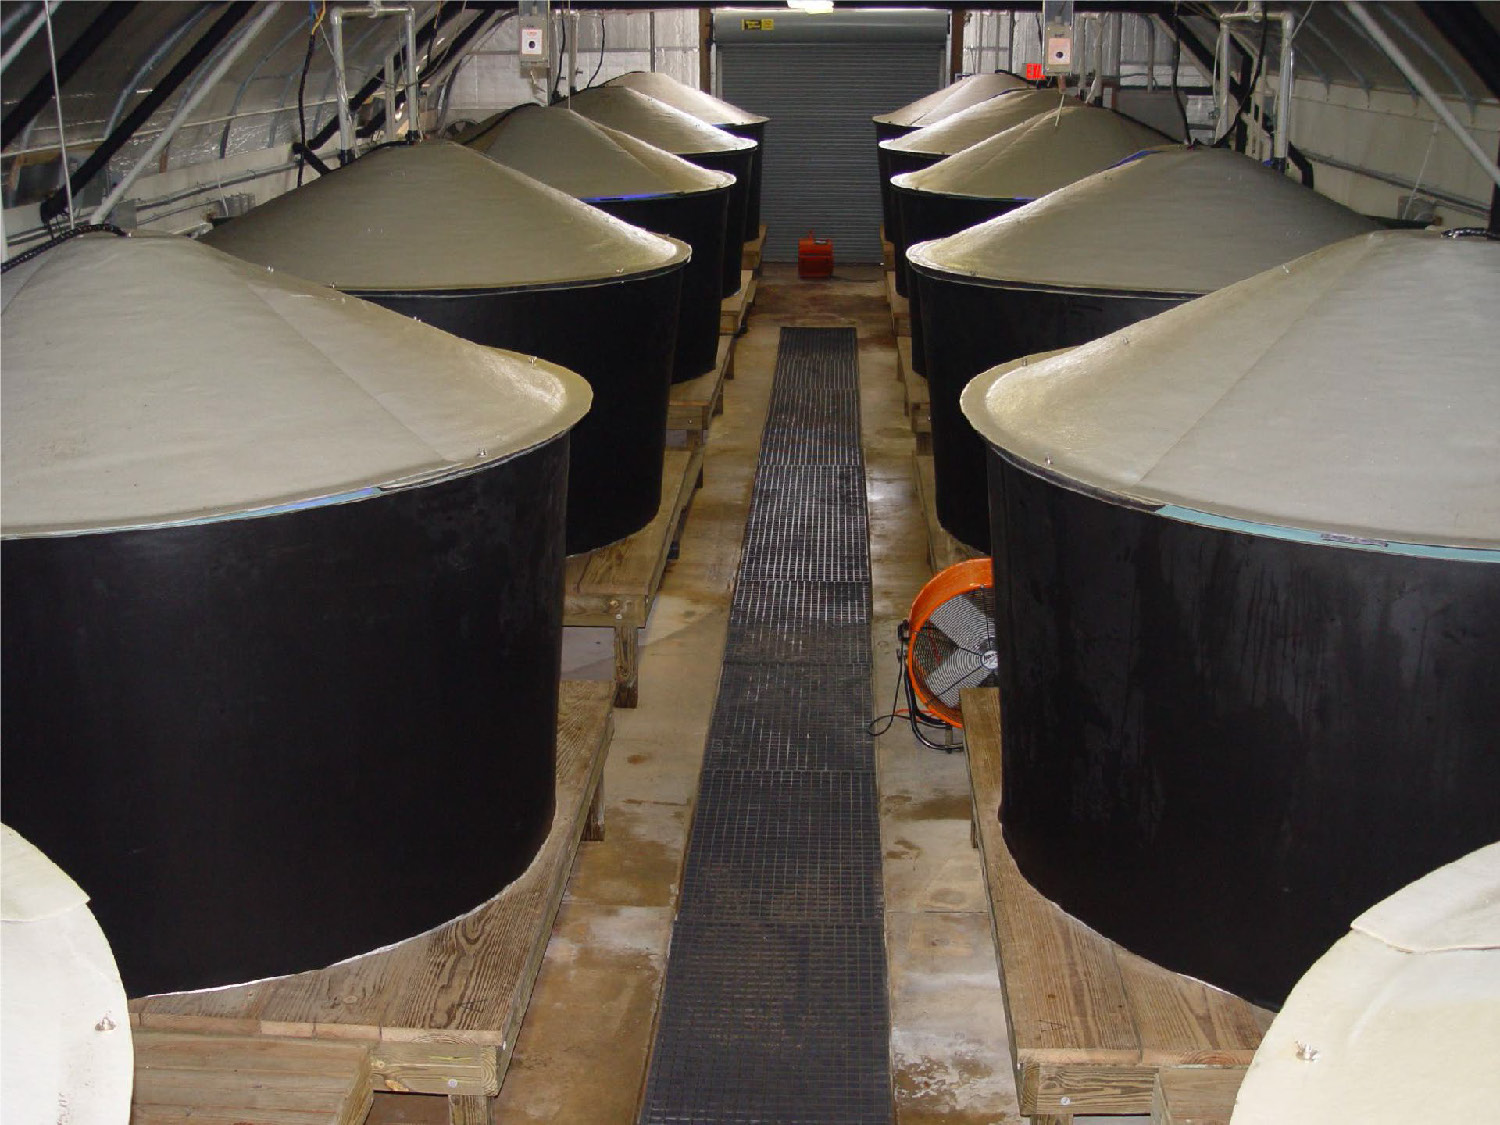
A central metal grate walkway runs between two rows of large, black cylindrical aquaculture tanks. Each tank is topped with a white, slightly domed cover. An orange industrial floor fan sits in the aisle. The room has arched, insulated ceilings and a silver metal roll-up door at the far end of the hallway.
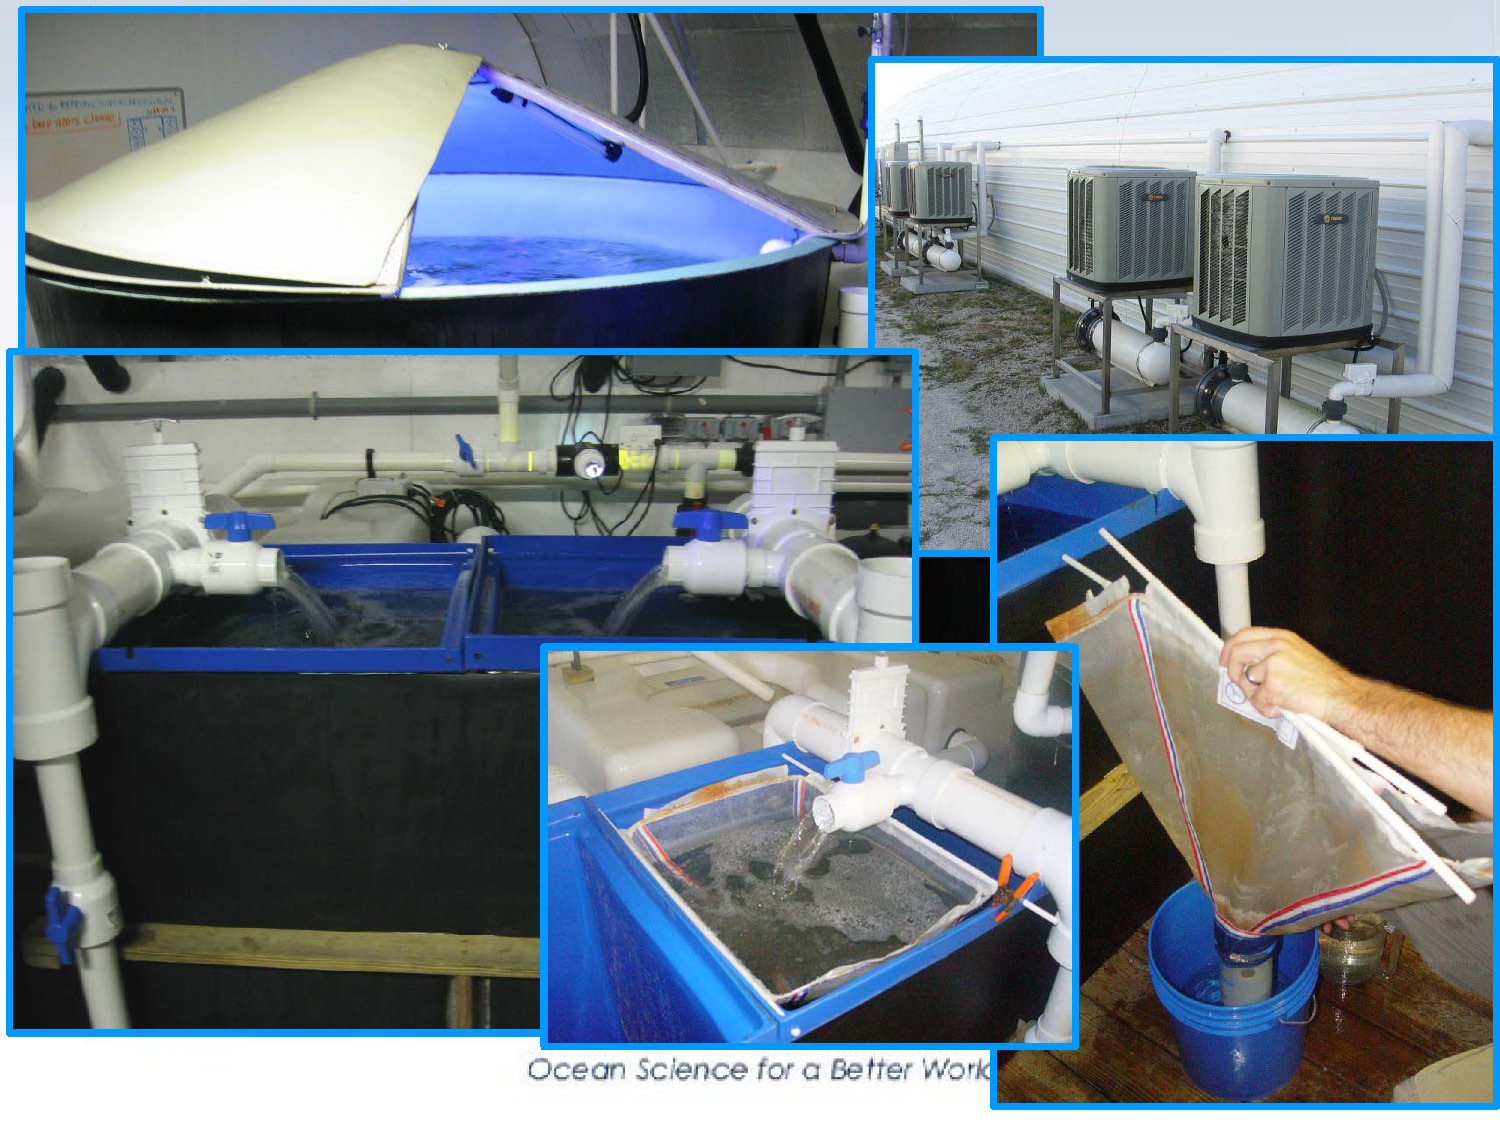
A collage of five images showing system maintenance: 1) A circular tank with a blue light glowing from under a partially lifted lid. 2) Three Trane HVAC condenser units installed outside the white building. 3) Water flowing from white PVC pipes into blue rectangular filter basins. 4) A close-up of a worker holding a mesh filter bag used to capture waste or larvae from a water outlet. 5) Water rushing into a smaller filter box with a mesh screen.
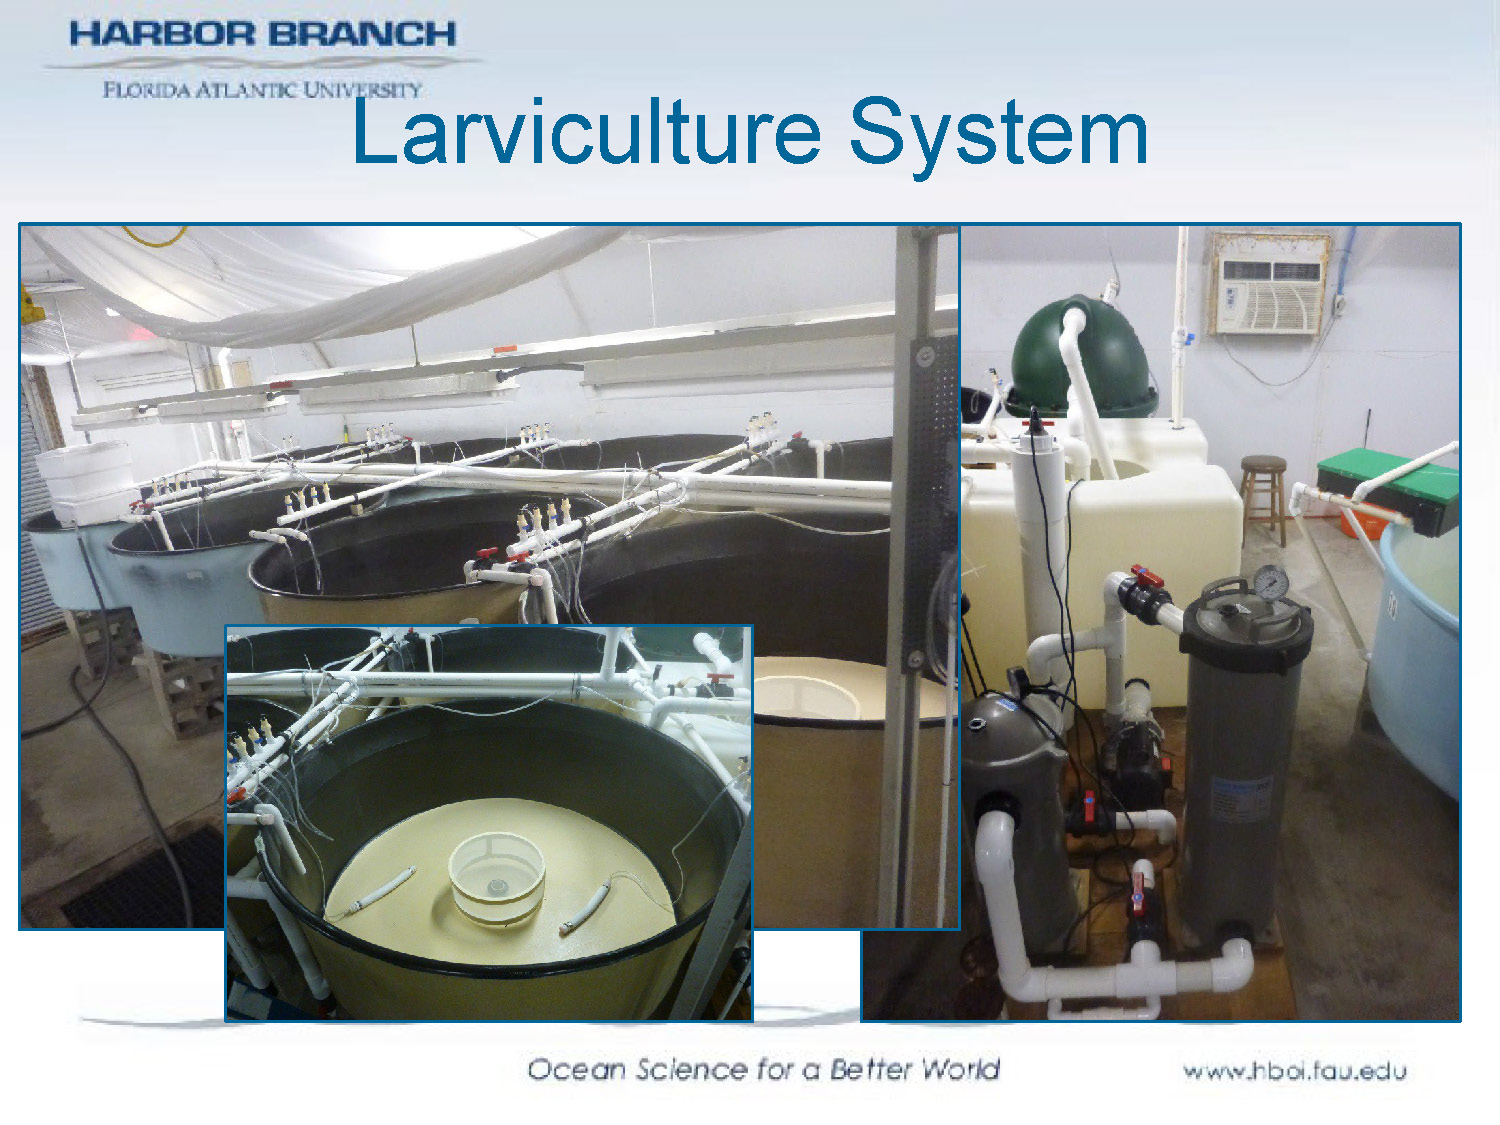
The photograph displays the Larviculture system equipment with inset closeup of top of a large tank
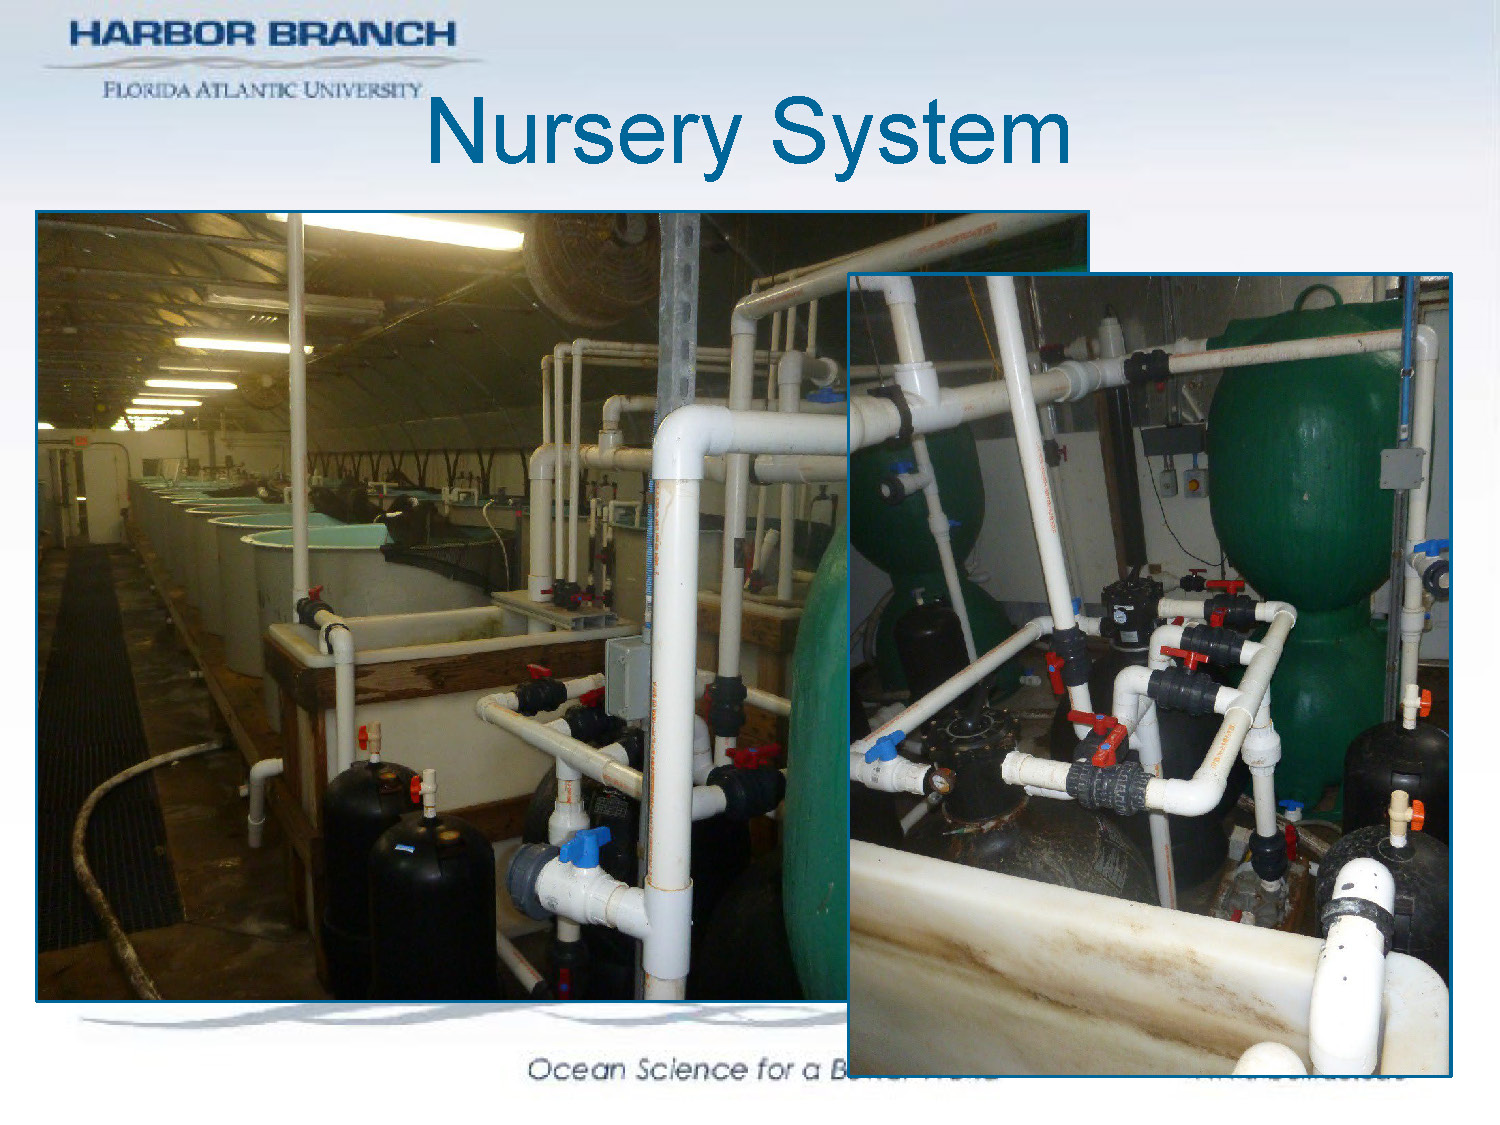
Nursery System
The photograph displays the nursery system tanks where juvenile pompano are grown before transfer to the main growout system.
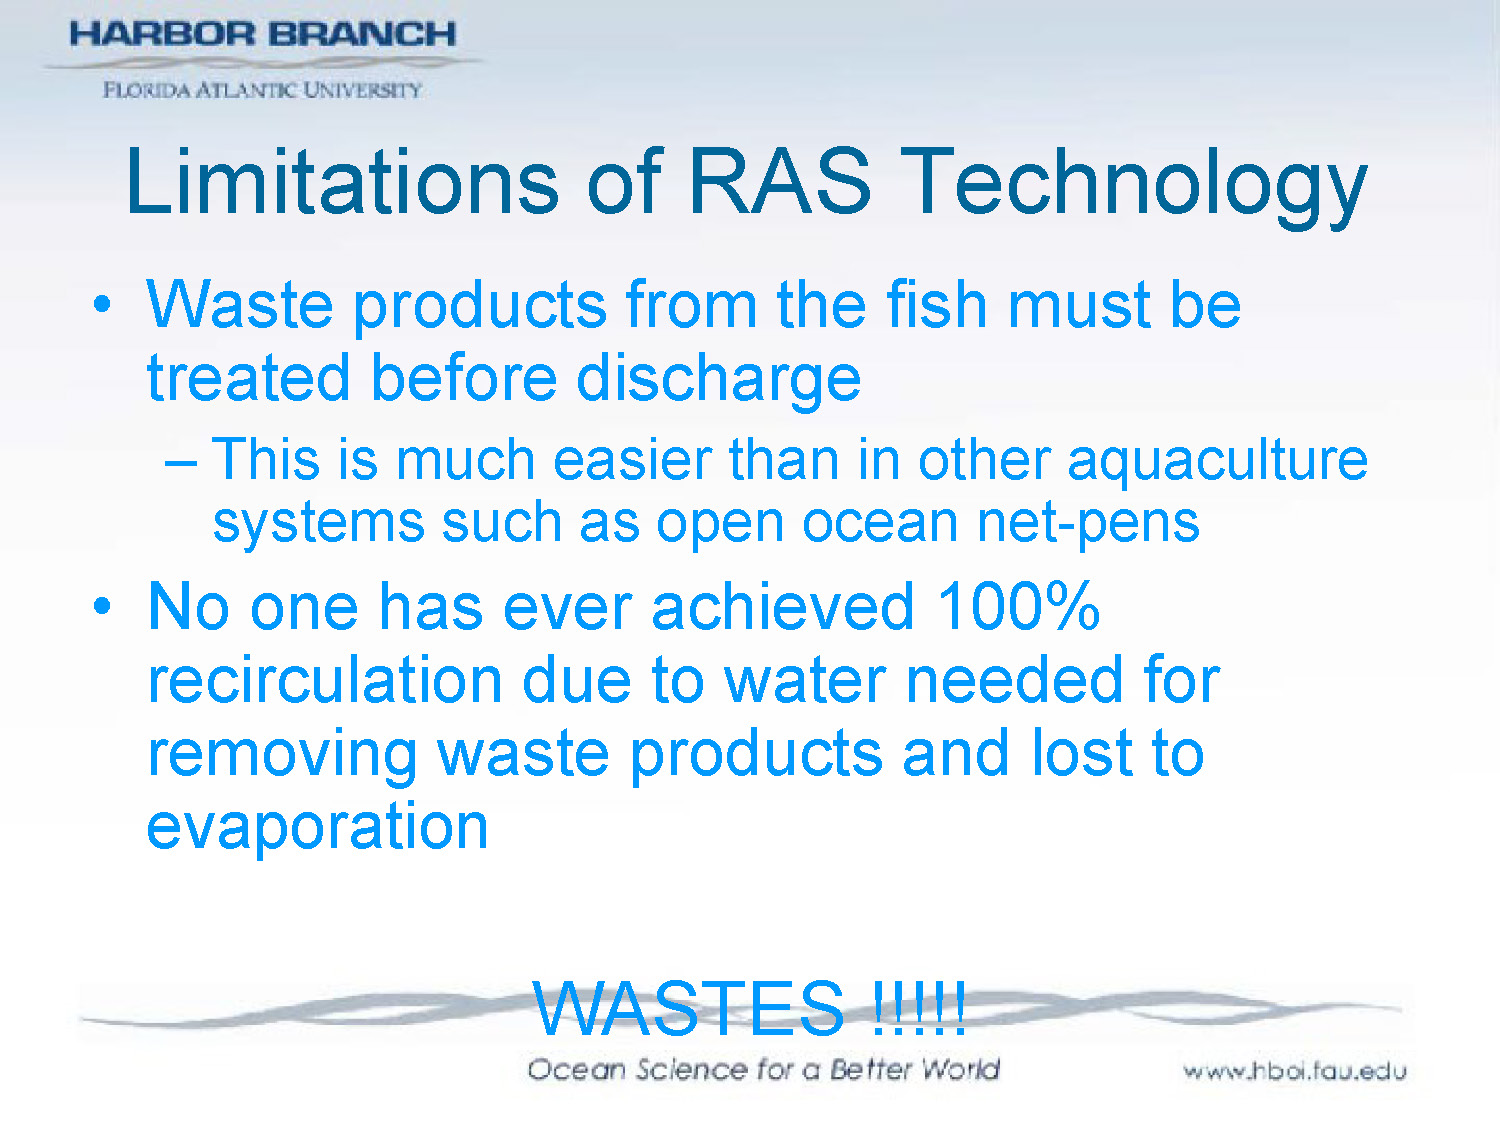
Limitations of RAS Technology
- Waste products from the fish must be treated before discharge
- This is much easier than in other aquaculture systems such as open ocean net-pens
- No one has ever achieved 100% recirculation due to water needed for removing waste products and lost to evaporation
WASTES !!!!!
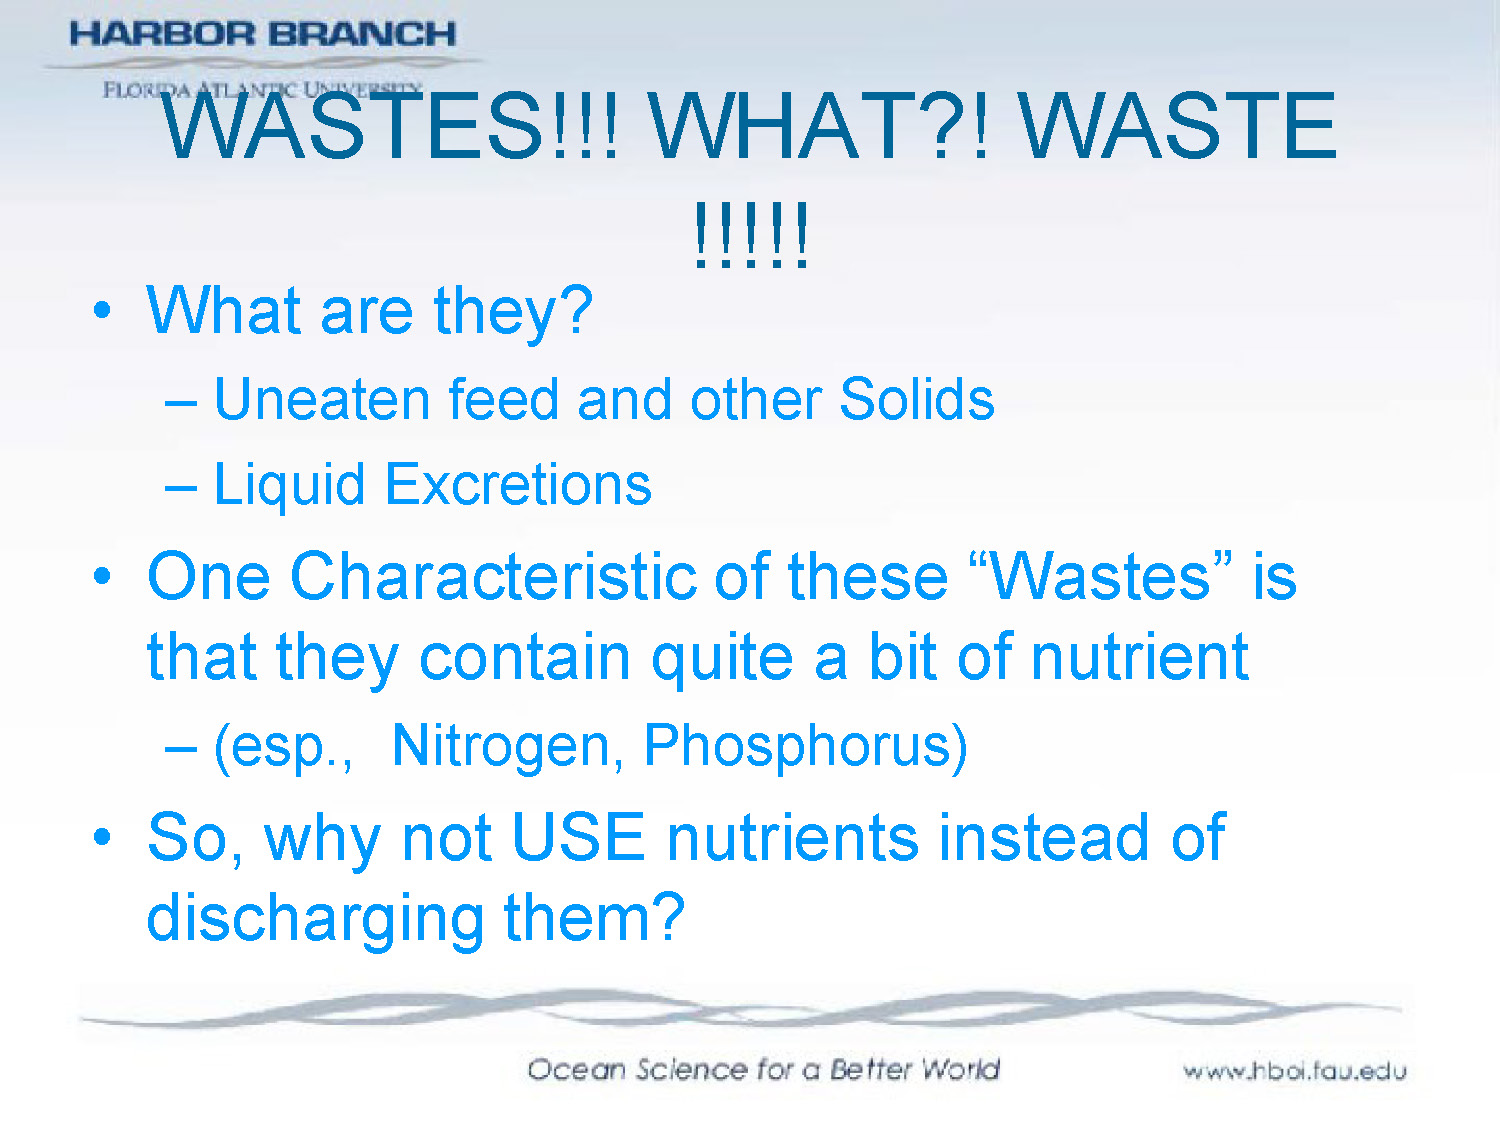
WASTES!!! WHAT?! WASTE !!!!!
- What are they?
- Uneaten feed and other Solids
- Liquid Excretions
- One Characteristic of these "Wastes" is that they contain quite a bit of nutrient
- (esp., Nitrogen, Phosphorus)
- So, why not USE nutrients instead of discharging them?
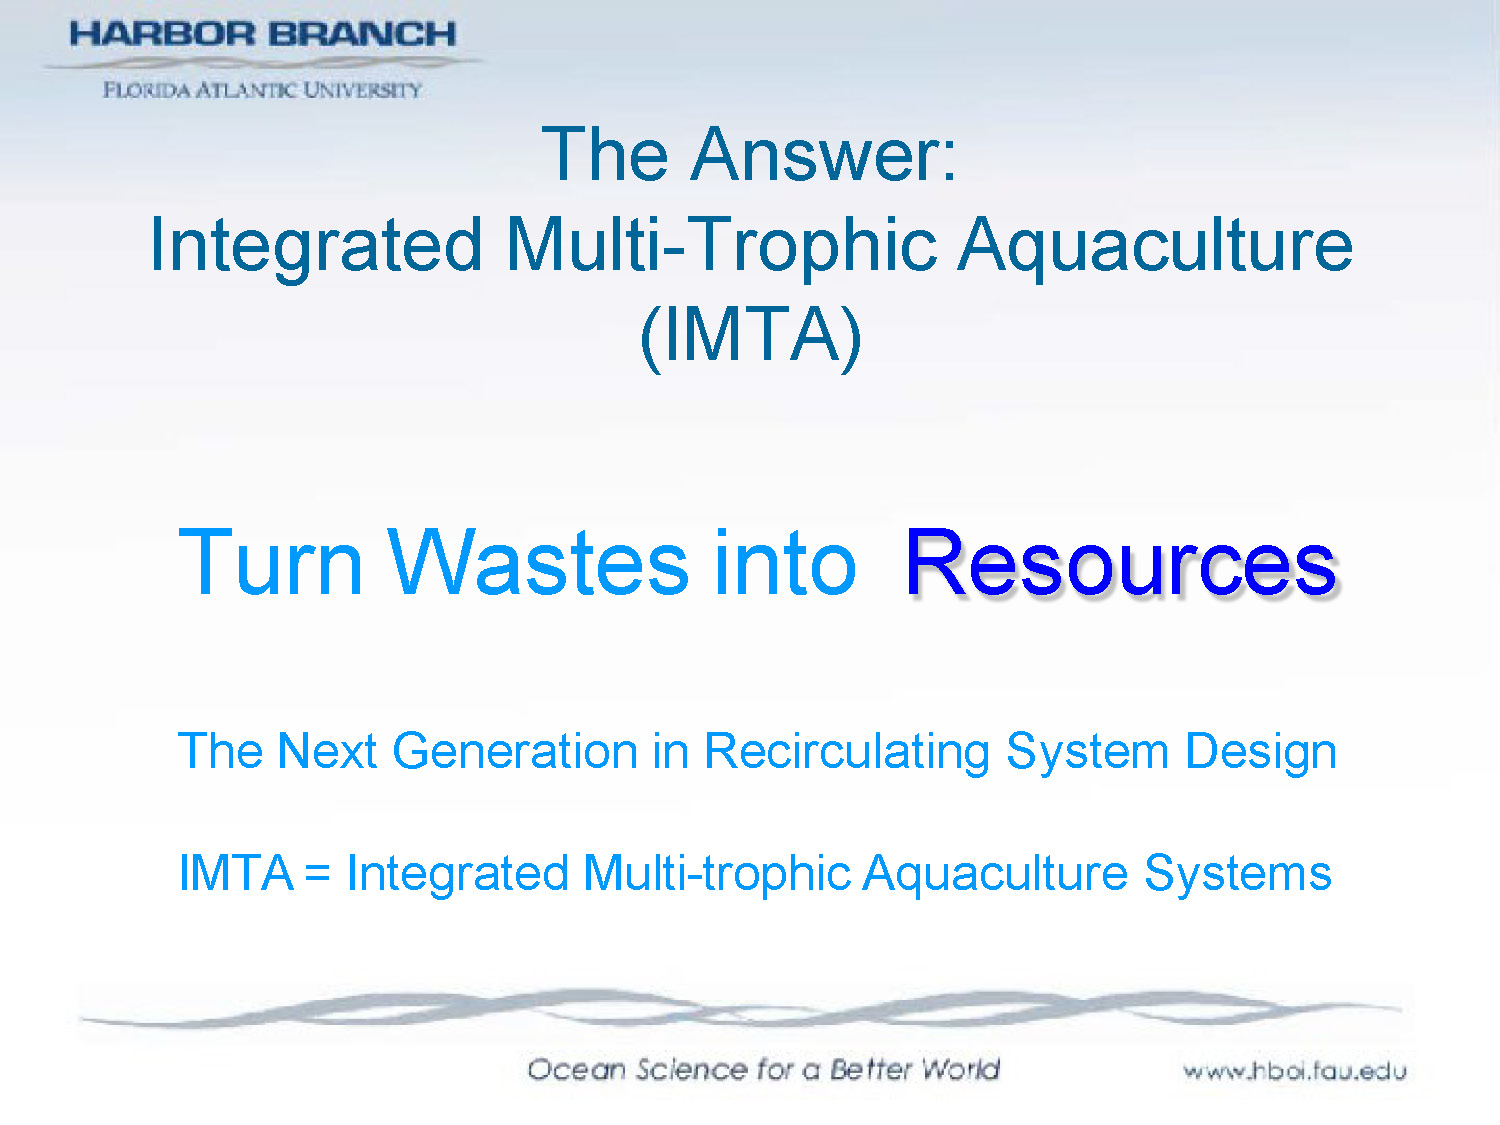
The Answer:
Integrated Multi-Trophic Aquaculture (IMTA)
Turn Wastes into Resources
The Next Generation in Recirculating System Design
IMTA = Integrated Multi-trophic Aquaculture Systems
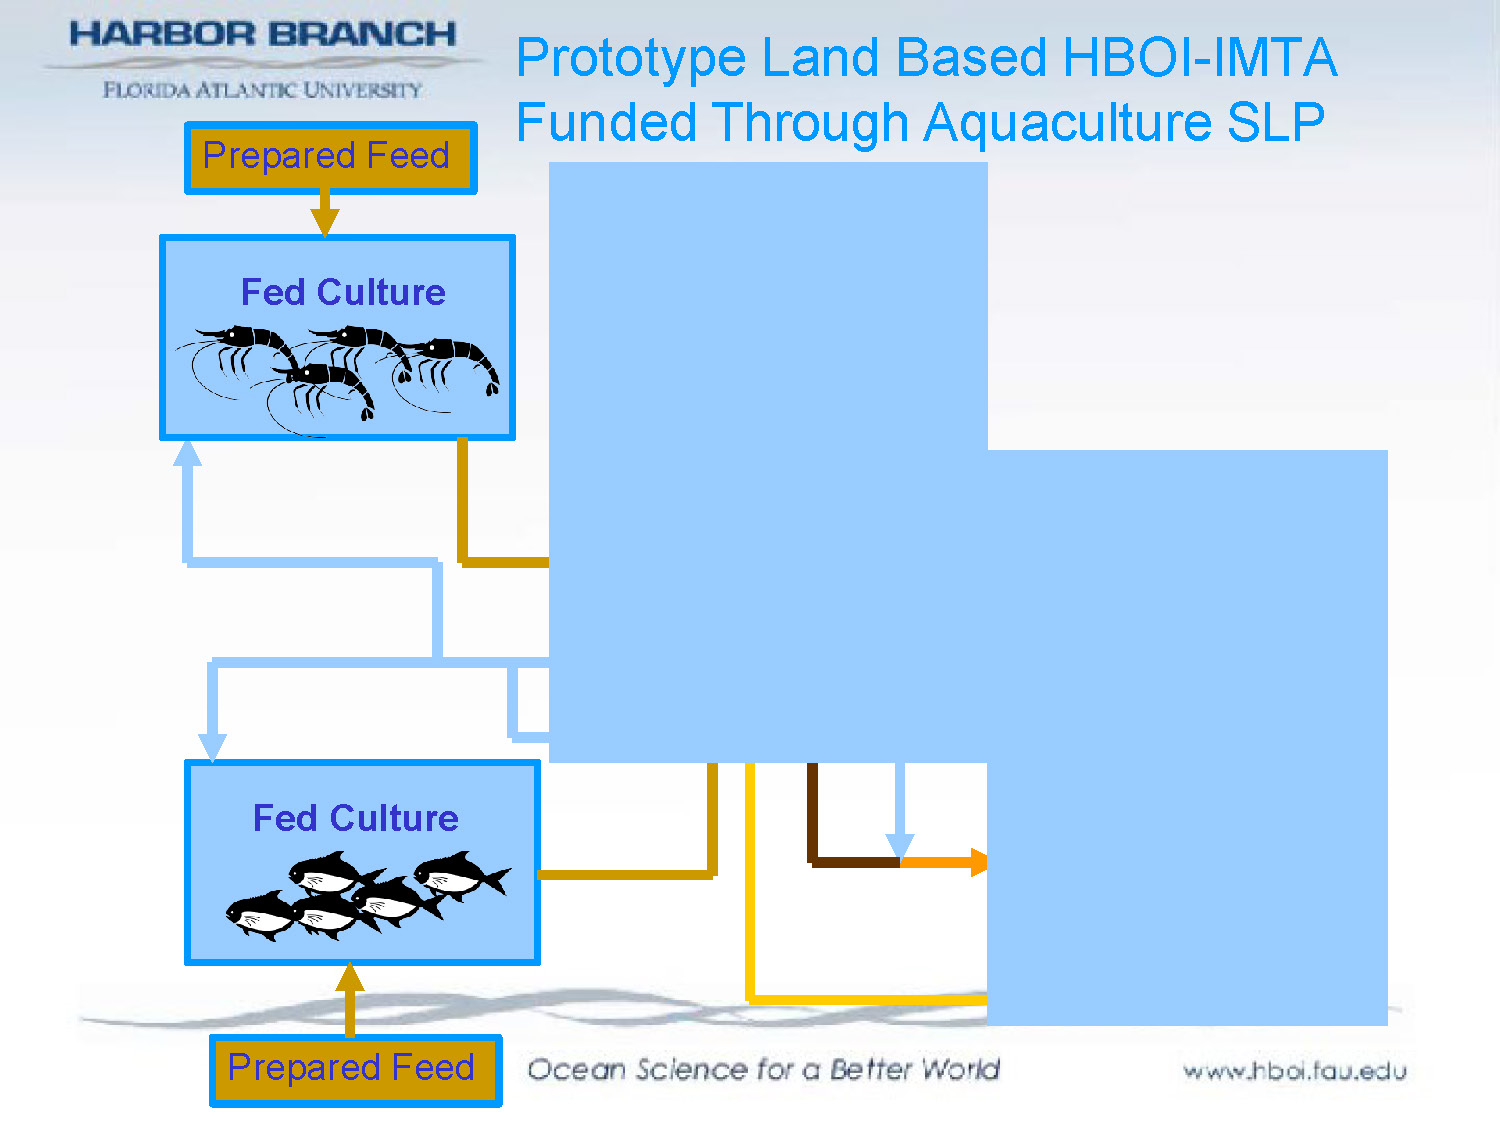
Prototype Land Based HBOI-IMTA
Funded Through Aquaculture SLP
The diagram illustrates an integrated multi-trophic aquaculture system with the following components:
- Primary fish culture receiving prepared feed
- Processing solids from the fed culture
- Organisms that consume and utilize settleable solid wastes
- Organisms that filter and utilize suspended particles
- Organisms that absorb dissolved nutrients from the water
End of presentation.
Go to top of page.