Economics of Pompano Production in RAS
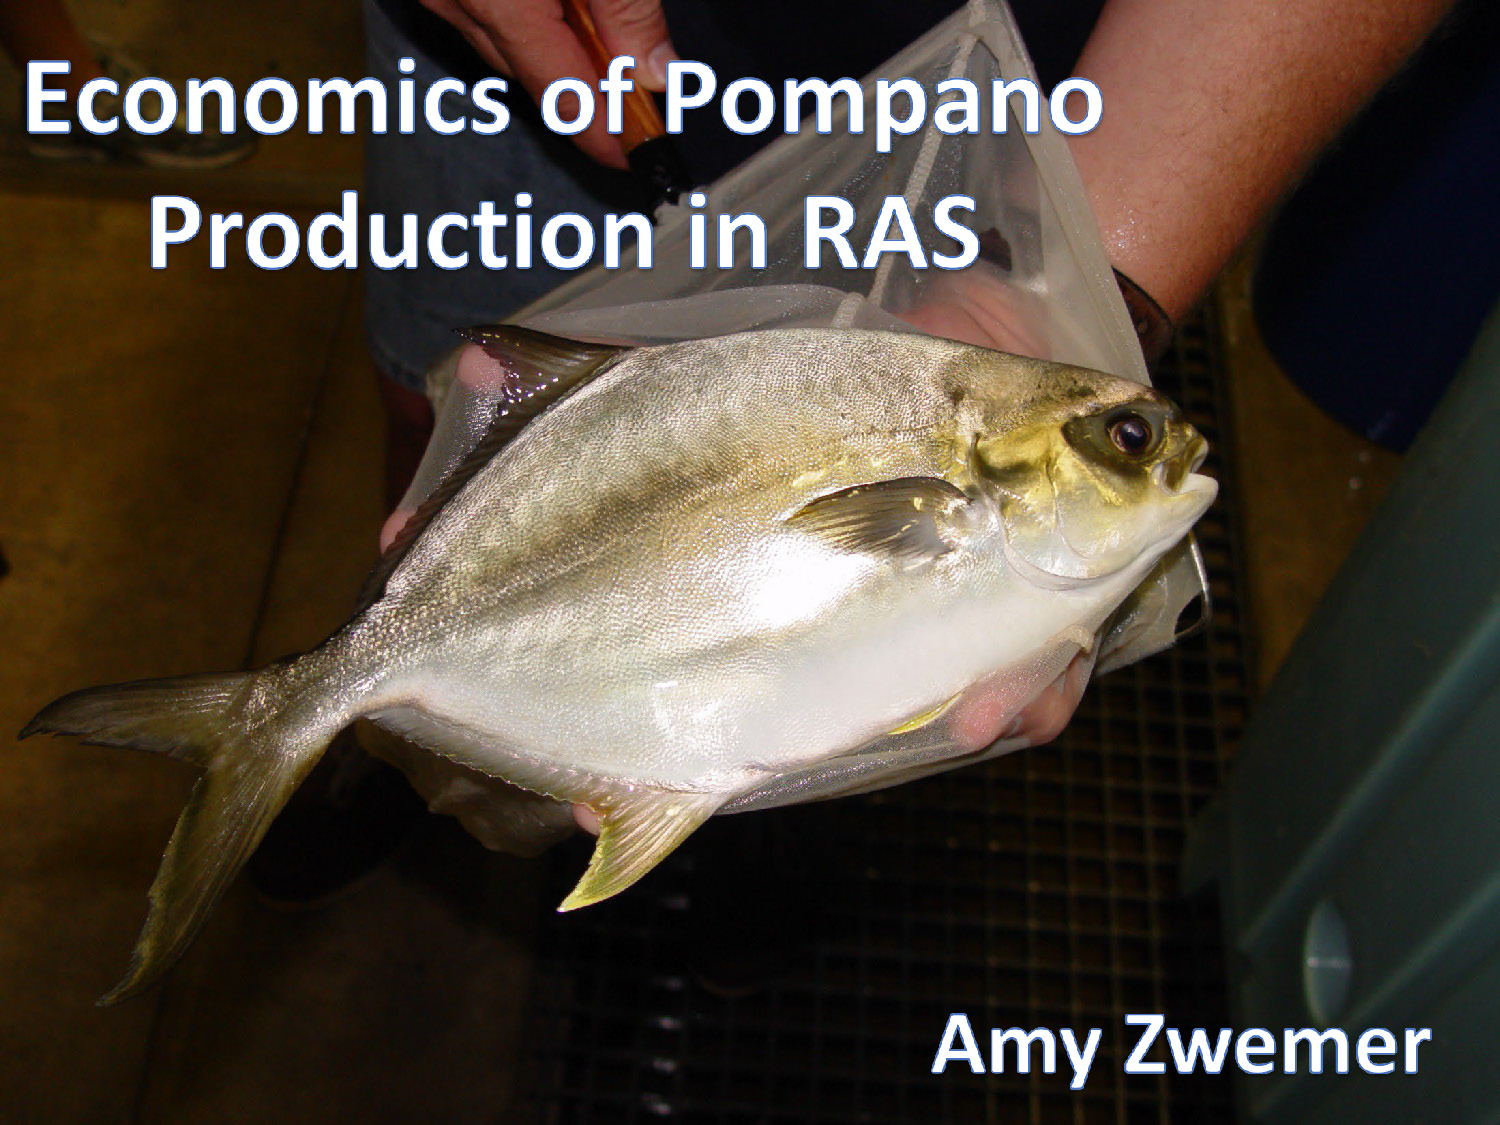
Economics of Pompano Production in RAS
Presentation by Amy Zwemer
Pompano RAS = Profits?
Every situation is different…
Today's Example:
Boutique sized farm (small – niche market)
Market – Direct to Restaurants and Consumers
Parameters – HB Commercial RAS Demonstration results
Reminder:
We are providing the results of studies conducted at Harbor Branch.
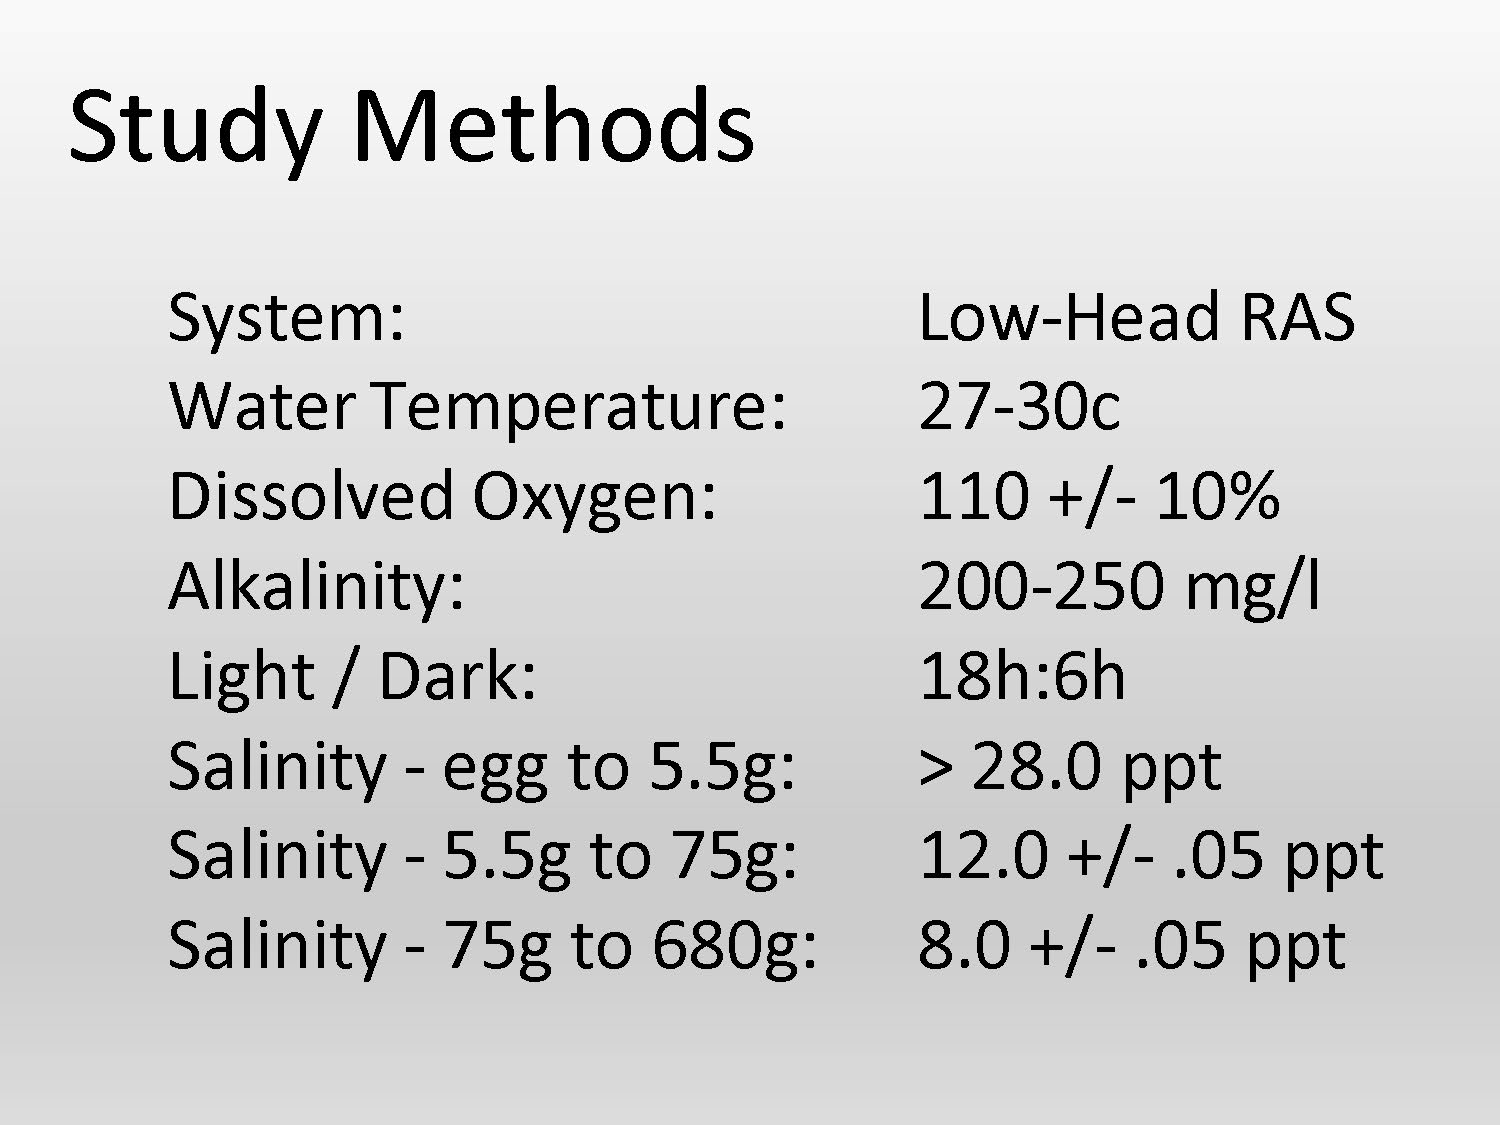
Study Methods
| System: | Low-Head RAS |
| Water Temperature: | 27-30c |
| Dissolved Oxygen: | 110 +/- 10% |
| Alkalinity: | 200-250 mg/l |
| Light / Dark: | 18h:6h |
| Salinity - egg to 5.5g: | > 28.0 ppt |
| Salinity - 5.5g to 75g: | 12.0 +/- .05 ppt |
| Salinity - 75g to 680g: | 8.0 +/- .05 ppt |
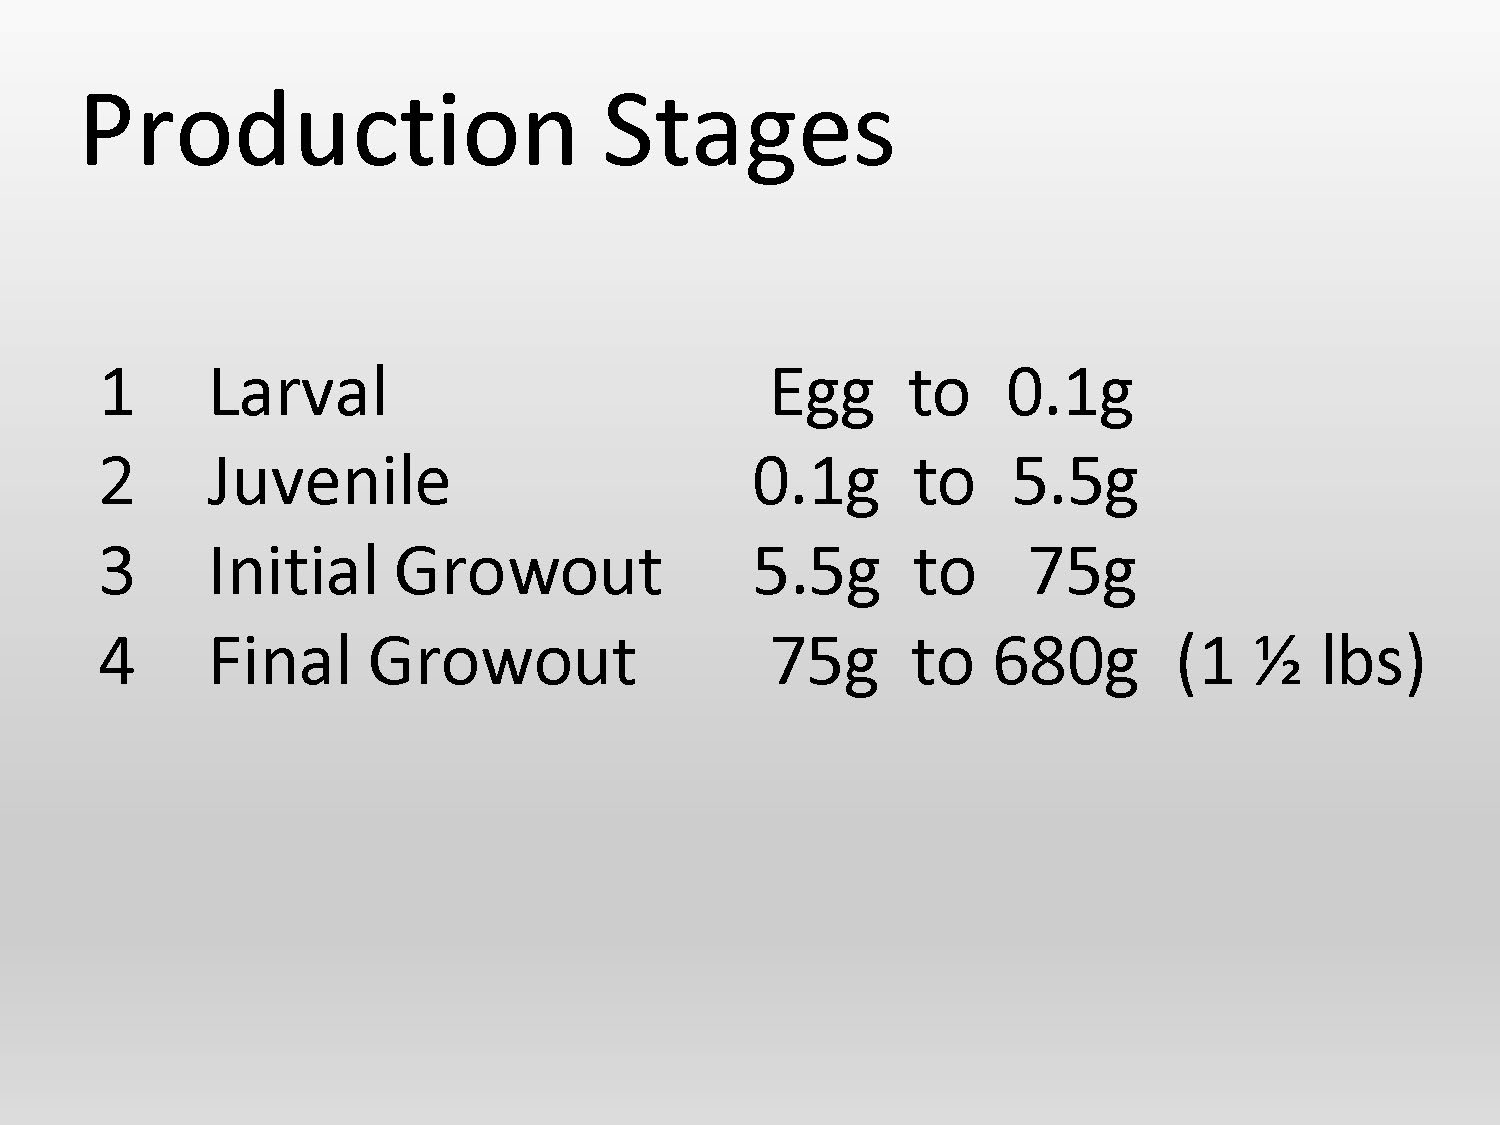
Production Stages
| 1 | Larval | Egg | to | 0.1g |
| 2 | Juvenile | 0.1g | to | 5.5g |
| 3 | Initial Growout | 5.5g | to | 75g |
| 4 | Final Growout | 75g | to | 680g (1 ½ lbs) |

Lets do the numbers…
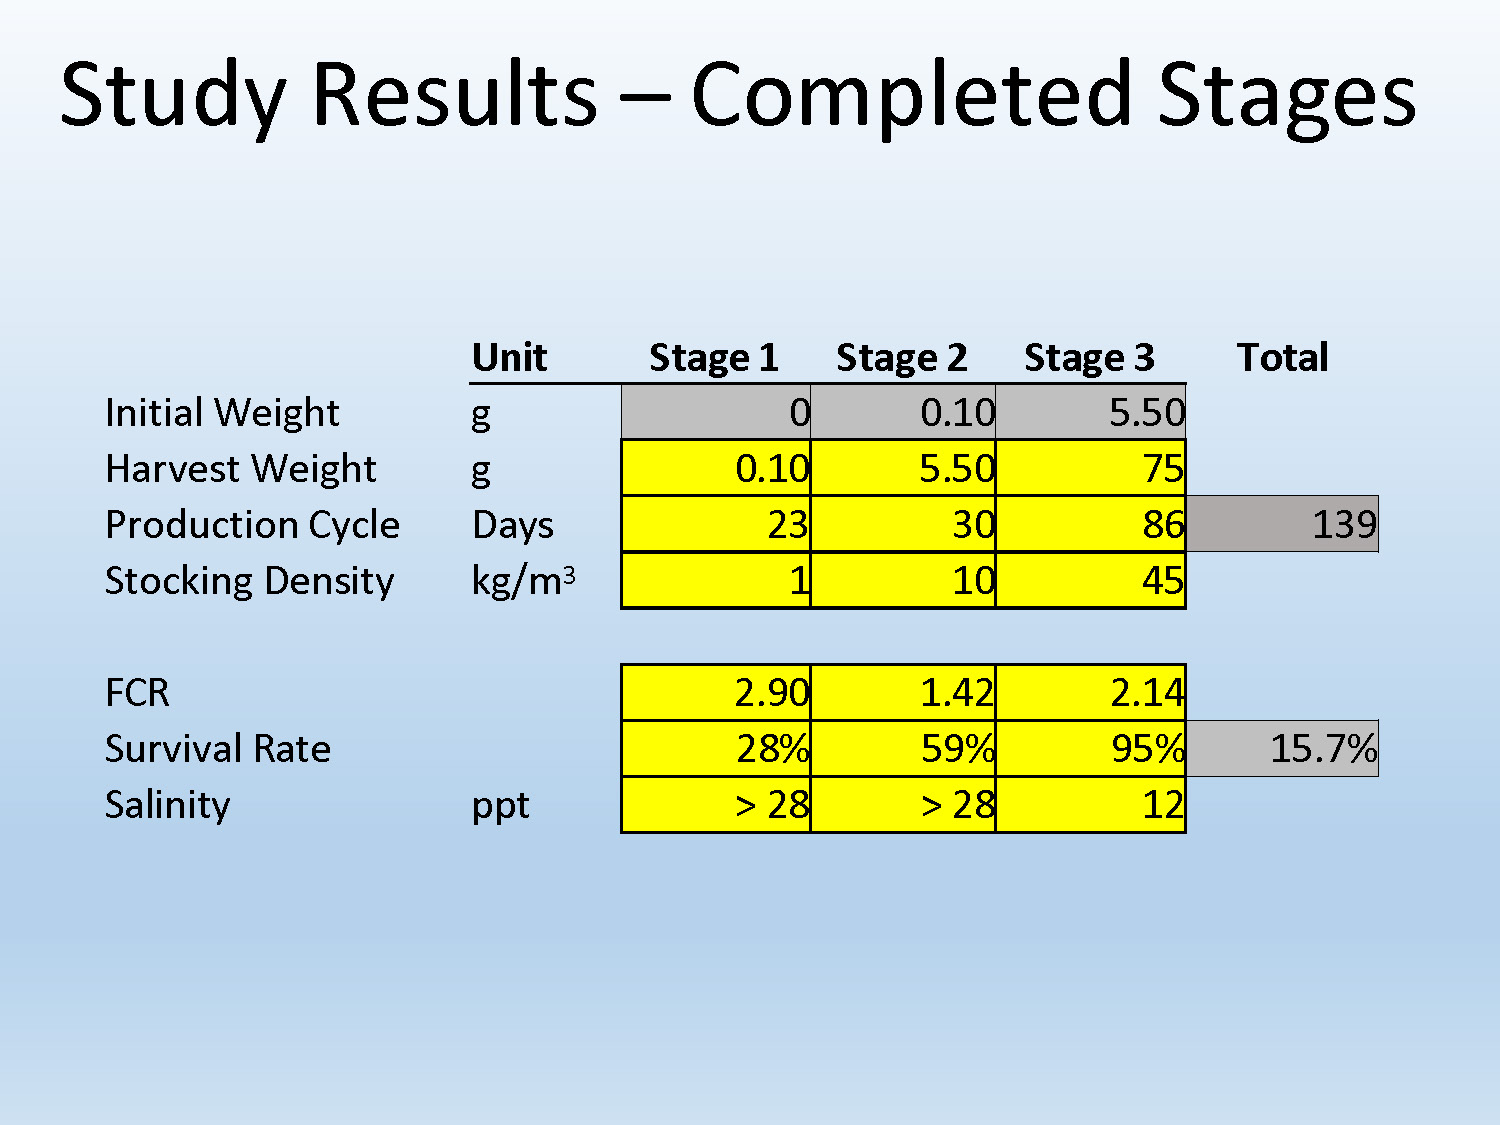
Study Results – Completed Stages
| Unit | Stage 1 | Stage 2 | Stage 3 | Total | |
|---|---|---|---|---|---|
| Initial Weight | g | 0 | 0.10 | 5.50 | |
| Harvest Weight | g | 0.10 | 5.50 | 75 | |
| Production Cycle | Days | 23 | 30 | 86 | 139 |
| Stocking Density | kg/m3 | 1 | 10 | 45 | |
| FCR | 2.90 | 1.42 | 2.14 | ||
| Survival Rate | 28% | 59% | 95% | 15.7% | |
| Salinity | ppt | > 28 | > 28 | 12 |
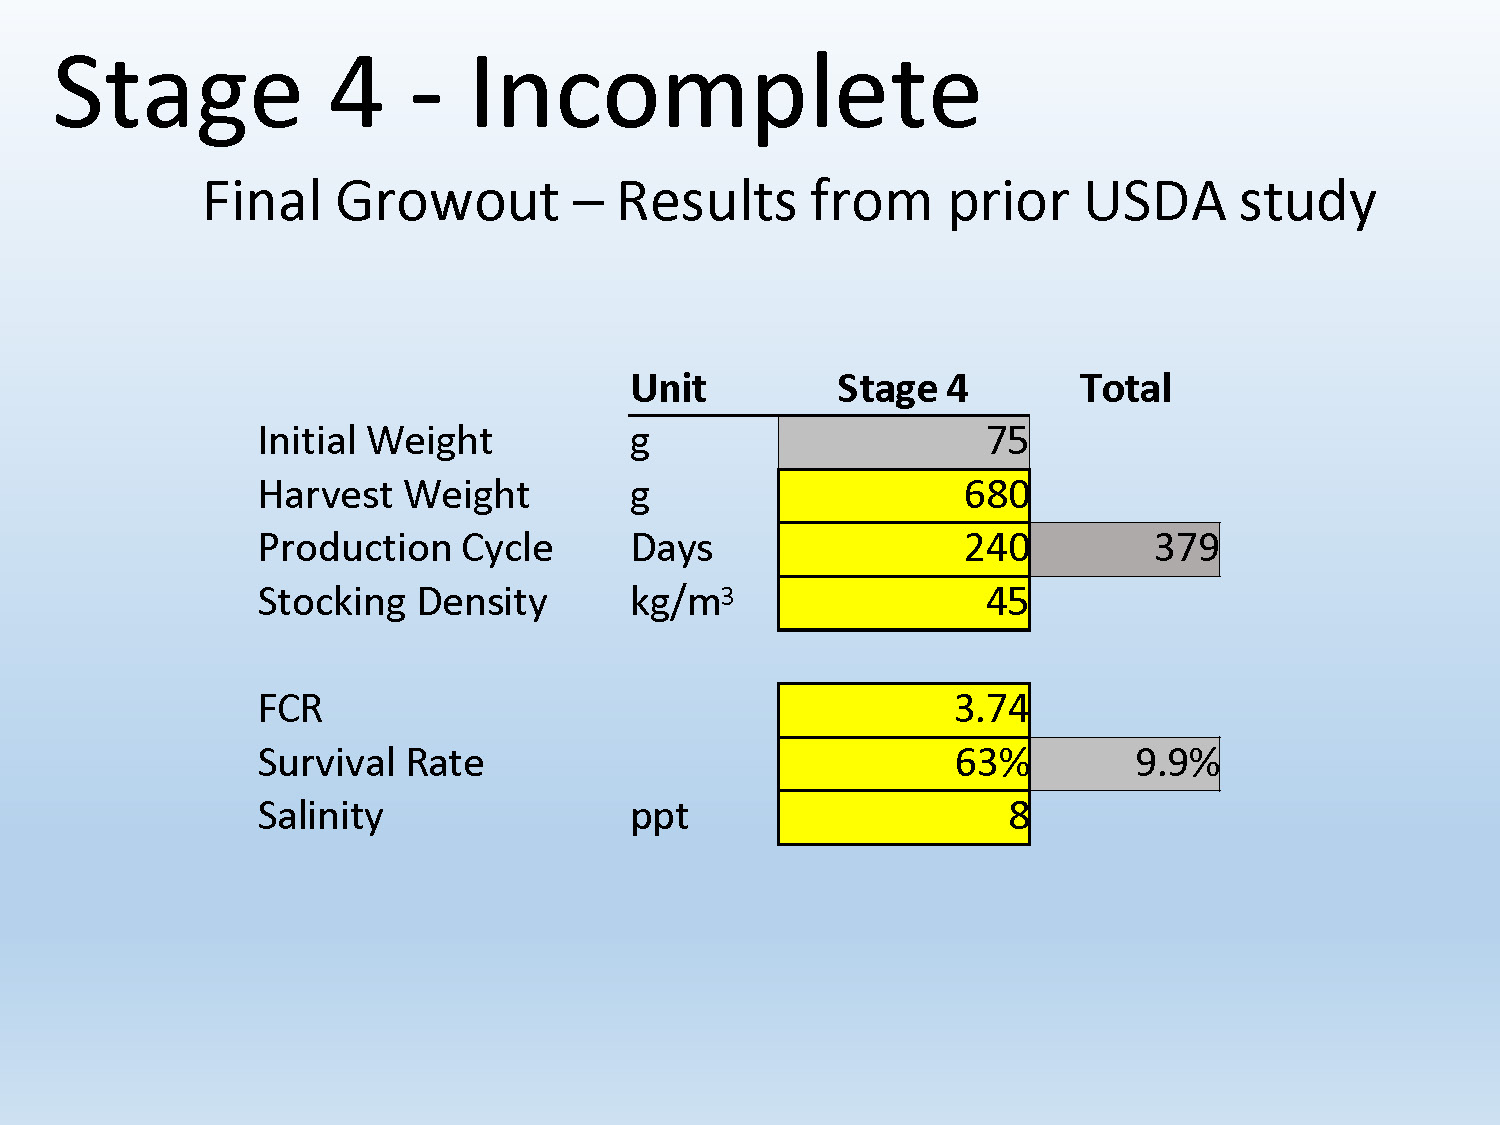
Stage 4 - Incomplete
Final Growout – Results from prior USDA study
| Unit | Stage 4 | Total | |
|---|---|---|---|
| Initial Weight | g | 75 | |
| Harvest Weight | g | 680 | |
| Production Cycle | Days | 240 | 379 |
| Stocking Density | kg/m3 | 45 | |
| FCR | 3.74 | ||
| Survival Rate | 63% | 9.9% | |
| Salinity | ppt | 8 |
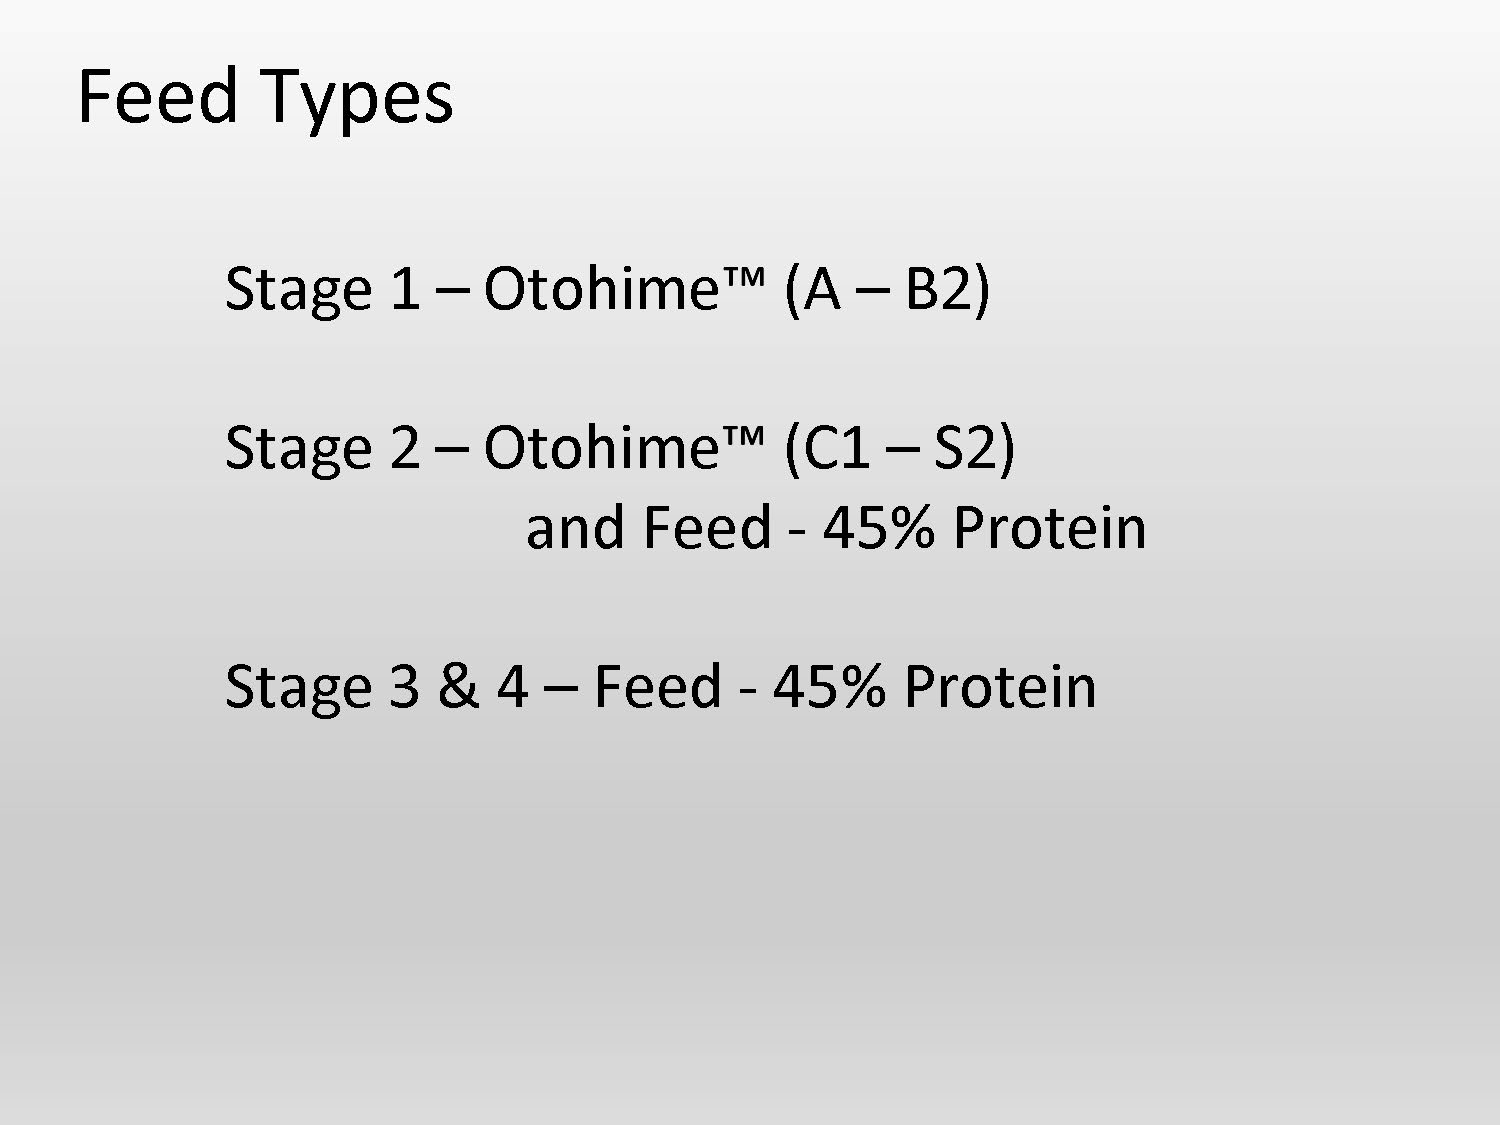
Feed Types
Stage 1 – Otohime™ (A – B2)
Stage 2 – Otohime™ (C1 – S2) and Feed - 45% Protein
Stage 3 & 4 – Feed - 45% Protein
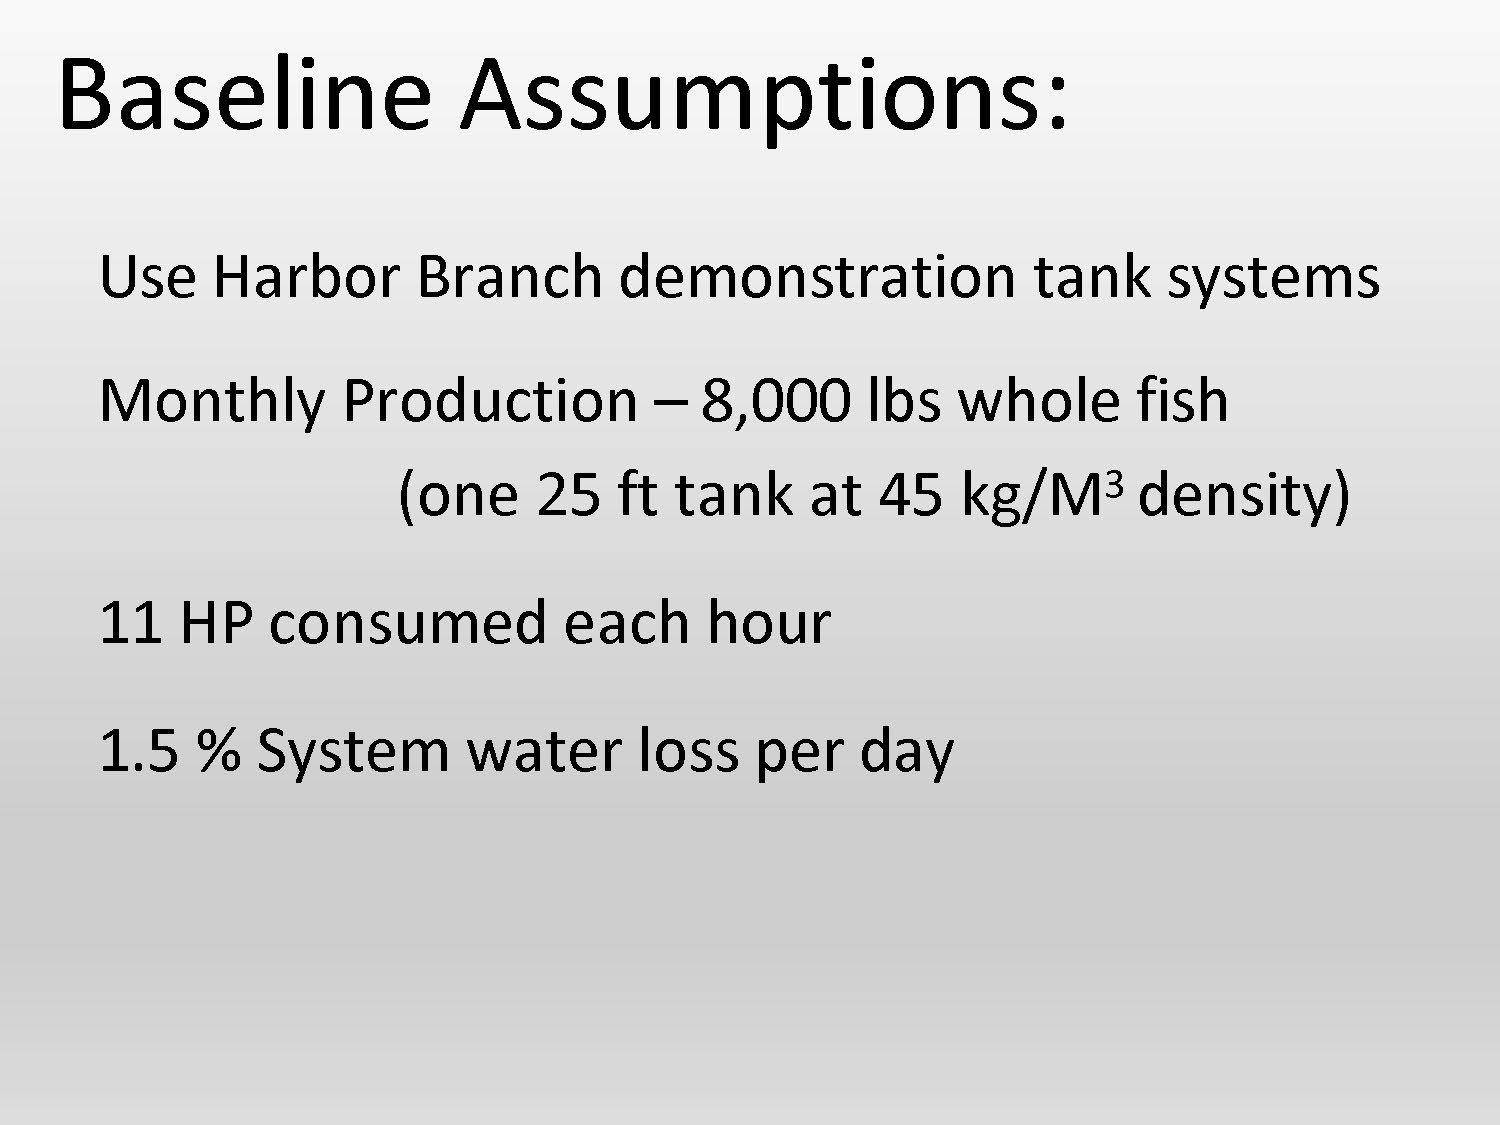
Baseline Assumptions:
Use Harbor Branch demonstration tank systems
Monthly Production – 8,000 lbs whole fish (one 25 ft tank at 45 kg/M3 density)
11 HP consumed each hour
1.5 % System water loss per day
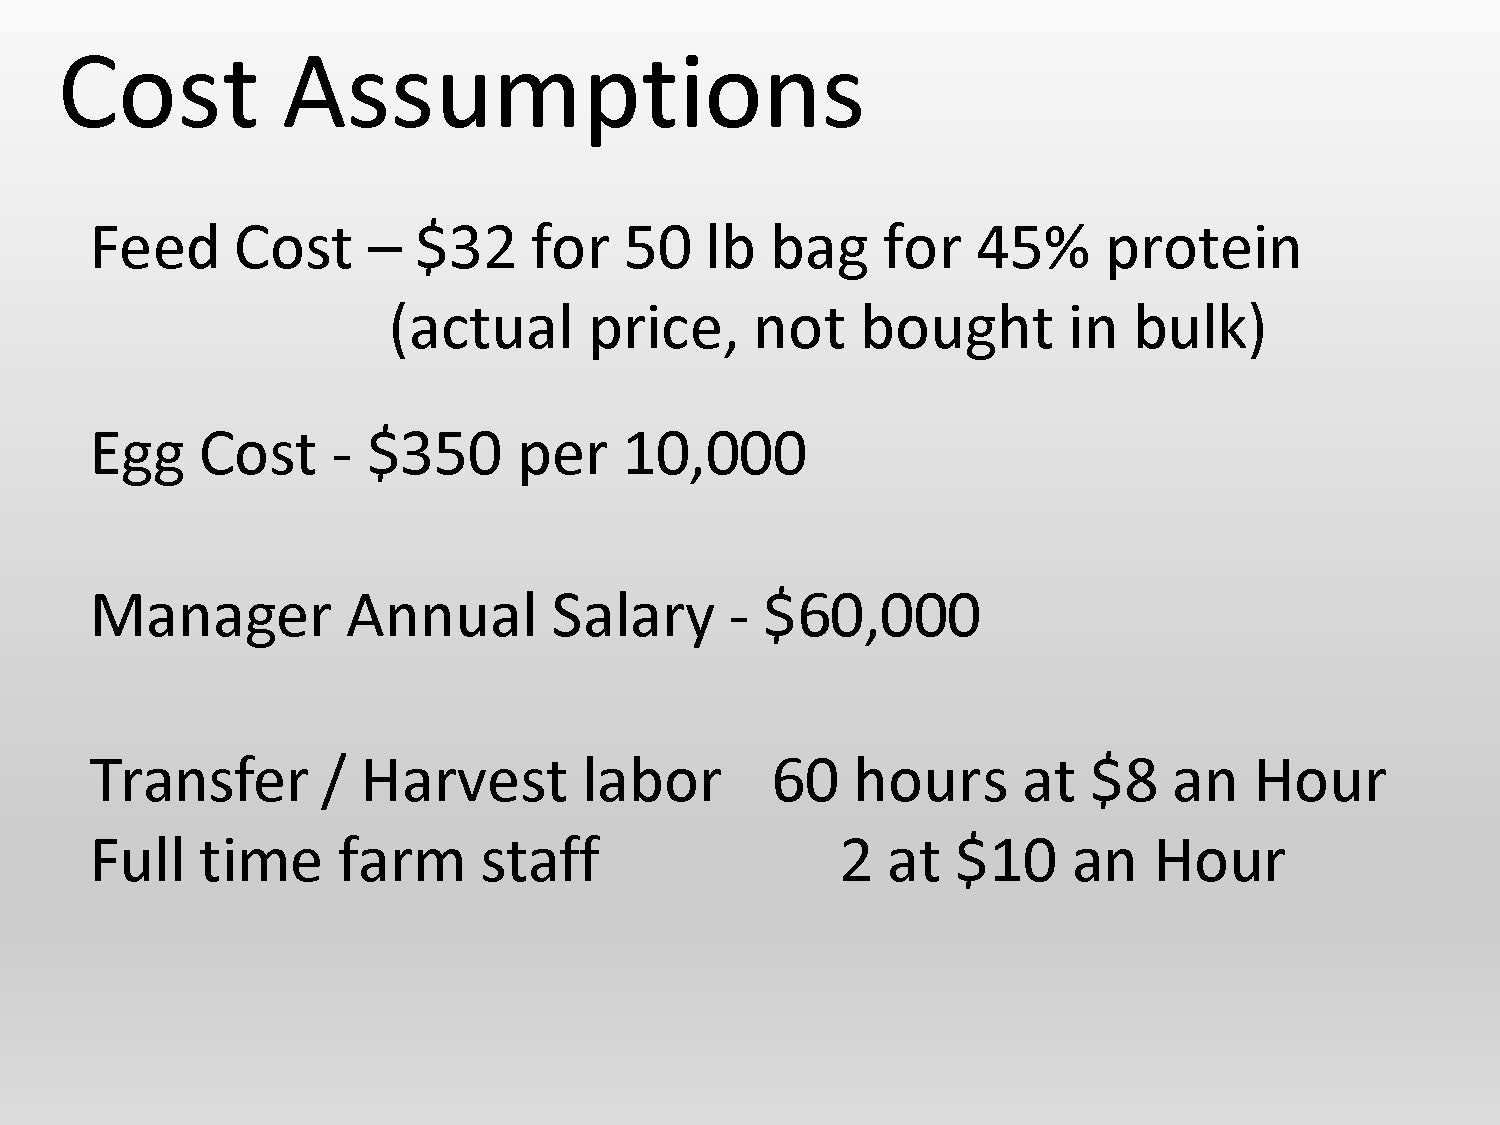
Cost Assumptions
Feed Cost – $32 for 50 lb bag for 45% protein (actual price, not bought in bulk)
Egg Cost - $350 per 10,000
Manager Annual Salary - $60,000
Transfer / Harvest labor - 60 hours at $8 an Hour
Full time farm staff - 2 at $10 an Hour
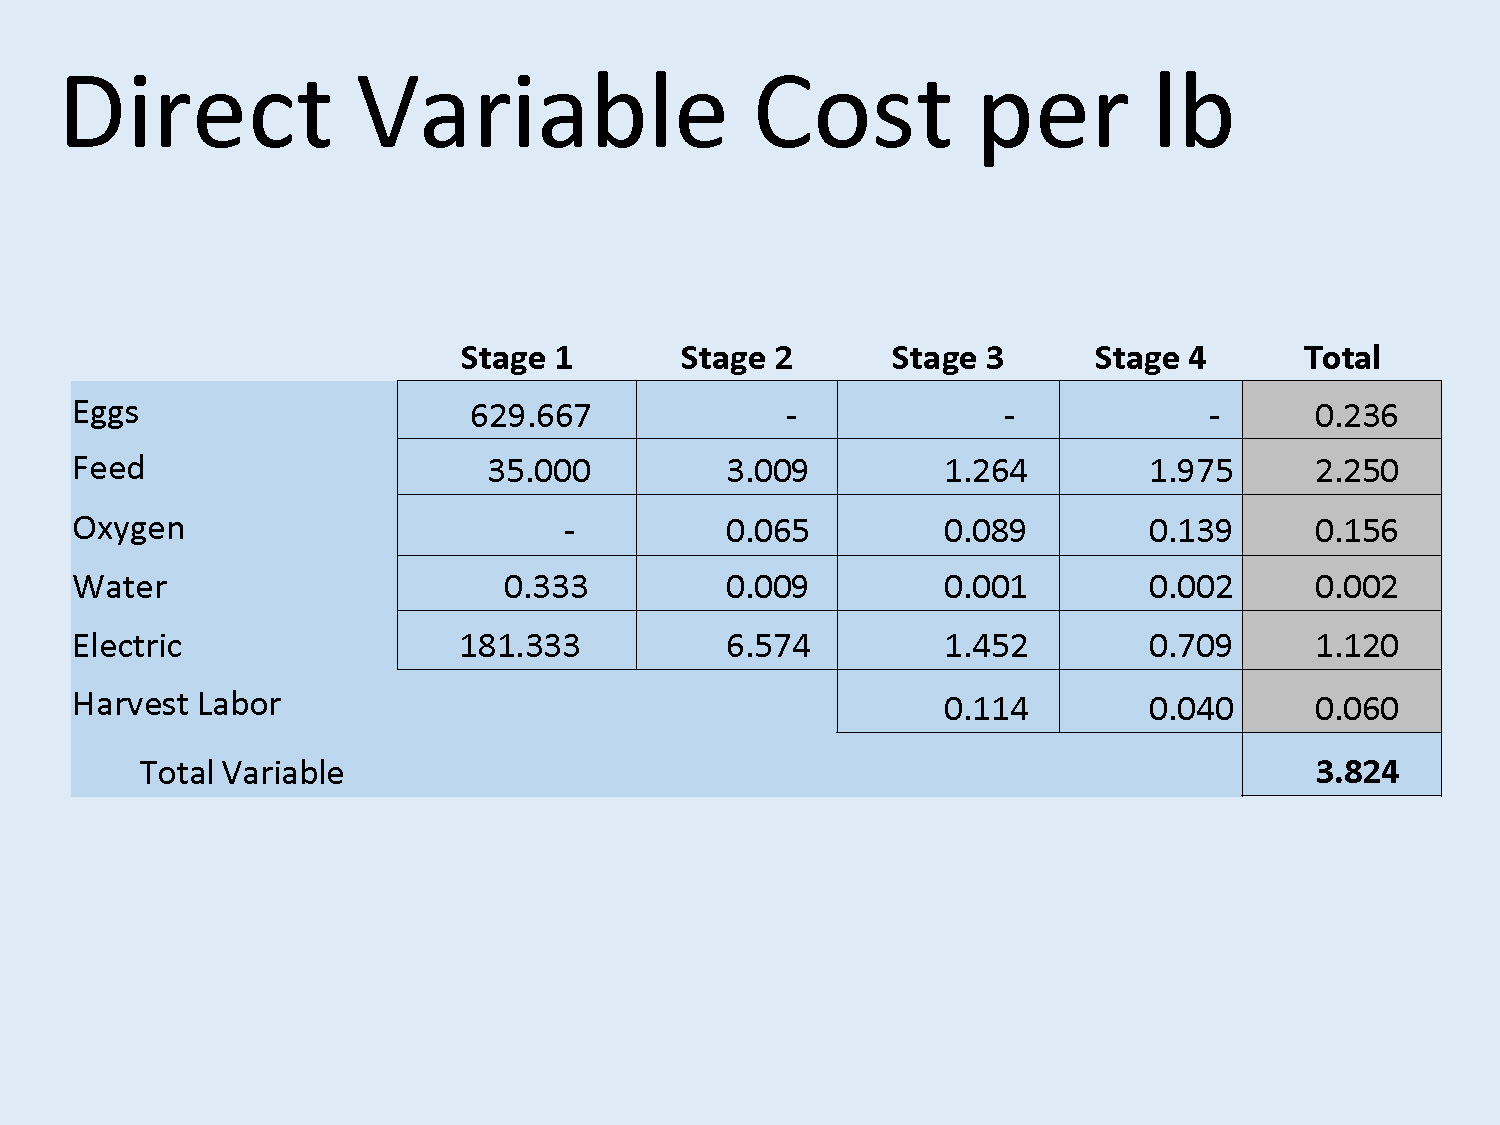
Direct Variable Cost per lb
| Stage 1 | Stage 2 | Stage 3 | Stage 4 | Total | |
|---|---|---|---|---|---|
| Eggs | 629.667 | - | - | - | 0.236 |
| Feed | 35.000 | 3.009 | 1.264 | 1.975 | 2.250 |
| Oxygen | - | 0.065 | 0.089 | 0.139 | 0.156 |
| Water | 0.333 | 0.009 | 0.001 | 0.002 | 0.002 |
| Electric | 181.333 | 6.574 | 1.452 | 0.709 | 1.120 |
| Harvest Labor | 0.114 | 0.040 | 0.060 | ||
| Total Variable | 3.824 |
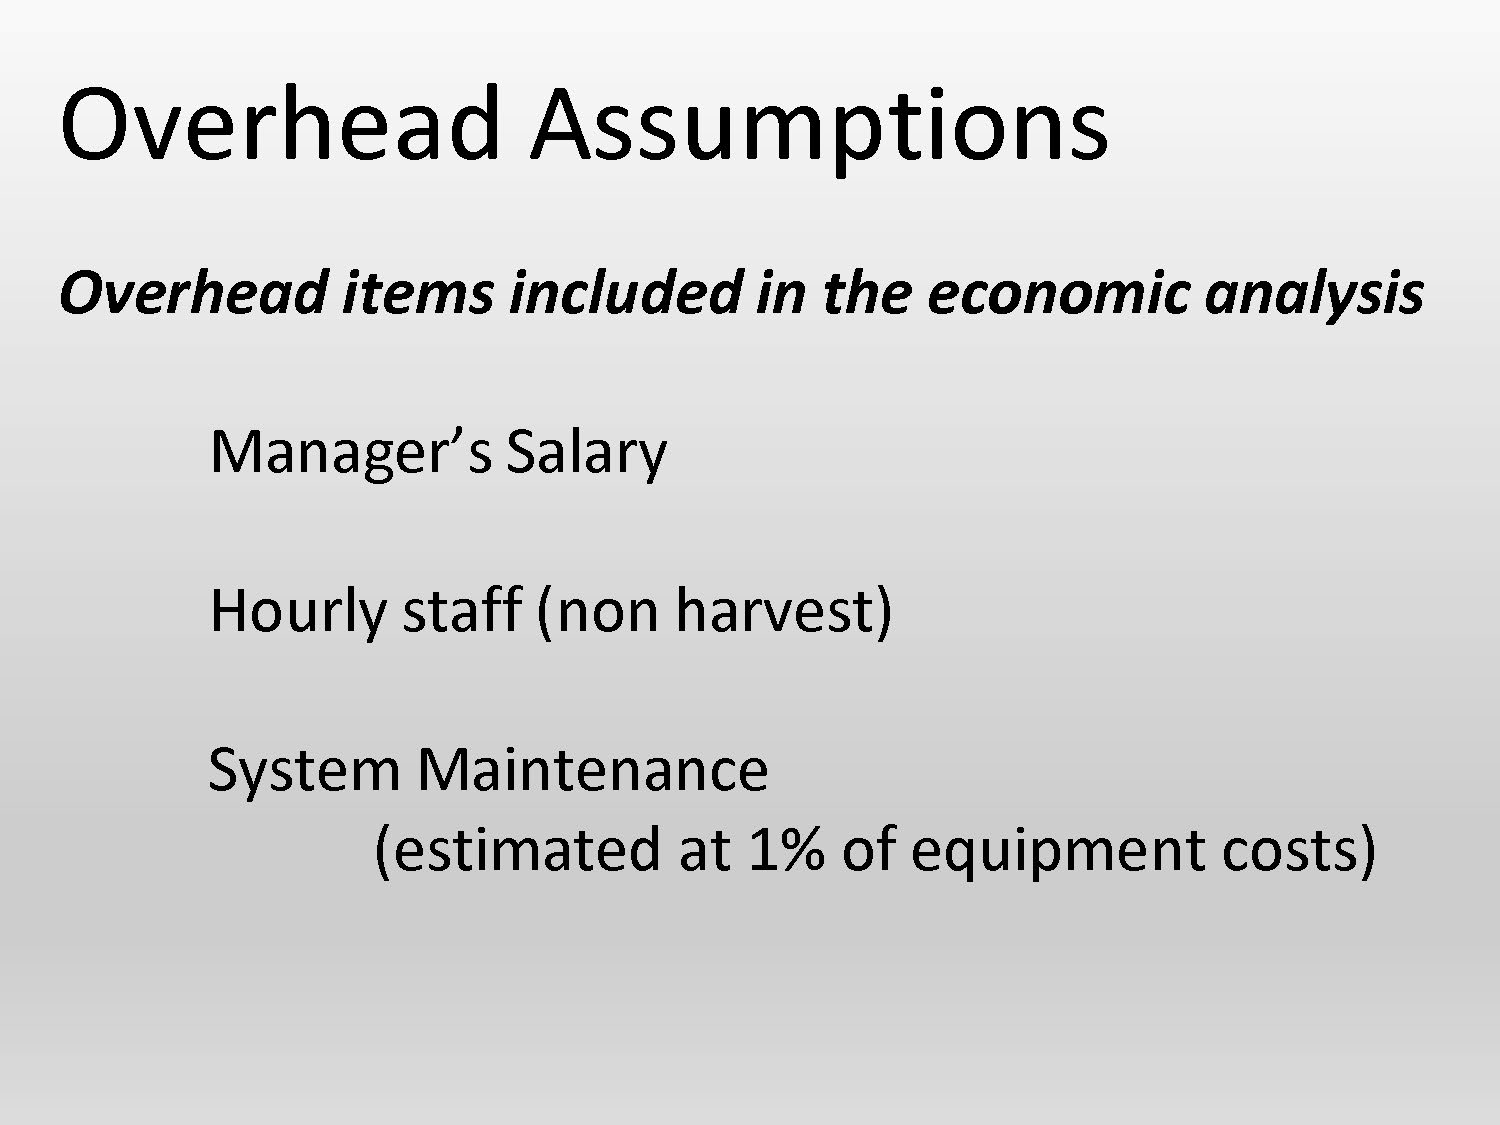
Overhead Assumptions
Overhead items included in the economic analysis
Manager's Salary
Hourly staff (non harvest)
System Maintenance (estimated at 1% of equipment costs)
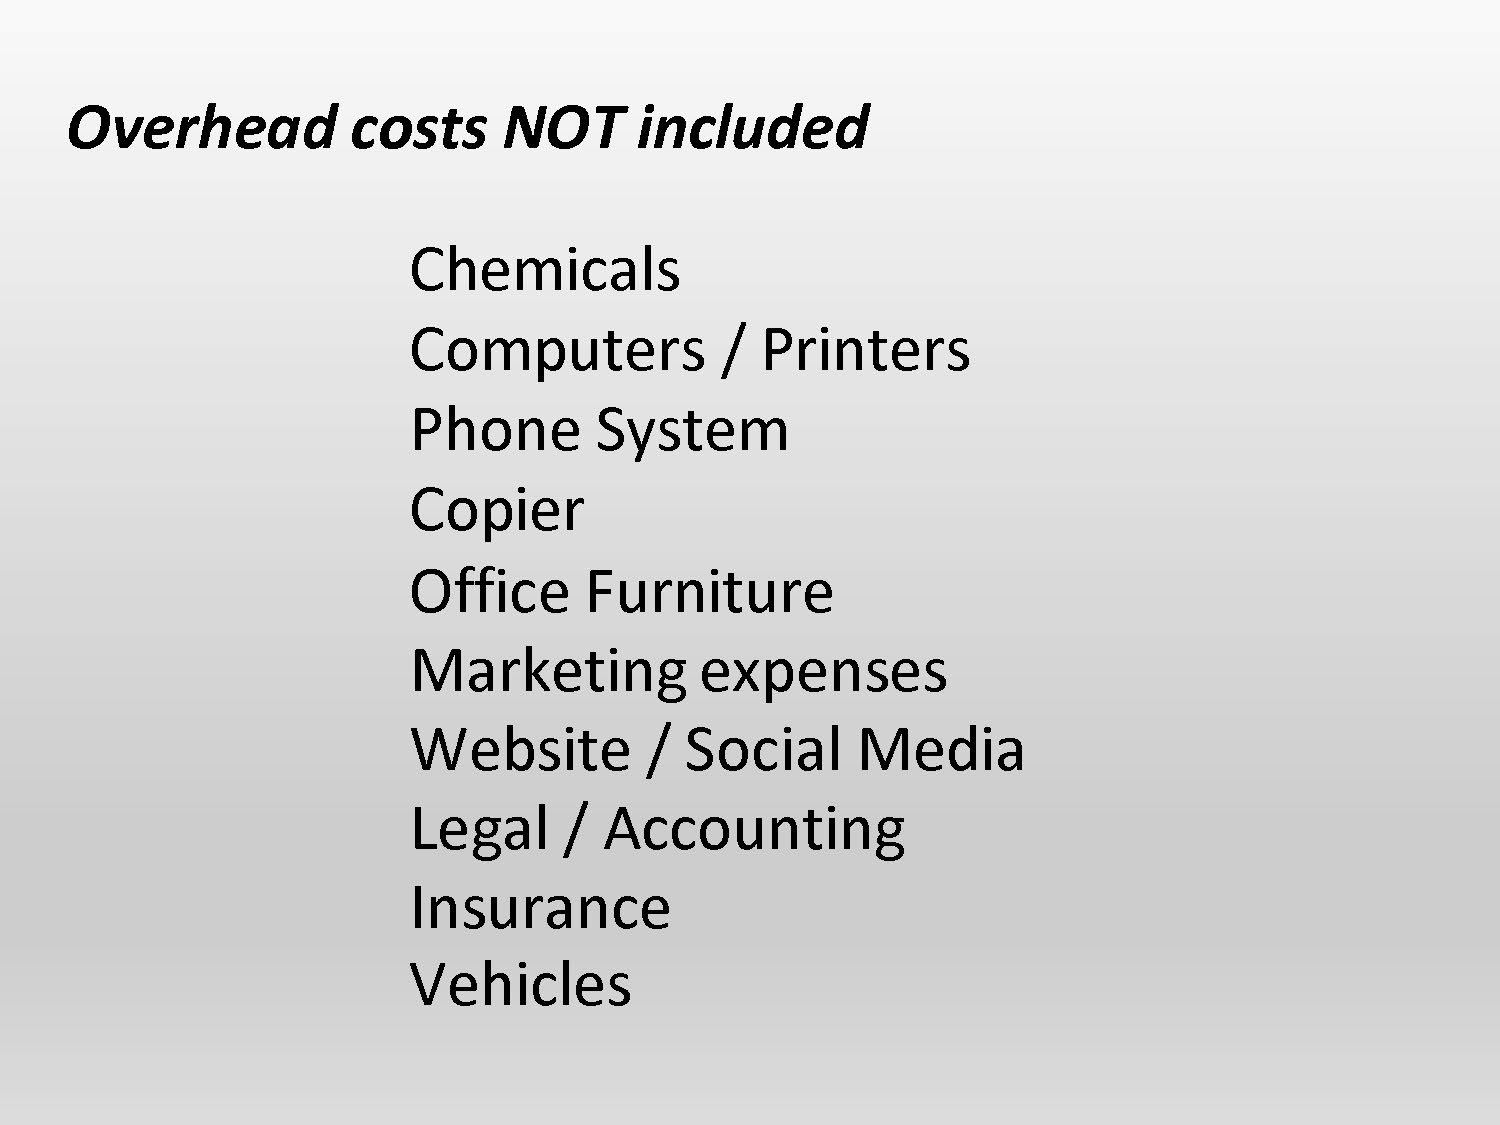
Overhead costs NOT included
Chemicals
Computers / Printers
Phone System
Copier
Office Furniture
Marketing
expenses
Website / Social Media
Legal / Accounting
Insurance
Vehicles
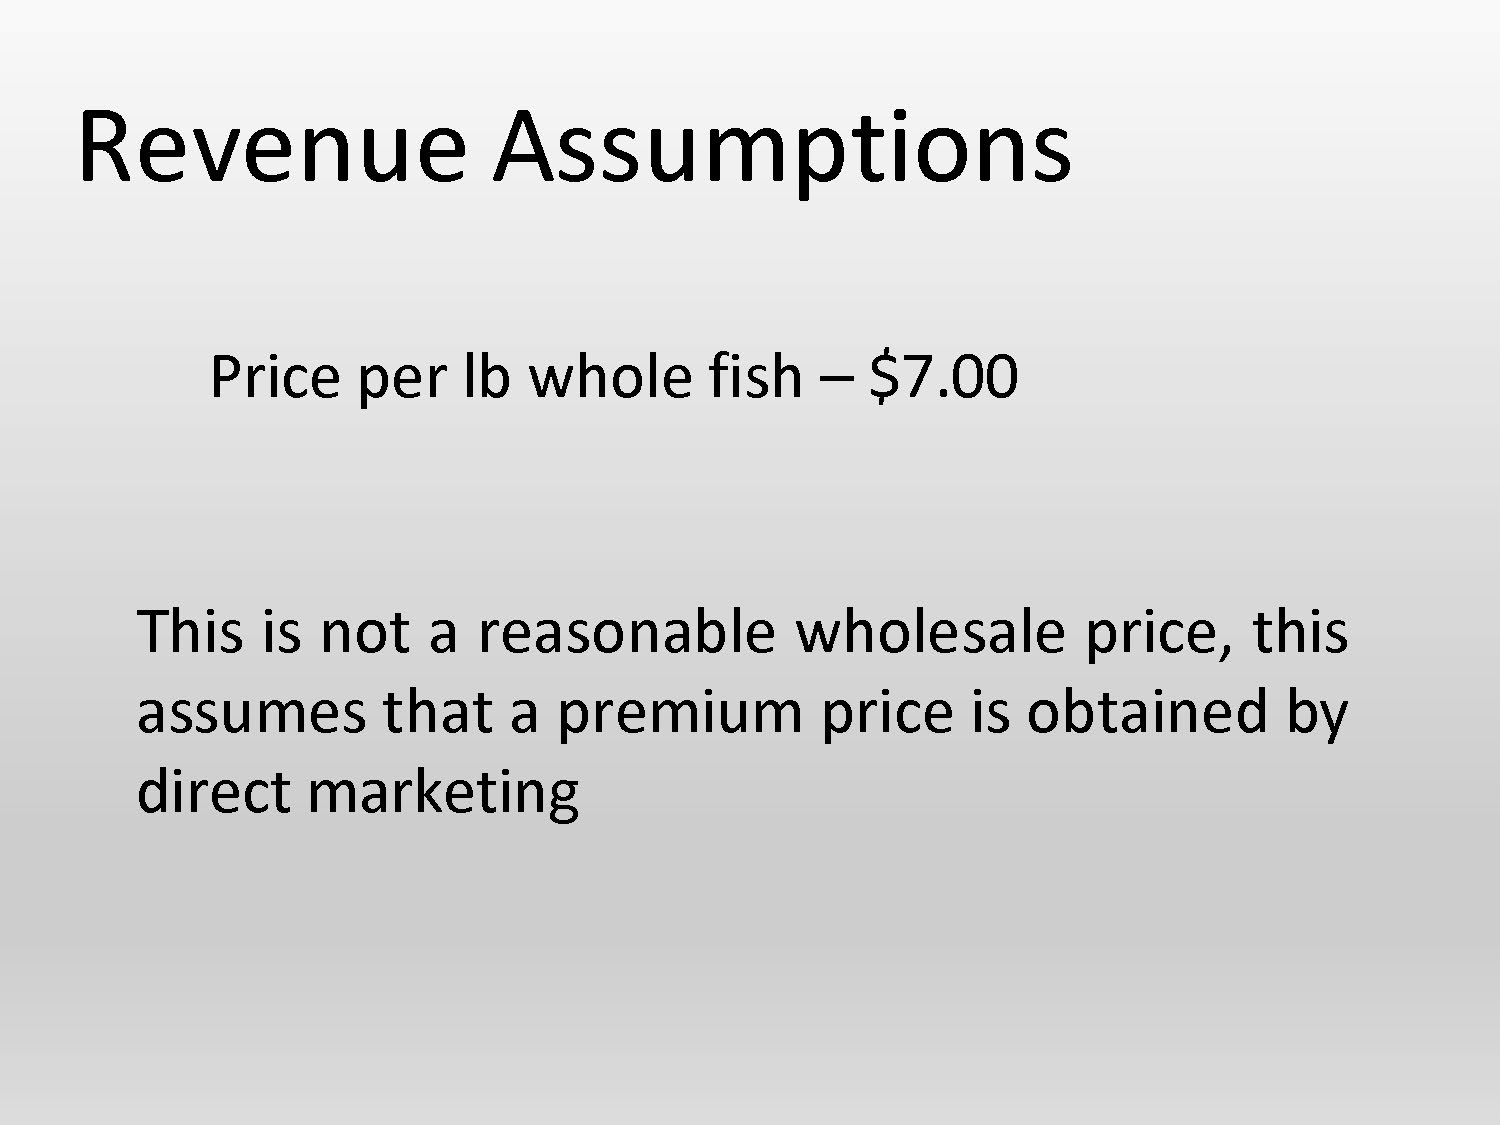
Revenue Assumptions
Price per lb whole fish – $7.00
This is not a reasonable wholesale price, this assumes that a premium price is obtained by direct marketing
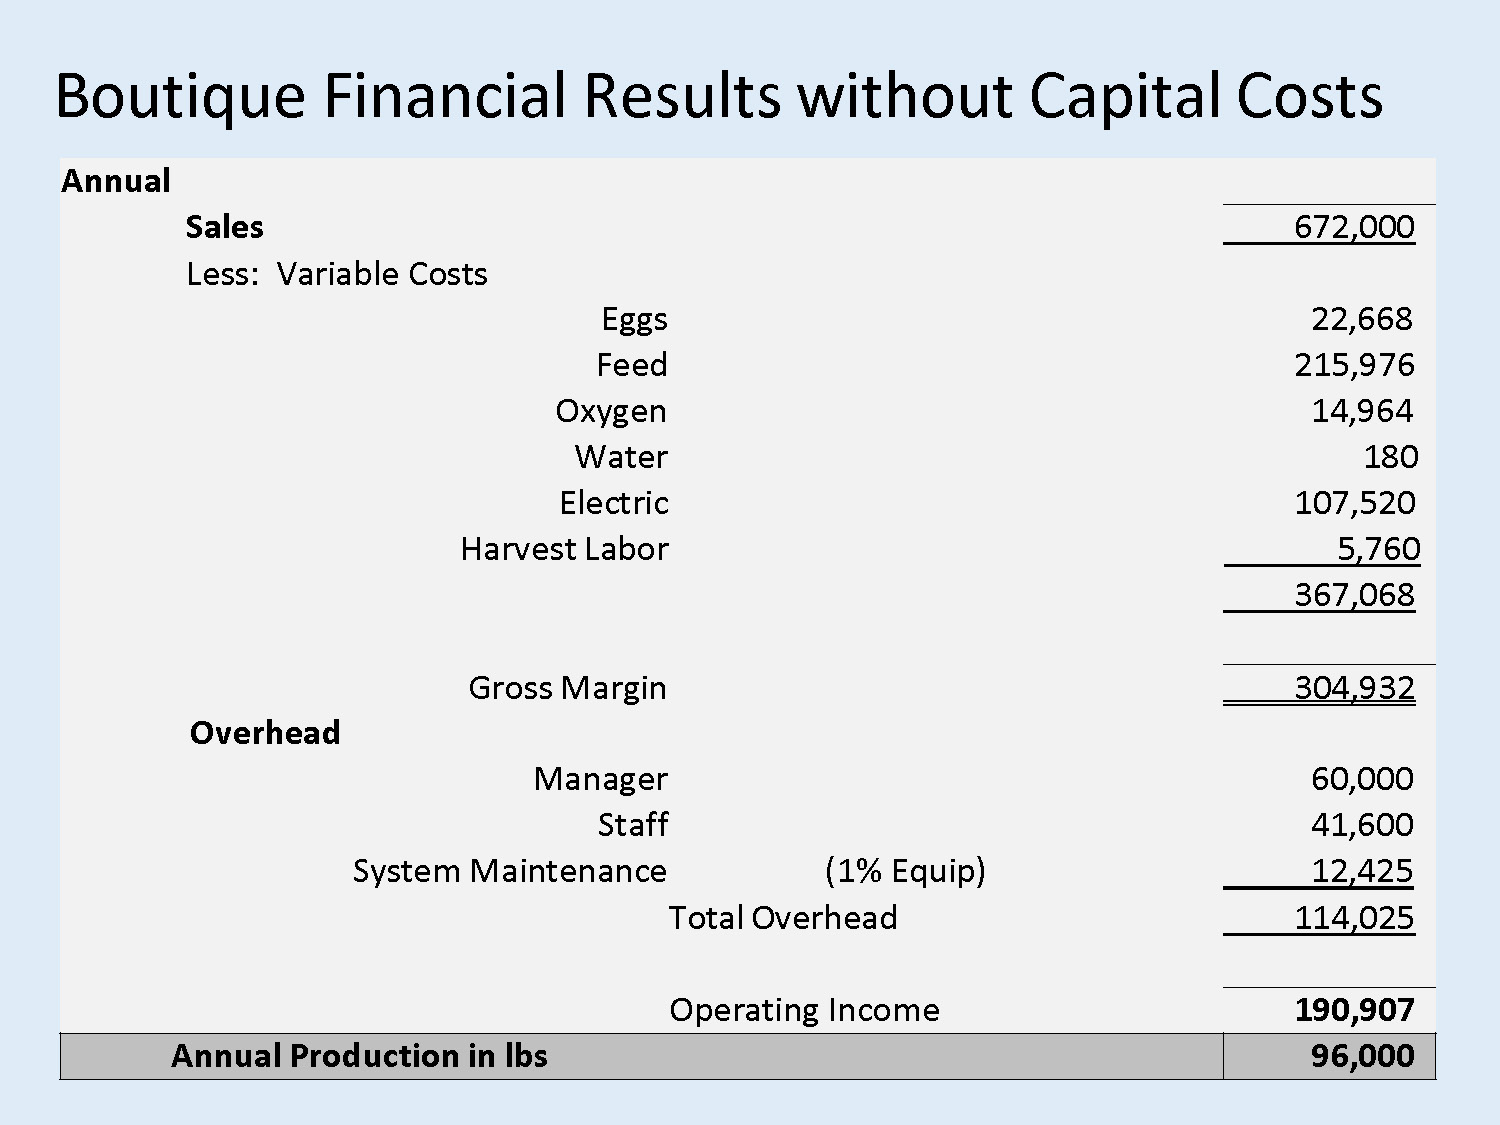
Boutique Financial Results without Capital Costs
| Annual | ||
| Sales | 672,000 | |
| Less: Variable Costs | ||
| Eggs | 22,668 | |
| Feed | 215,976 | |
| Oxygen | 14,964 | |
| Water | 180 | |
| Electric | 107,520 | |
| Harvest Labor | 5,760 | |
| 367,068 | ||
| Gross Margin | 304,932 | |
| Overhead | ||
| Manager | 60,000 | |
| Staff | 41,600 | |
| System Maintenance | (1% Equip) | 12,425 |
| Total Overhead | 114,025 | |
| Operating Income | 190,907 | |
| Annual Production in lbs | 96,000 |
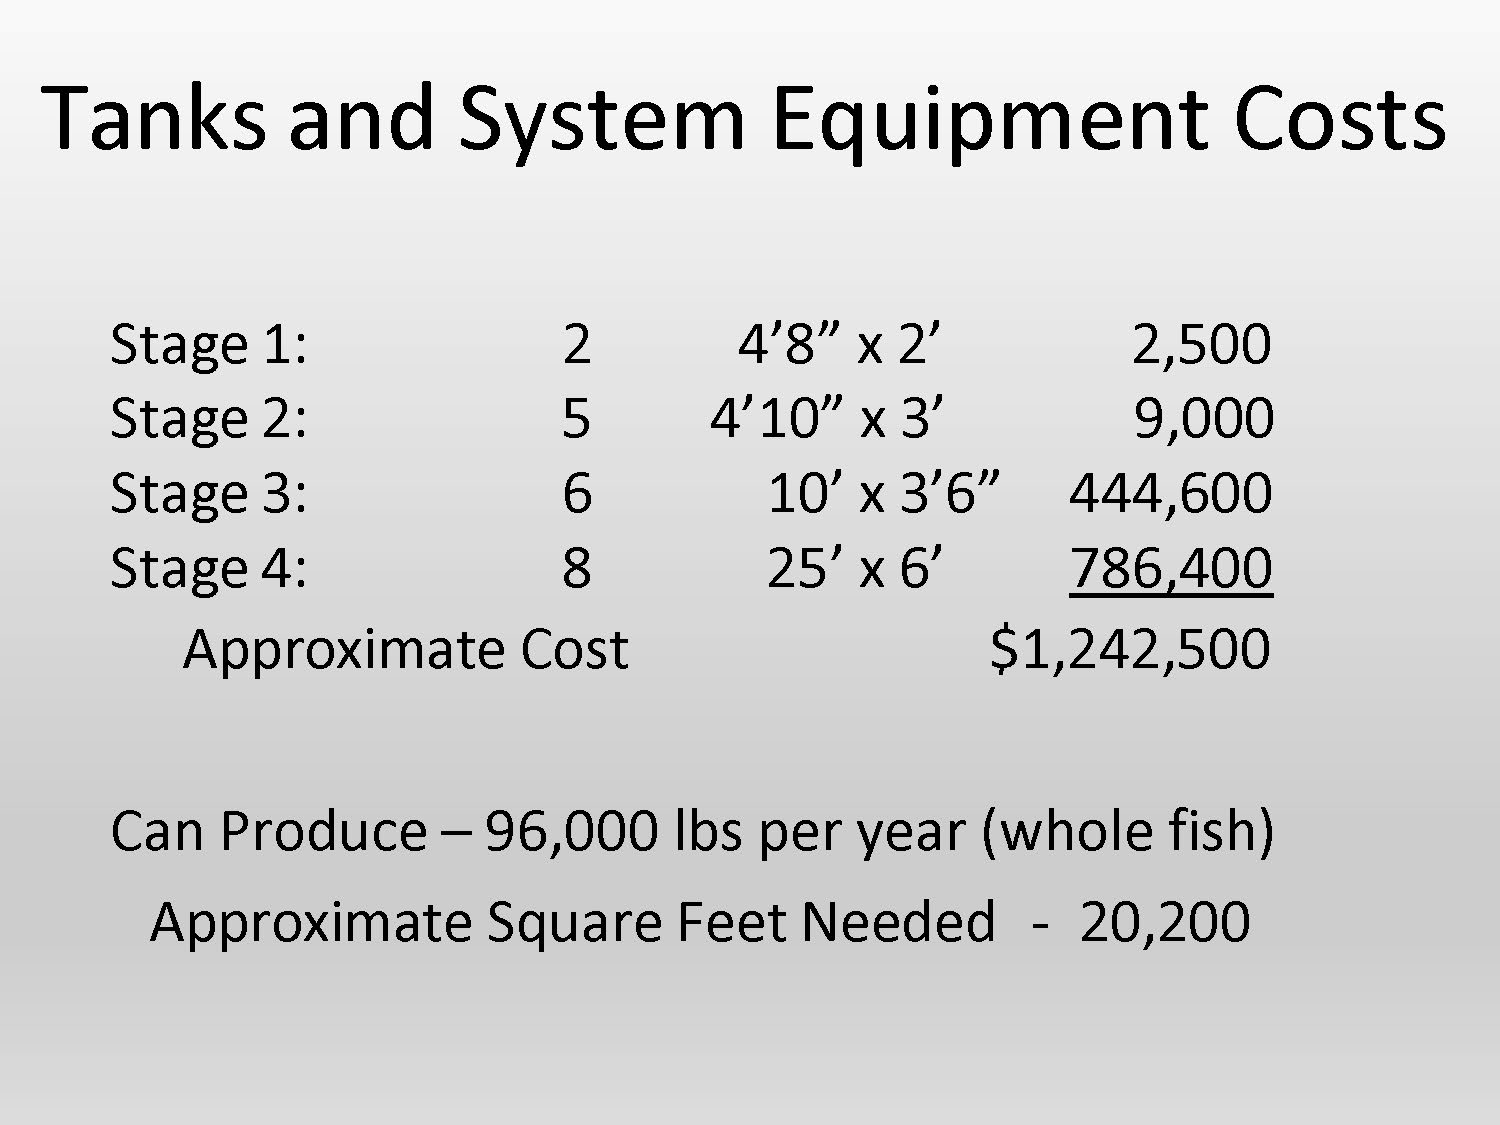
Tanks and System Equipment Costs
| Stage 1: | 2 | 4'8" x 2' | 2,500 |
| Stage 2: | 5 | 4'10" x 3' | 9,000 |
| Stage 3: | 6 | 10' x 3'6" | 444,600 |
| Stage 4: | 8 | 25' x 6' | 786,400 |
Approximate Cost $1,242,500
Can Produce – 96,000 lbs per year (whole fish) Approximate Square Feet Needed - 20,200
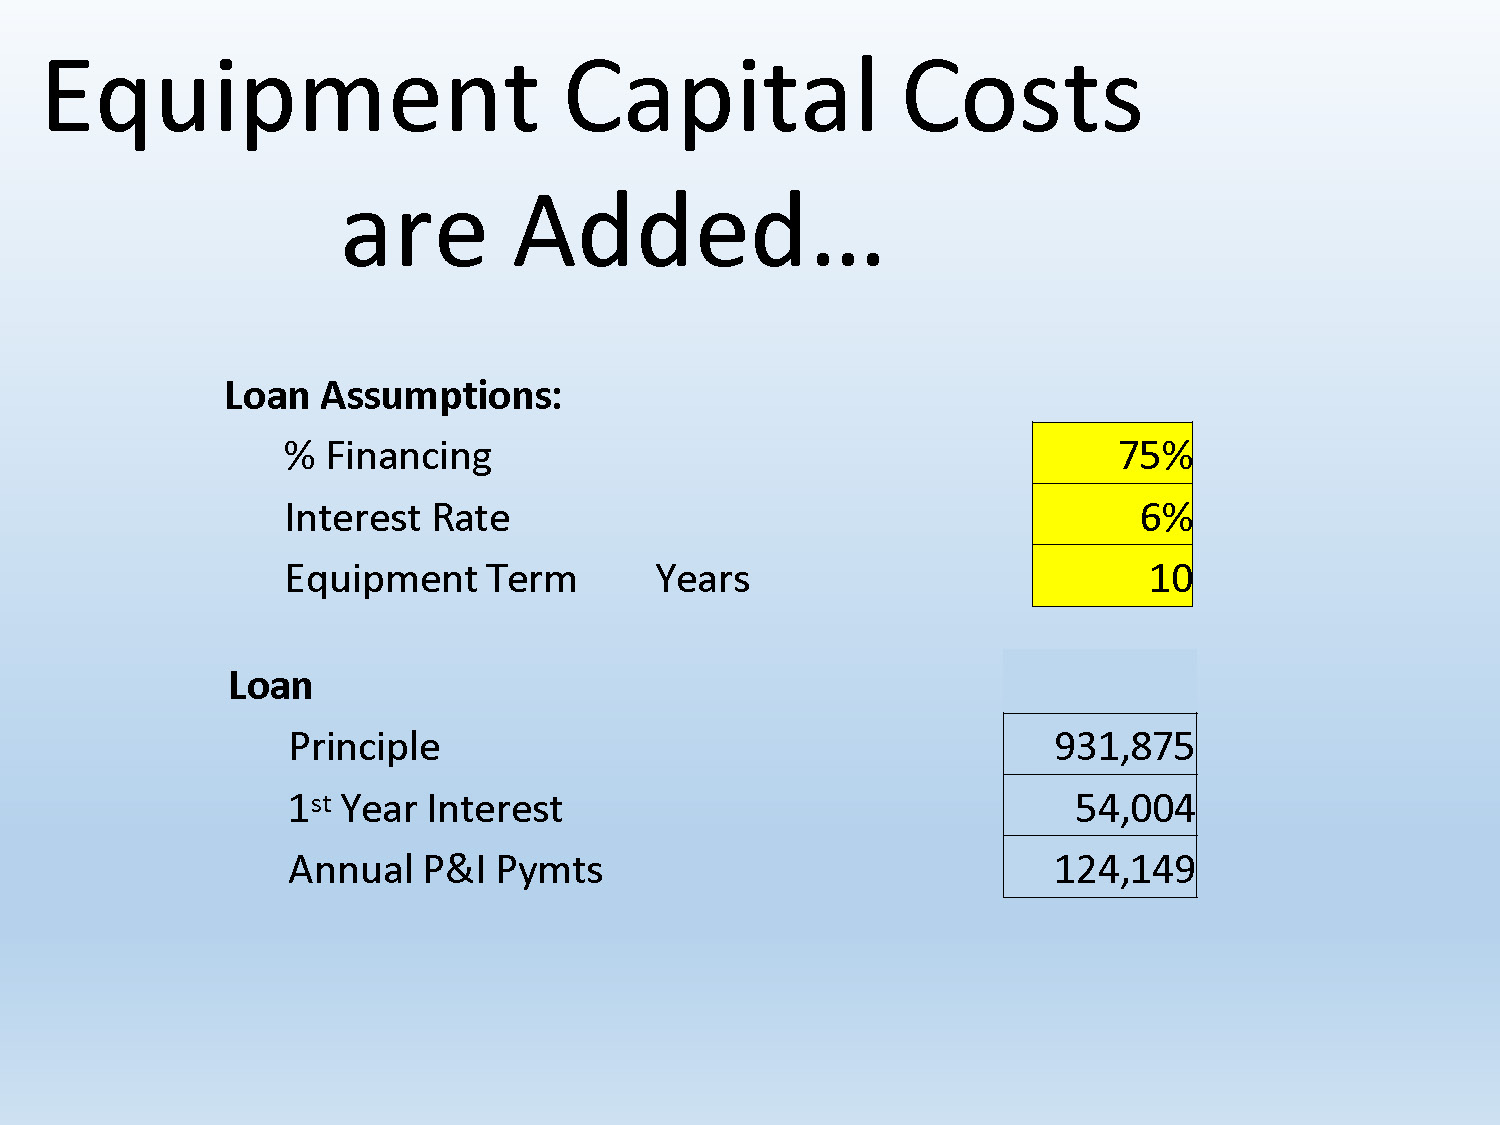
Equipment Capital Costs are Added…
| Loan Assumptions: | ||
|---|---|---|
| % Financing | 75% | |
| Interest Rate | 6% | |
| Equipment Term | Years | 10 |
| Loan | |
|---|---|
| Principle | 931,875 |
| 1st Year Interest | 54,004 |
| Annual P&I Pymts | 124,149 |
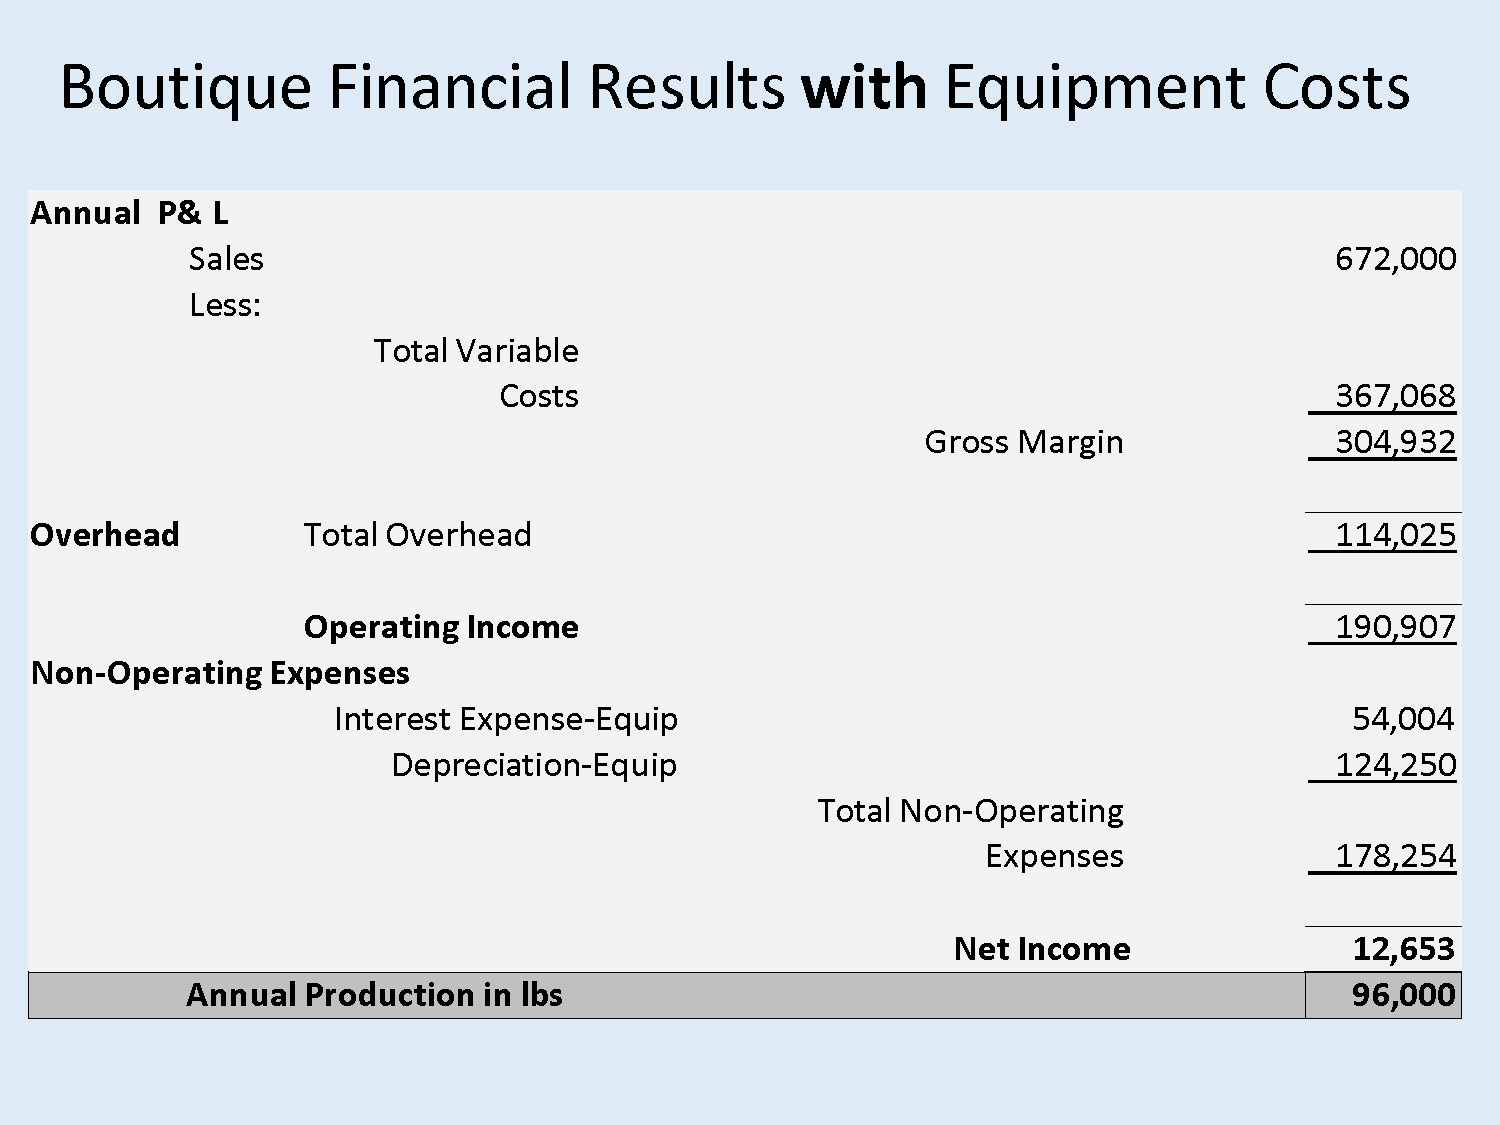
Boutique Financial Results with Equipment Costs
| Annual P& L | ||
| Sales | 672,000 | |
| Less: | ||
| Total Variable Costs | 367,068 | |
| Gross Margin | 304,932 | |
| Overhead | Total Overhead | 114,025 |
| Operating Income | 190,907 | |
| Non-Operating Expenses | ||
| Interest Expense-Equip | 54,004 | |
| Depreciation-Equip | 124,250 | |
| Total Non-Operating Expenses | 178,254 | |
| Net Income | 12,653 | |
| Annual Production in lbs | 96,000 |
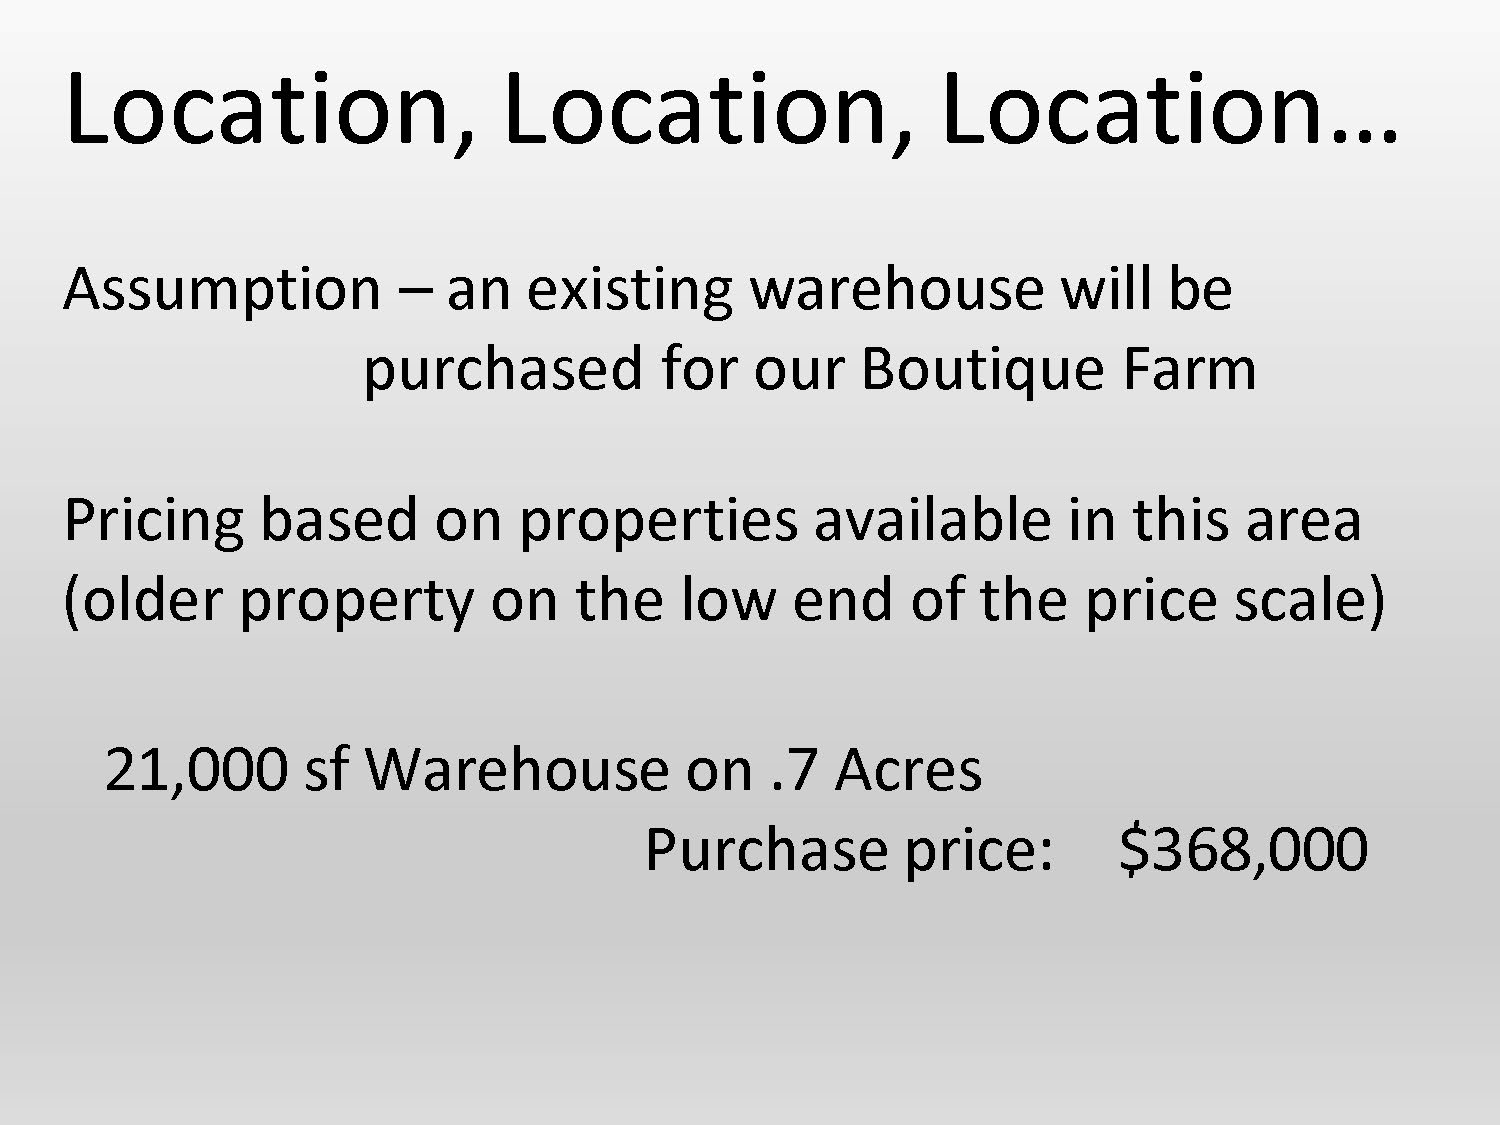
Location, Location, Location…
Assumption – an existing warehouse will be purchased for our Boutique Farm
Pricing based on properties available in this area (older property on the low end of the price scale)
21,000 sf Warehouse on .7 Acres
Purchase price: $368,000
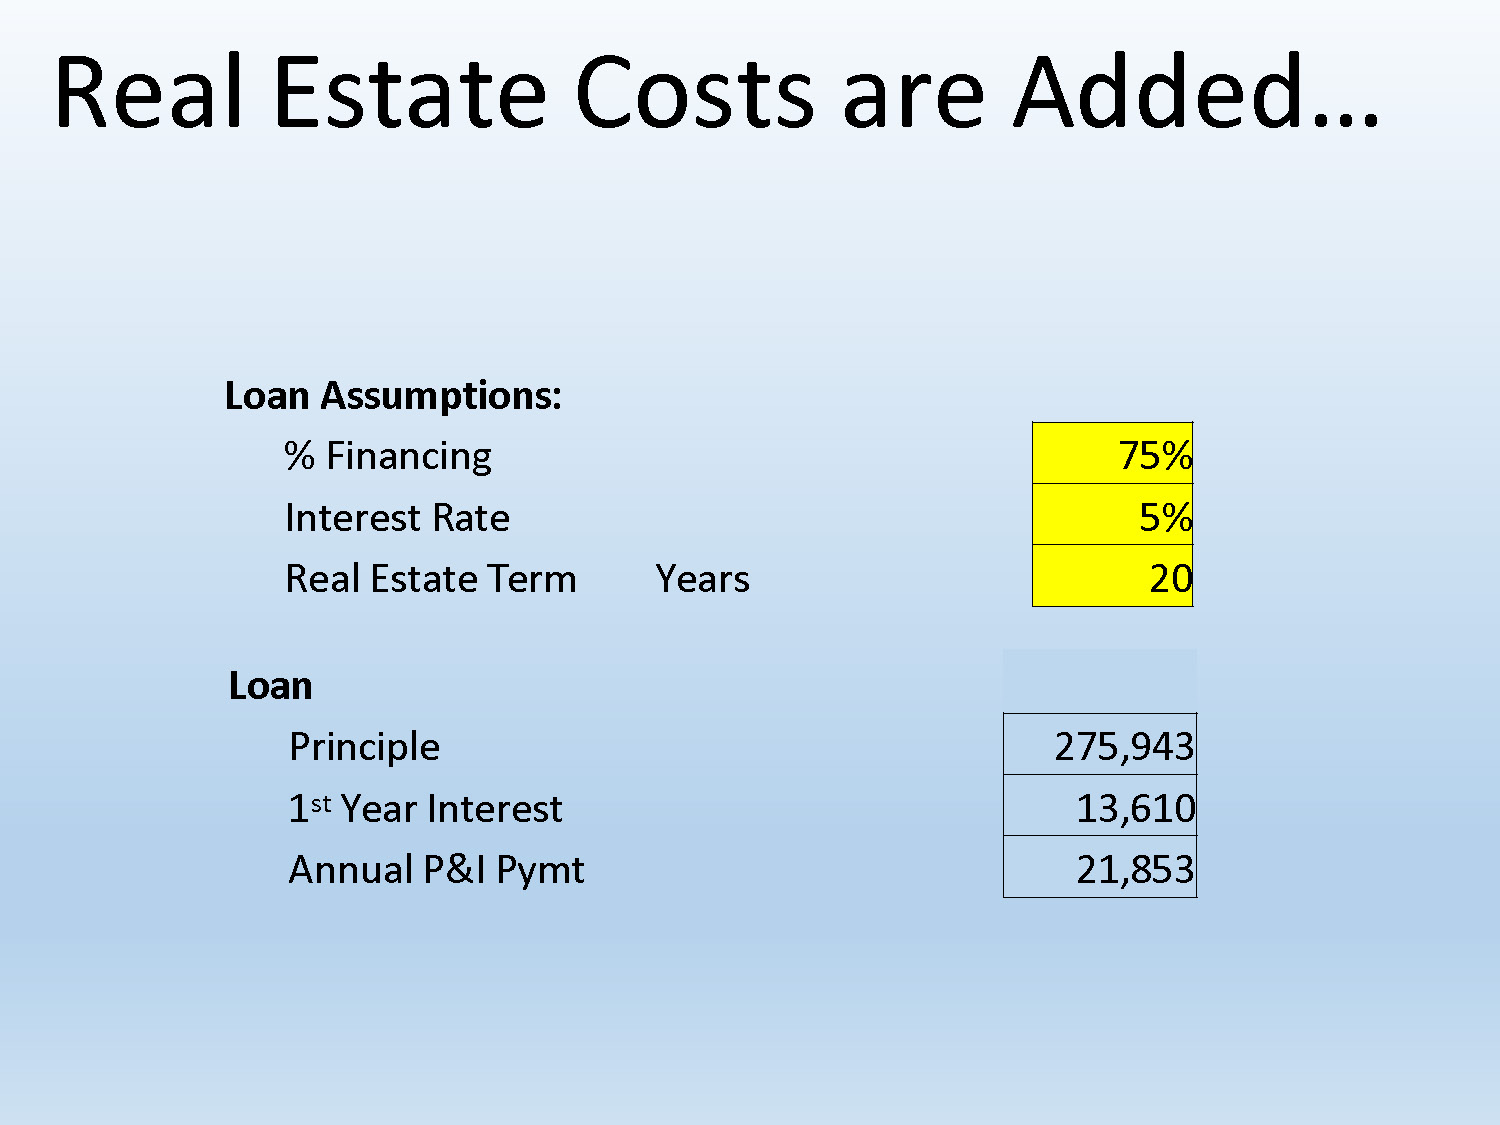
Real Estate Costs are Added…
| Loan Assumptions: | ||
|---|---|---|
| % Financing | 75% | |
| Interest Rate | 5% | |
| Real Estate Term | Years | 20 |
| Loan | |
|---|---|
| Principle | 275,943 |
| 1st Year Interest | 13,610 |
| Annual P&I Pymt | 21,853 |
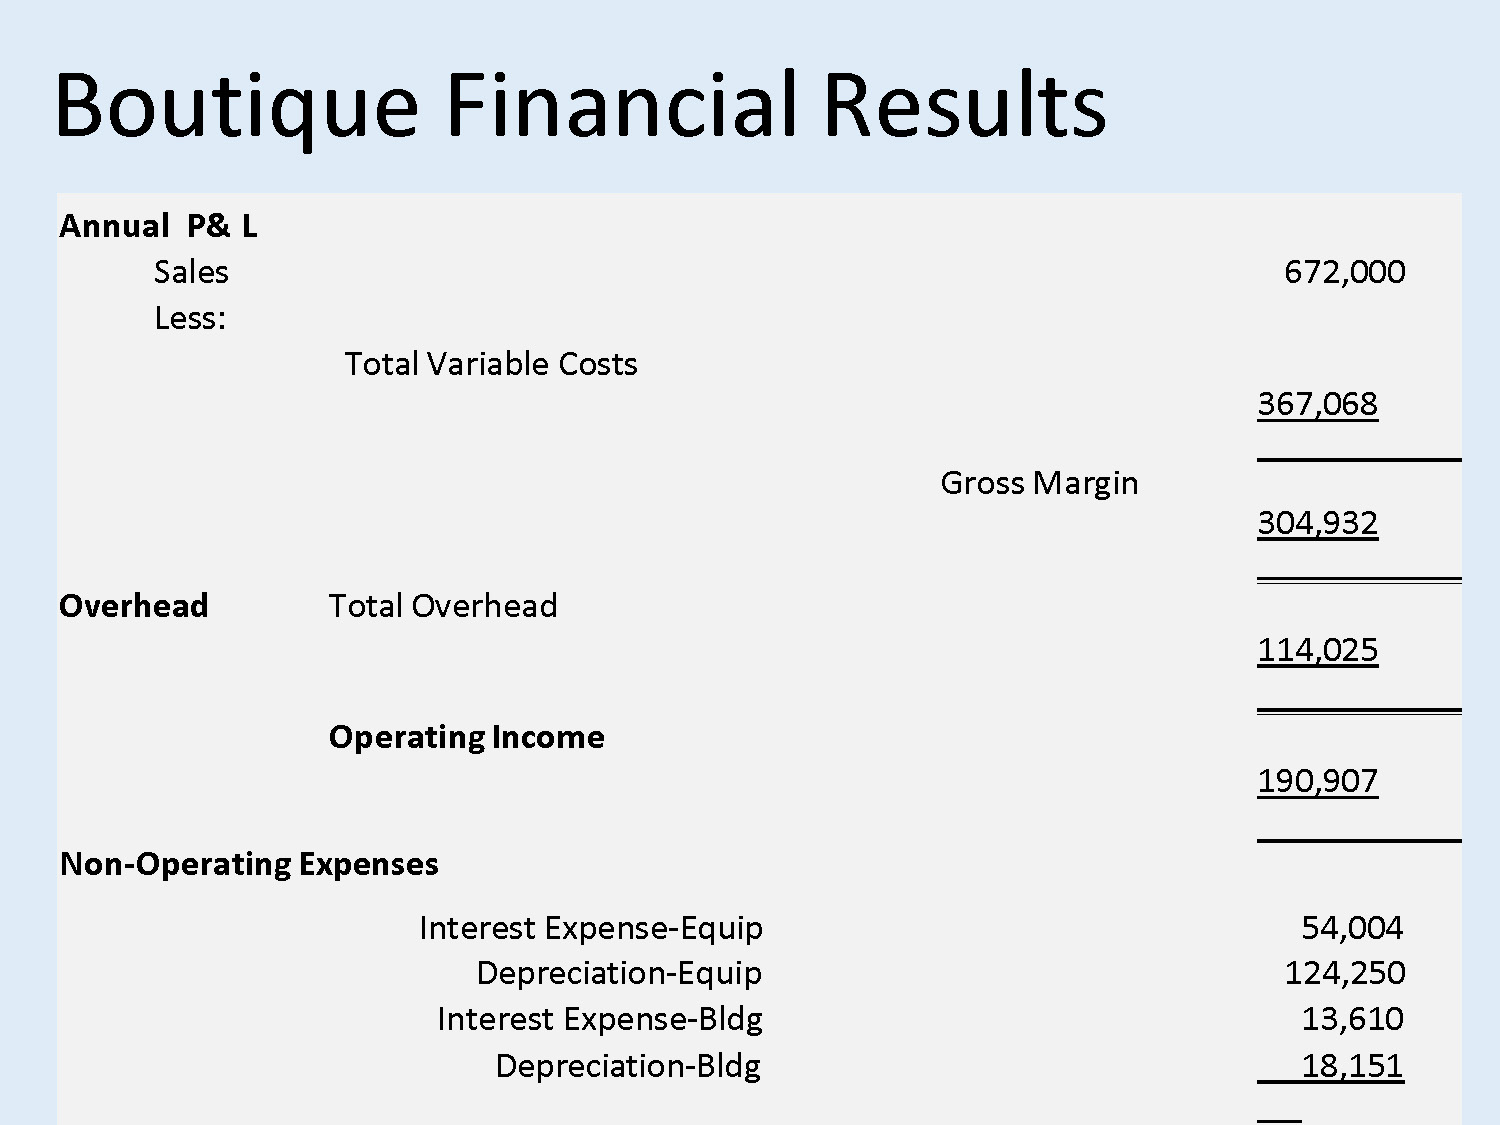
Boutique Financial Results
| Annual P& L | ||
| Sales | 672,000 | |
| Less: | ||
| Total Variable Costs | 367,068 | |
| Gross Margin | 304,932 | |
| Overhead | Total Overhead | 114,025 |
| Operating Income | 190,907 | |
| Non-Operating Expenses | ||
| Interest Expense-Equip | 54,004 | |
| Depreciation-Equip | 124,250 | |
| Interest Expense-Bldg | 13,610 | |
| Depreciation-Bldg | 18,151 | |
| Total Non-Operating Expenses | 210,015 | |
| Net Income | (19,108) | |
| Annual Production in lbs | 96,000 |
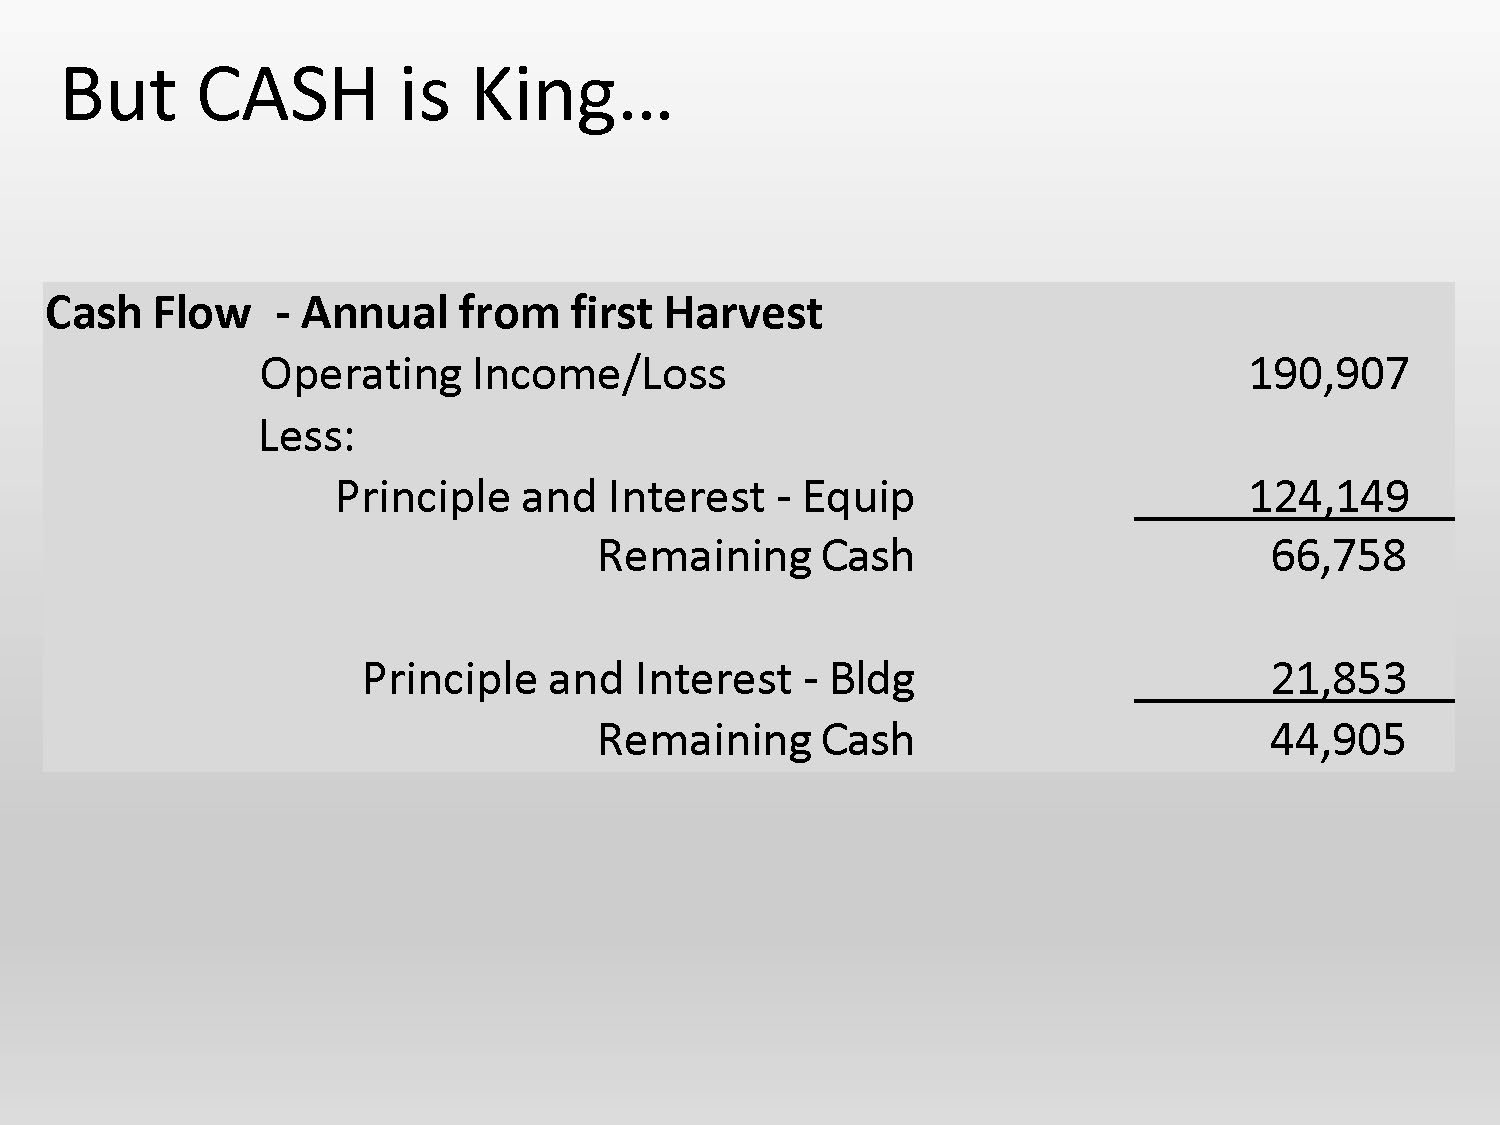
But CASH is King…
| Cash Flow - Annual from first Harvest | |
| Operating Income/Loss | 190,907 |
| Less: | |
| Principle and Interest - Equip | 124,149 |
| Remaining Cash | 66,758 |
| Principle and Interest - Bldg | 21,853 |
| Remaining Cash | 44,905 |
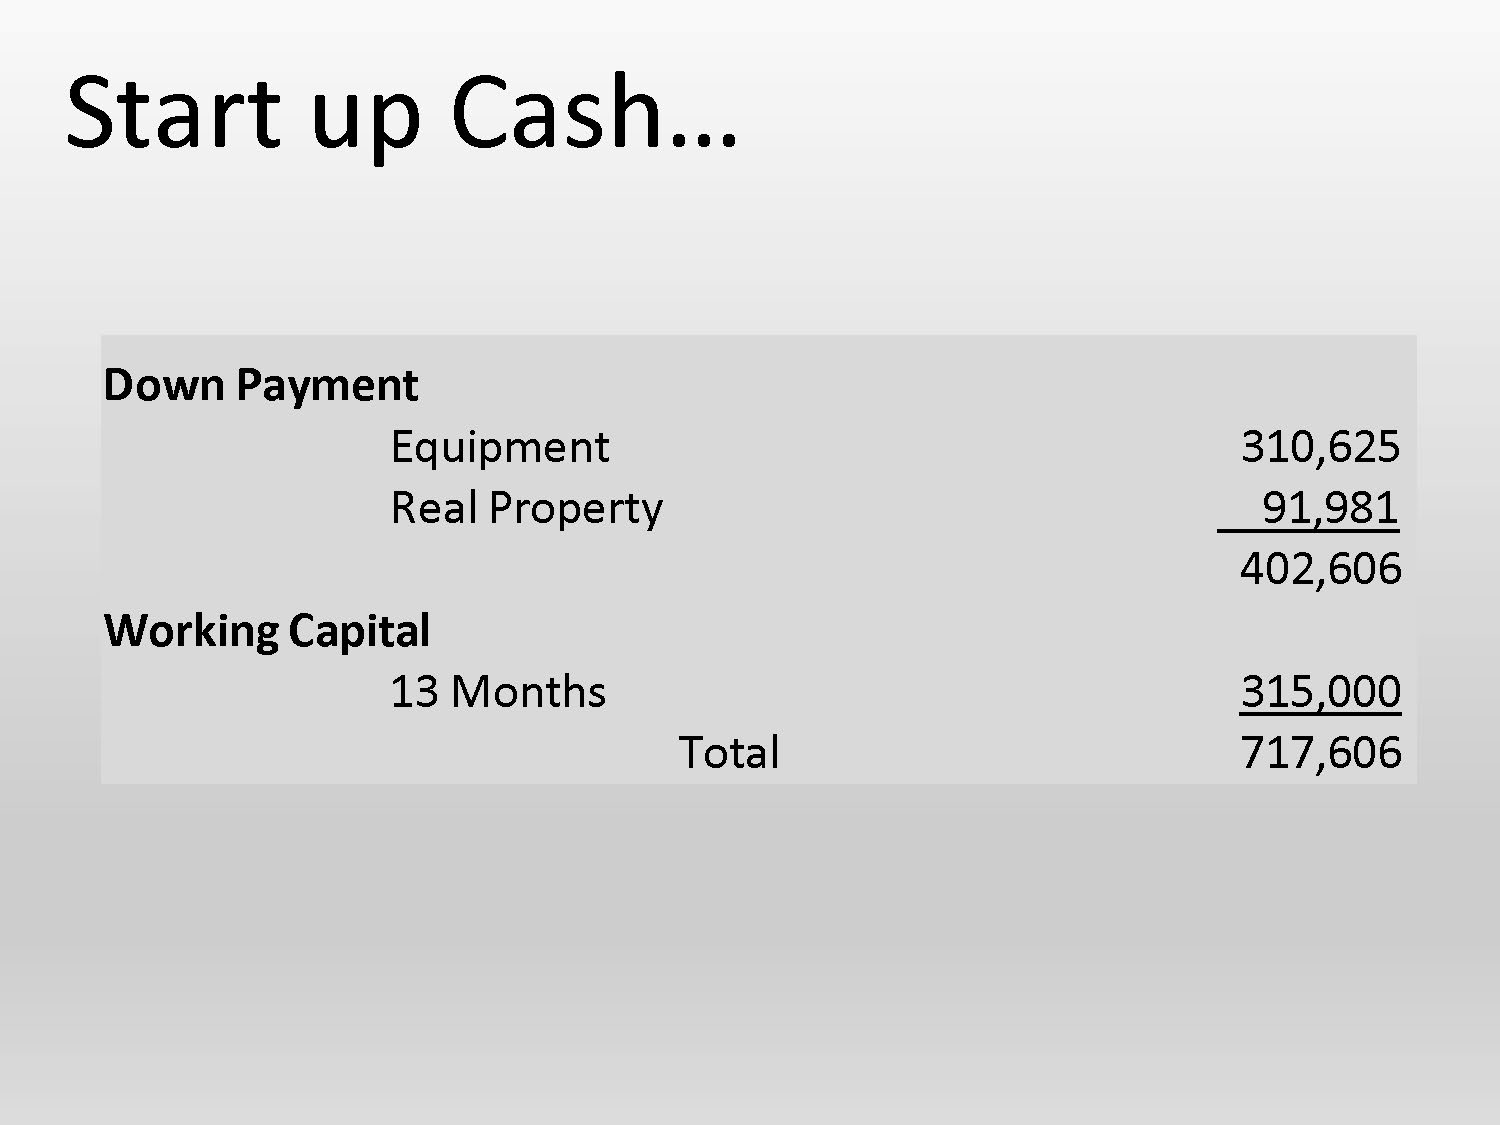
Start up Cash…
| Down Payment | |
| Equipment | 310,625 |
| Real Property | 91,981 |
| 402,606 | |
| Working Capital | |
| 13 Months | 315,000 |
| Total | 717,606 |
Conclusions – Small Scale
Producing Pompano Commercially in RAS has potential in a niche market if the sales price can be kept at $7 or above
Could broaden offerings to customers, if you currently have a direct market customer base for other species
Conclusions – Large Scale
Profitability on a large scale with wholesale prices at $5.25 would be difficult without significant savings in feed and equipment costs as well as improvements in survival rates and FCRs
We will look at some models which will demonstrate the challenges that remain for a large commercial venture using the results presented today

Data Modeling Using Excel
Final slide
End of presentation.
Go to top of page.