Feed Strategies and Growth Performance of Florida Pompano Reared in Commercial-scale Inland Recirculation Systems
Feed Strategies and Growth Performance of Florida Pompano Reared in Commercial-scale Inland Recirculation Systems
Nathan Brennan, Kevan Main, and Rob Reigh
Directorate of Fisheries and Aquaculture
Mote Marine Laboratory
Sarasota, Florida
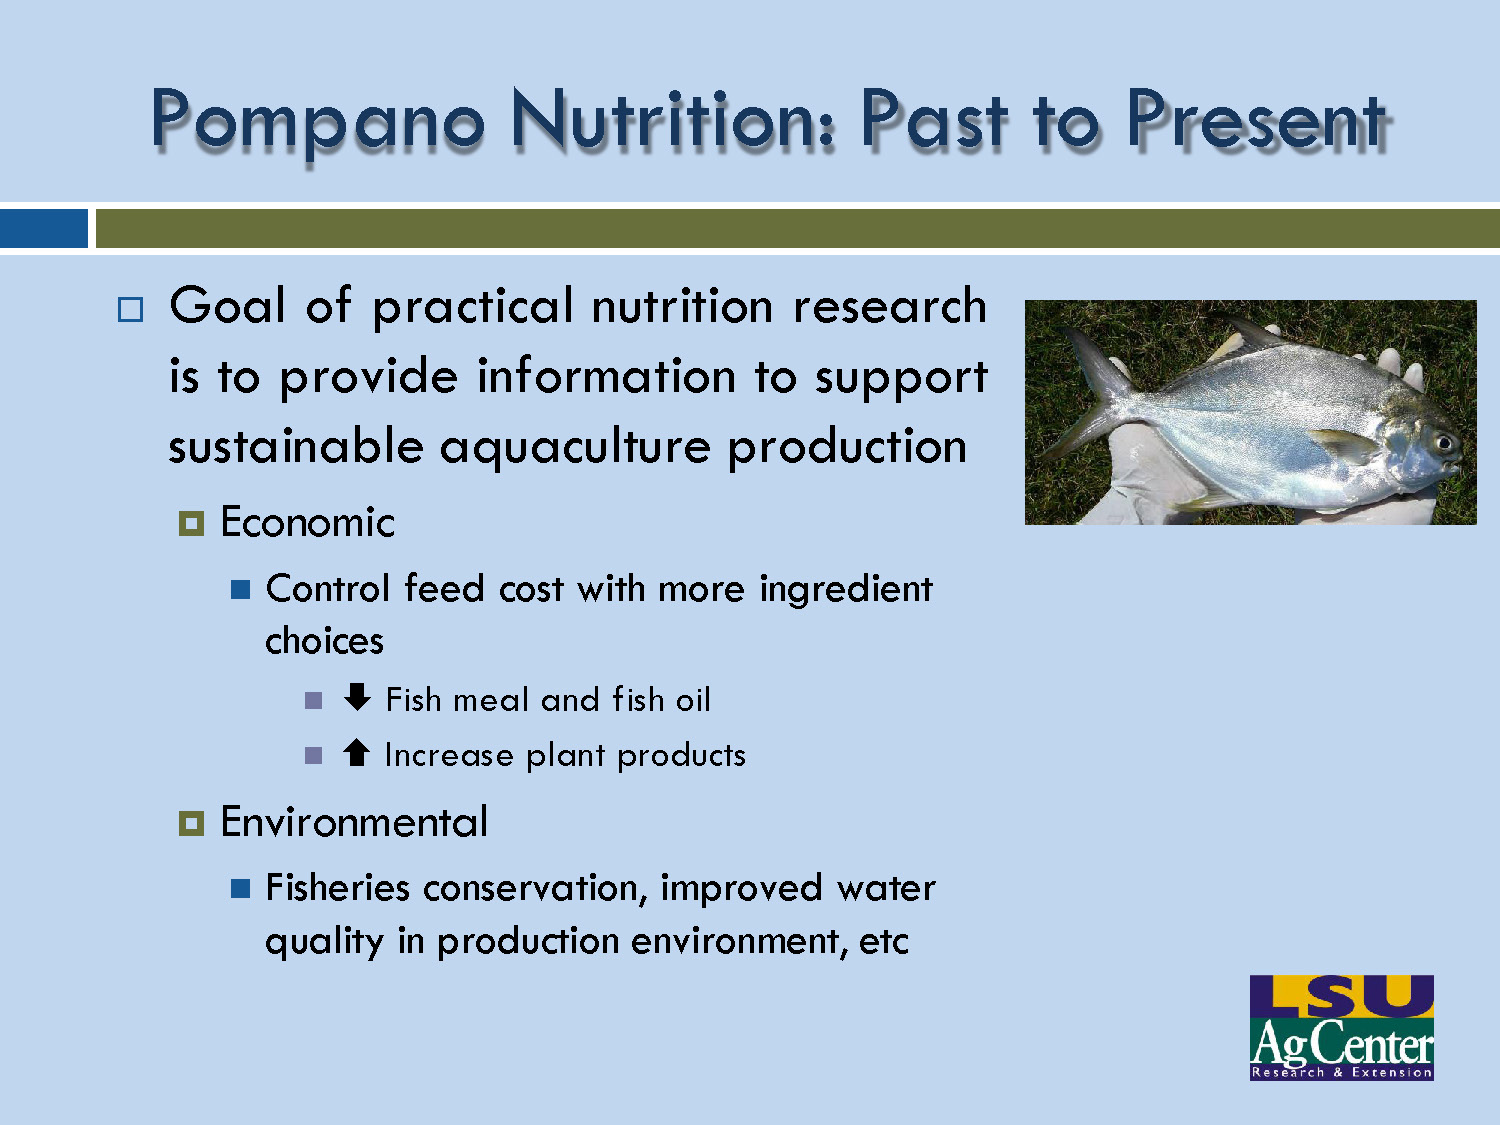
Pompano Nutrition: Past to Present
Goal of practical nutrition research is to provide information to support sustainable aquaculture production
Economic
- Control feed cost with more ingredient choices
- ⇩ Fish meal and fish oil
- ⇧ Increase plant products
Environmental
- Fisheries conservation, improved water quality in production environment, etc
Pompano Nutrition: Past to Present
Knowledge of nutritional needs of pompano can increase aquacultural success
- Eliminate over-fortification of diets
- Waste of resources, expensive
- Improve nutrient balance
- Better growth performance
- Decrease use of products from reduction fisheries
- Saves money, promotes eco-friendly image
- Lower production cost
- Maintain/improve profitability
Pompano Nutrition: Past to Present
- 1970: Need for a species-specific pompano diet identified
- Very little research followed
- Pompano fed ground fish, commercial by-catch, any commercial diet available
- Diets developed for other marine species also used for pompano
Knowledge of pompano husbandry grew during next 25 years but knowledge of nutritional needs improved little
Pompano Nutrition: Past to Present
More detailed studies of pompano nutrition conducted in several laboratories from late-1990s to present
- Alternative feedstuffs for low-fish meal diets
- Some nutritional requirements
- Availability of nutrients in common ingredients
Focus in these areas of interest likely to continue in near term
Background
Natural diet is animal based
- Pompano are selective grazers: opportunistic when small, more selective as they grow larger
- Food habits vary with abundance of local prey
- Young juveniles consume mostly planktonic organisms
- Copepods, amphipods, polychaetes, gastropod larvae, insects, etc
- Older juveniles and adults consume benthic organisms
- Clams and crustaceans, primarily
Background
Feeding / Digestive anatomy
- Rounded snout for digging in sandy substrate
- Pharyngeal teeth for breaking hard material
- Shells and exoskeletons of mollusks and crustaceans
- Pyloric ceca (11) increase digestive/absorptive surface area
- Short intestine (8/10 of body length)
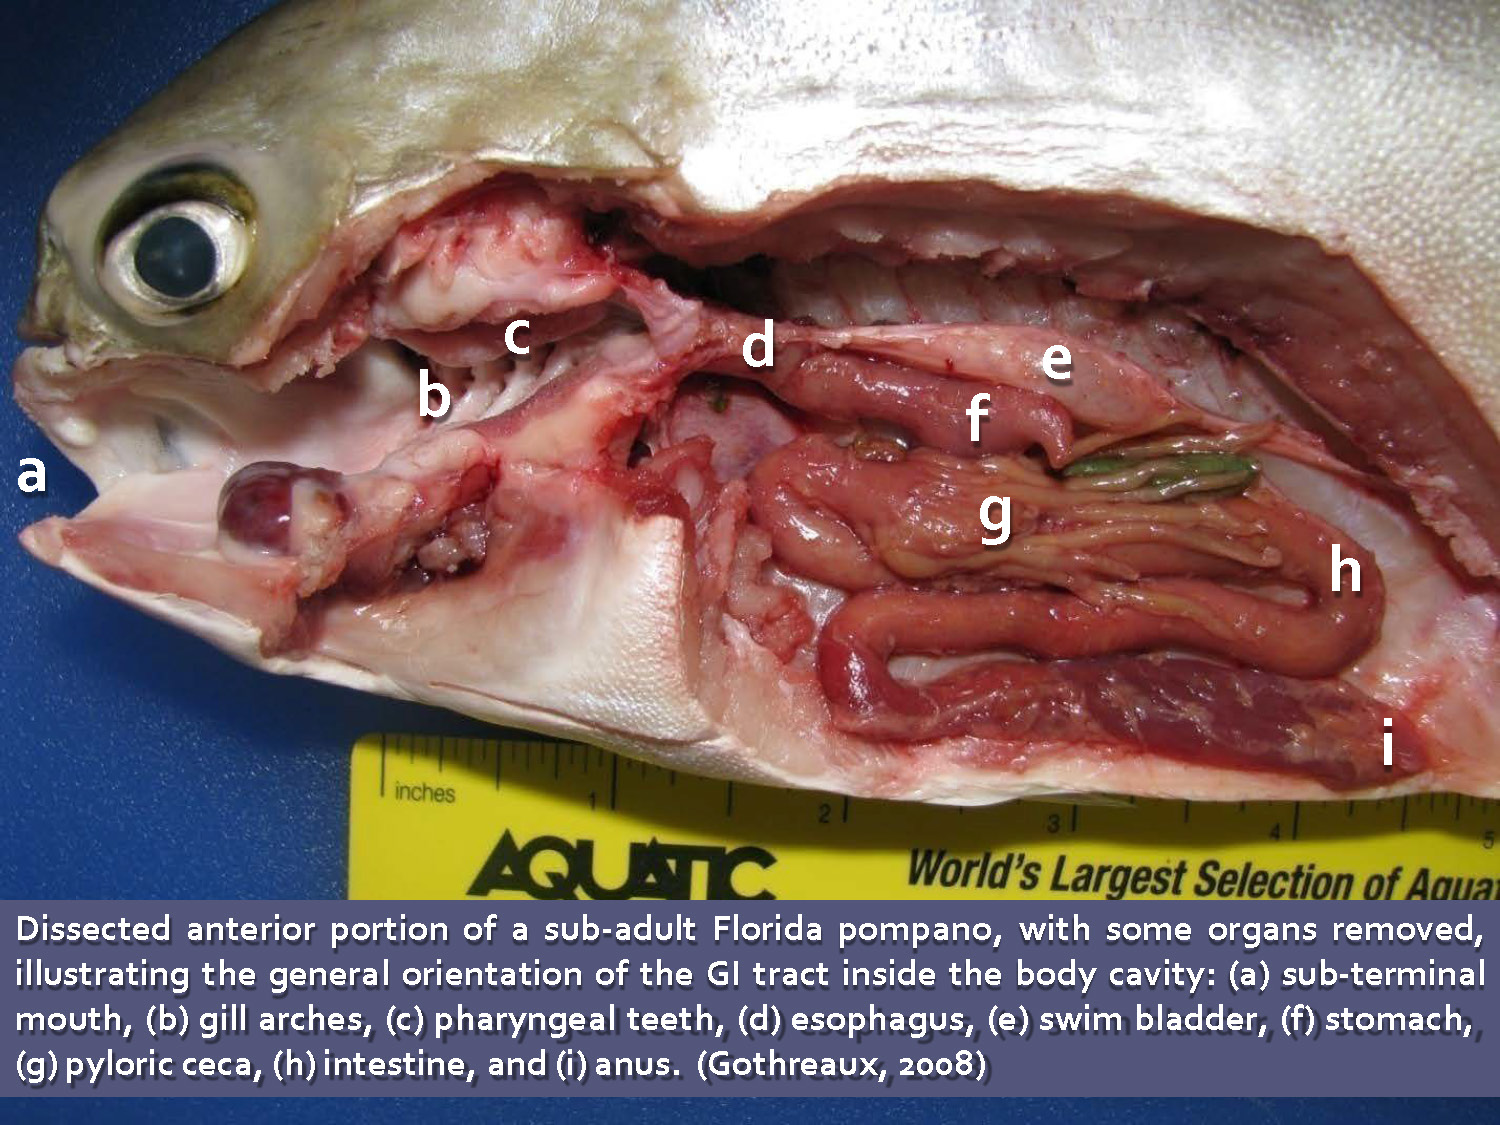
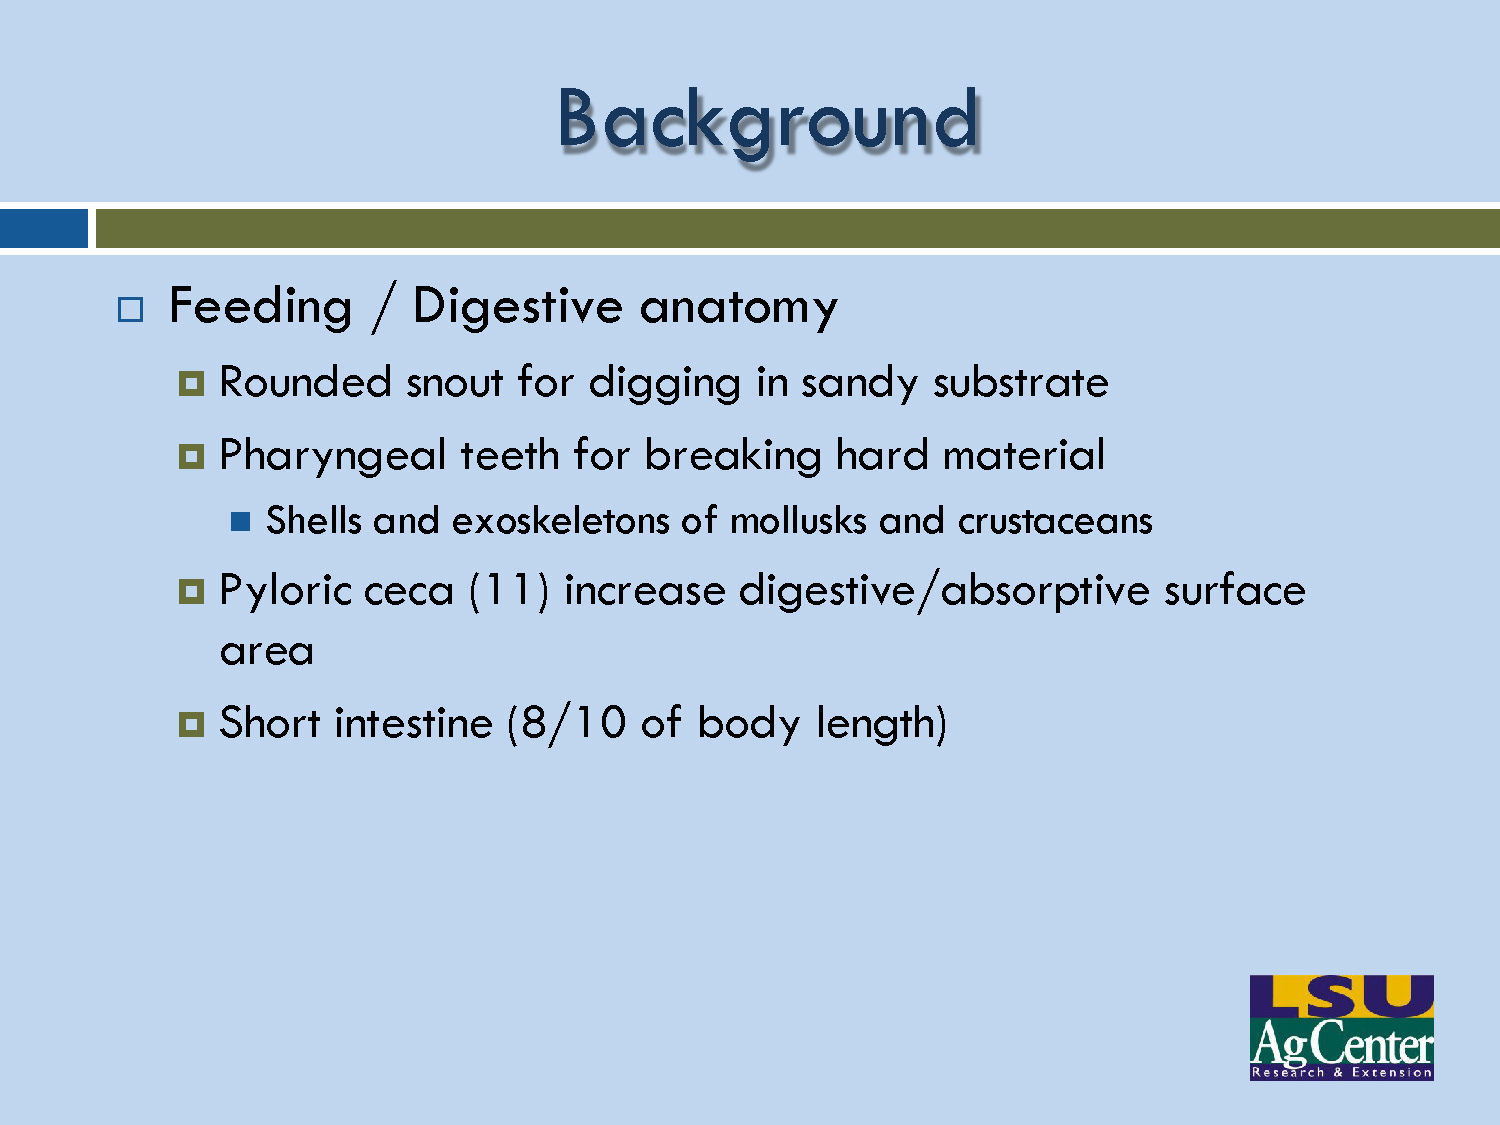
Dissected anterior portion of a sub-adult Florida pompano, with some organs removed, illustrating the general orientation of the GI tract inside the body cavity: (a) sub-terminal mouth, (b) gill arches, (c) pharyngeal teeth, (d) esophagus, (e) swim bladder, (f) stomach, (g) pyloric ceca, (h) intestine, and (i) anus. (Gothreaux, 2008)
The image shows labeled anatomical features marked with letters a through i, displaying the internal digestive system structure of the pompano.
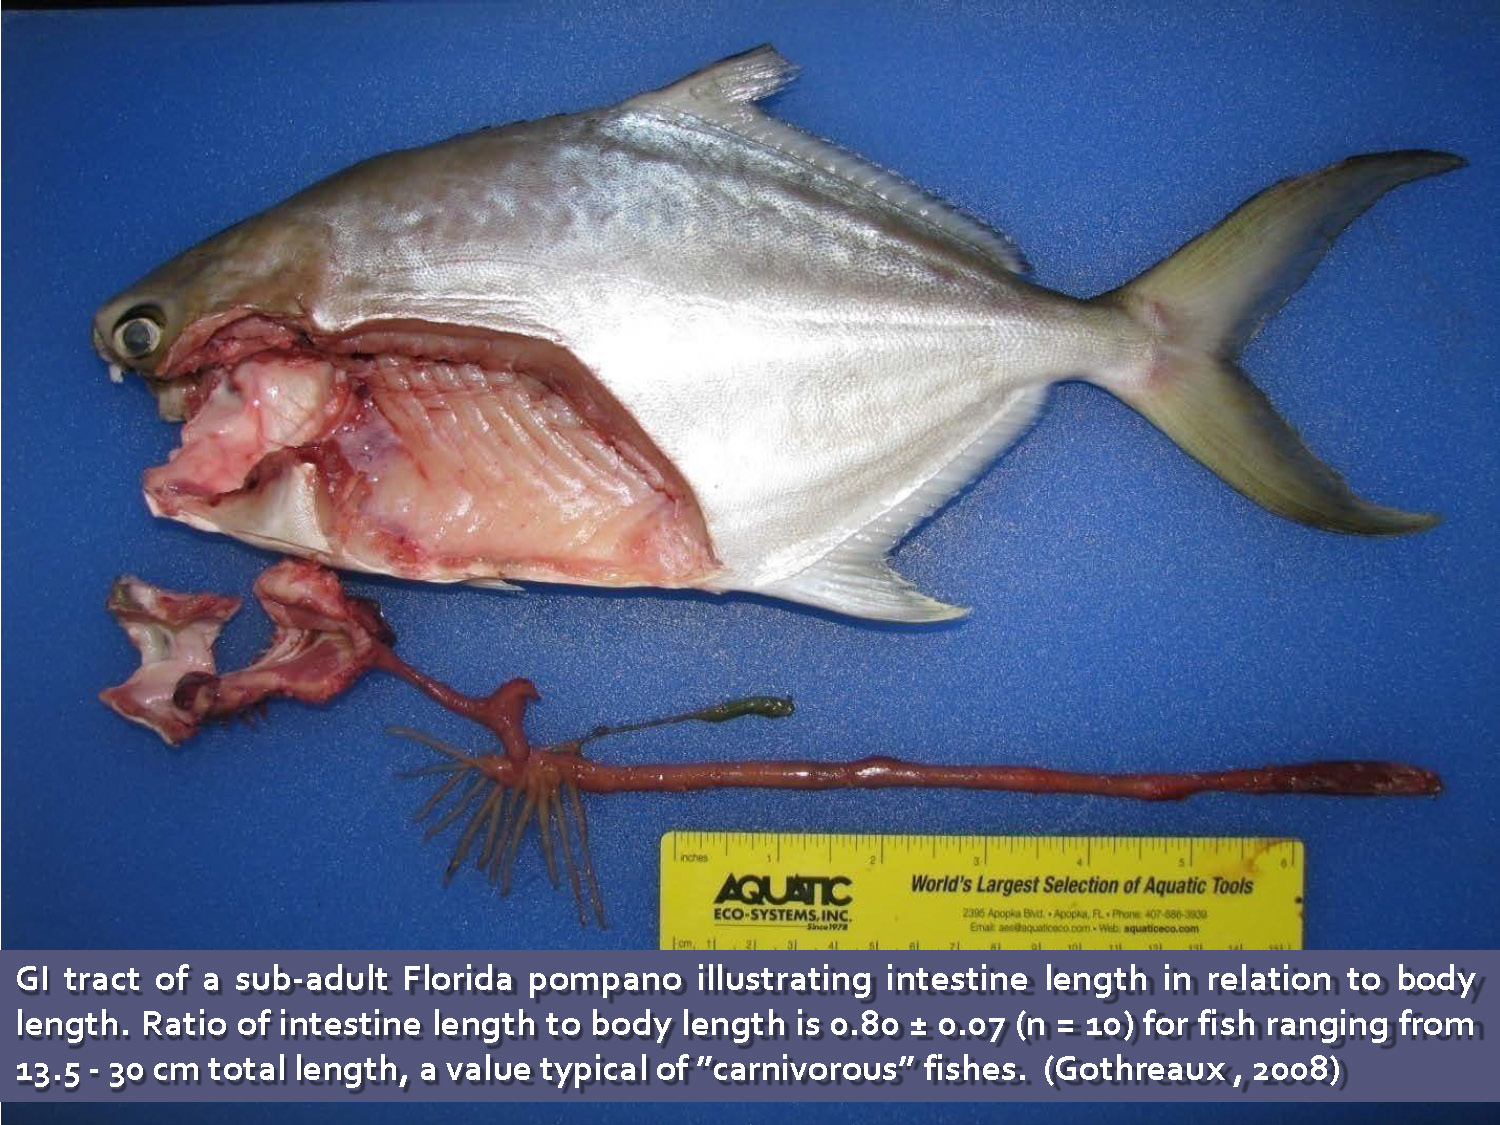
GI tract of a sub-adult Florida pompano illustrating intestine length in relation to body length. Ratio of intestine length to body length is 0.80 ± 0.07 (n = 10) for fish ranging from 13.5 - 30 cm total length, a value typical of "carnivorous" fishes. (Gothreaux, 2008)
The image shows a visual comparison of the pompano's body and its intestinal tract laid out to demonstrate relative proportions.
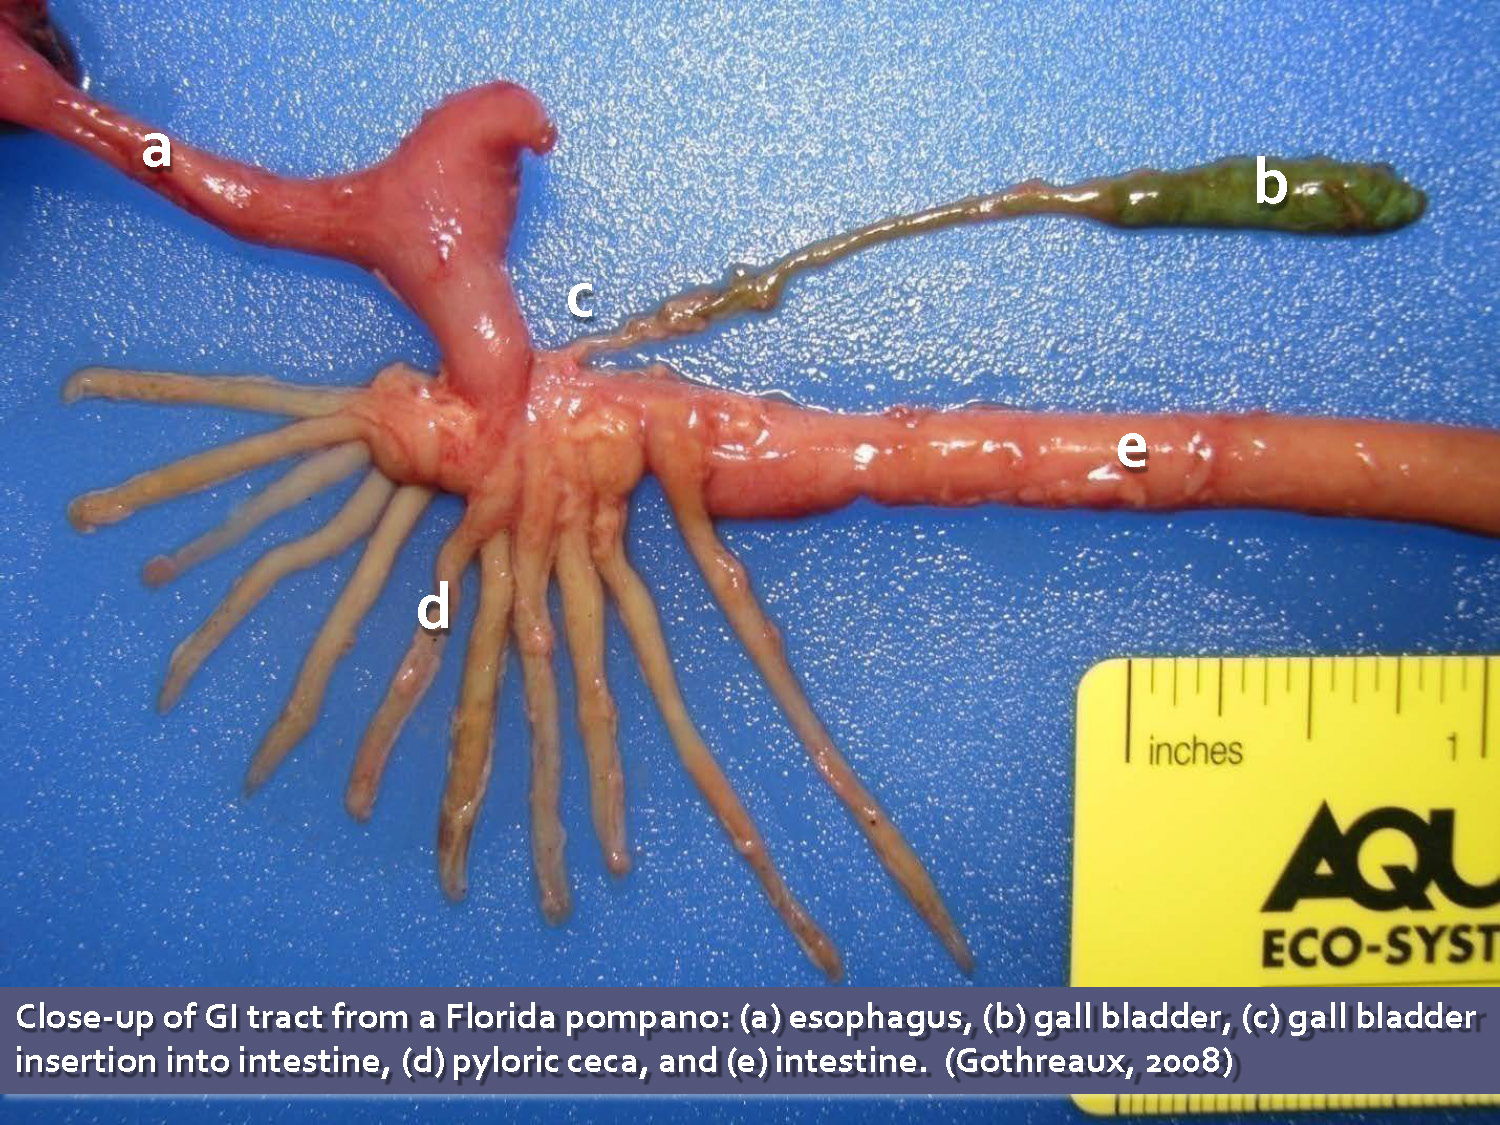
Close-up of GI tract from a Florida pompano: (a) esophagus, (b) gall bladder, (c) gall bladder insertion into intestine, (d) pyloric ceca, and (e) intestine. (Gothreaux, 2008)
The photograph shows detailed labeled views of the digestive organs with parts labeled a through e.
Background
Short GI tract produces short gut-retention time at optimal temperature (27-30 °C)
- Evacuation begins about 3 hours after feeding and proceeds quickly
- Research with Plata pompano, Trachinotus marginatus (Cunha et al., 2009) — range: southern Brazil to
northern Argentina
- Fed 59% protein diet at 24°C and 33 ppt salinity
- Oxygen consumption increased 34% within 30 min after feeding; returned to unfed rate in 2.5 hr suggesting digestion/assimilation completed in < 3 hr
Background
- To maximize growth, a compounded diet should be easily digested (within 3 hours) and contain highly available nutrients
- We need digestibility information for a selection of feed ingredients to reliably predict nutrient availability in a diet formulation
- Digestibility typically determined with feeding trials
- Digestible energy usually inversely related to fiber and carbohydrate content
- Protein digestibility may or may not be affected
Information Needed to Produce Good Diets
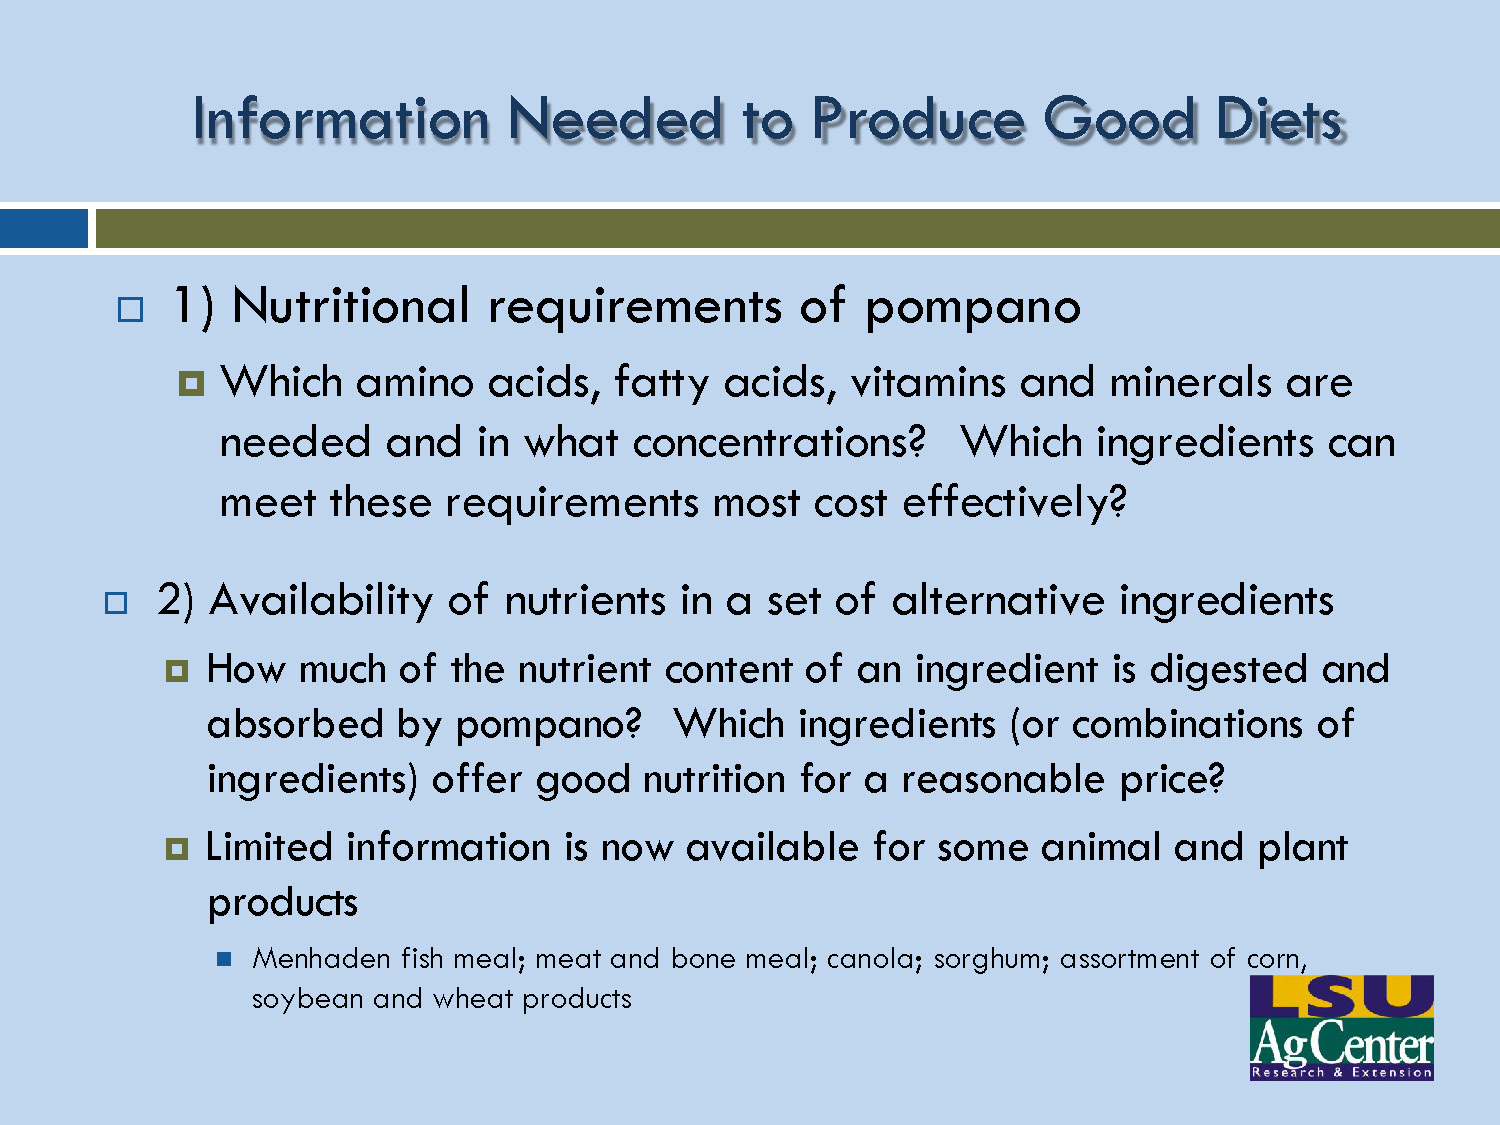
1) Nutritional requirements of pompano
- Which amino acids, fatty acids, vitamins and minerals are needed and in what concentrations? Which ingredients can meet these requirements most cost effectively?
2) Availability of nutrients in a set of alternative ingredients
- How much of the nutrient content of an ingredient is digested and absorbed by pompano? Which ingredients (or combinations of ingredients) offer good nutrition for a reasonable price?
- Limited information is now available for some animal and plant products
- Menhaden fish meal; meat and bone meal; canola; sorghum; assortment of corn, soybean and wheat products
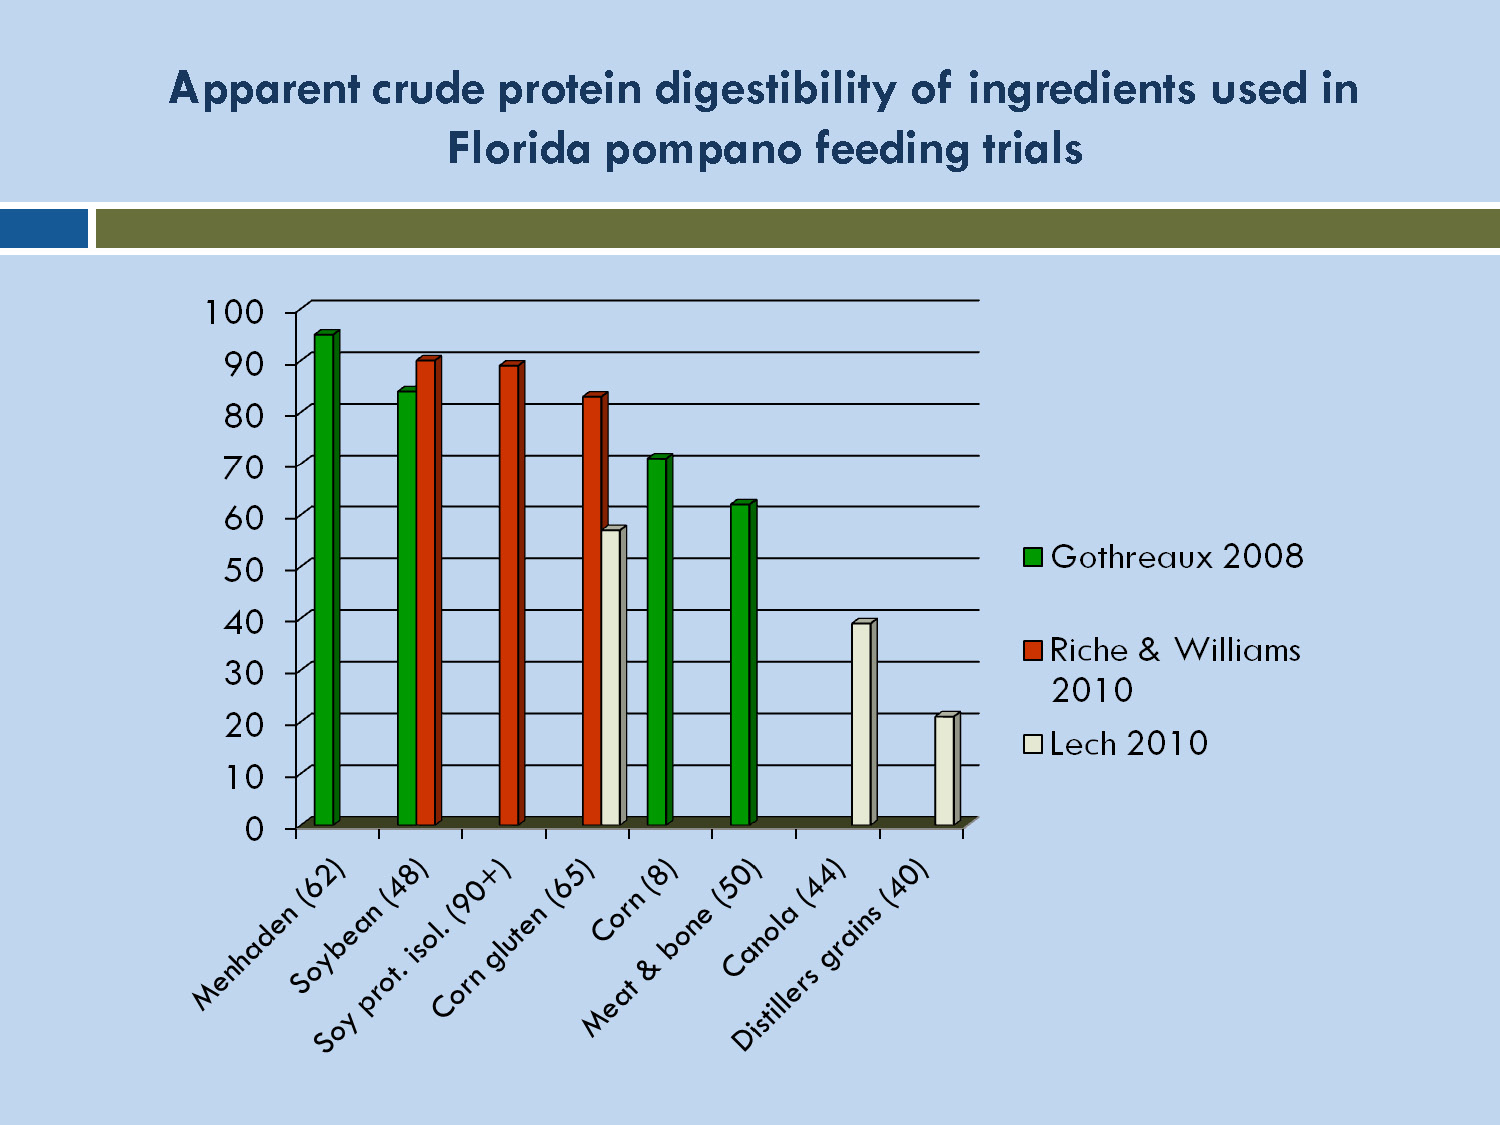
Apparent crude protein digestibility of ingredients used in Florida pompano feeding trials
This bar chart displays the digestibility percentages (ACPD %) for various feed ingredients. The data shows:
- Menhaden meal: approximately 85-90%
- Soybean meal: approximately 80-85%
- Meat and bone meal: approximately 70-75%
- Corn, grain: approximately 65-70%
- Corn gluten meal: approximately 70-75%
- Canola meal: approximately 60-65%
- Wheat middlings: approximately 50-55%
- Distillers dried grains: approximately 45-50%
The chart demonstrates that menhaden meal and soybean meal have the highest protein digestibility, while distillers dried grains have the lowest among the ingredients tested.
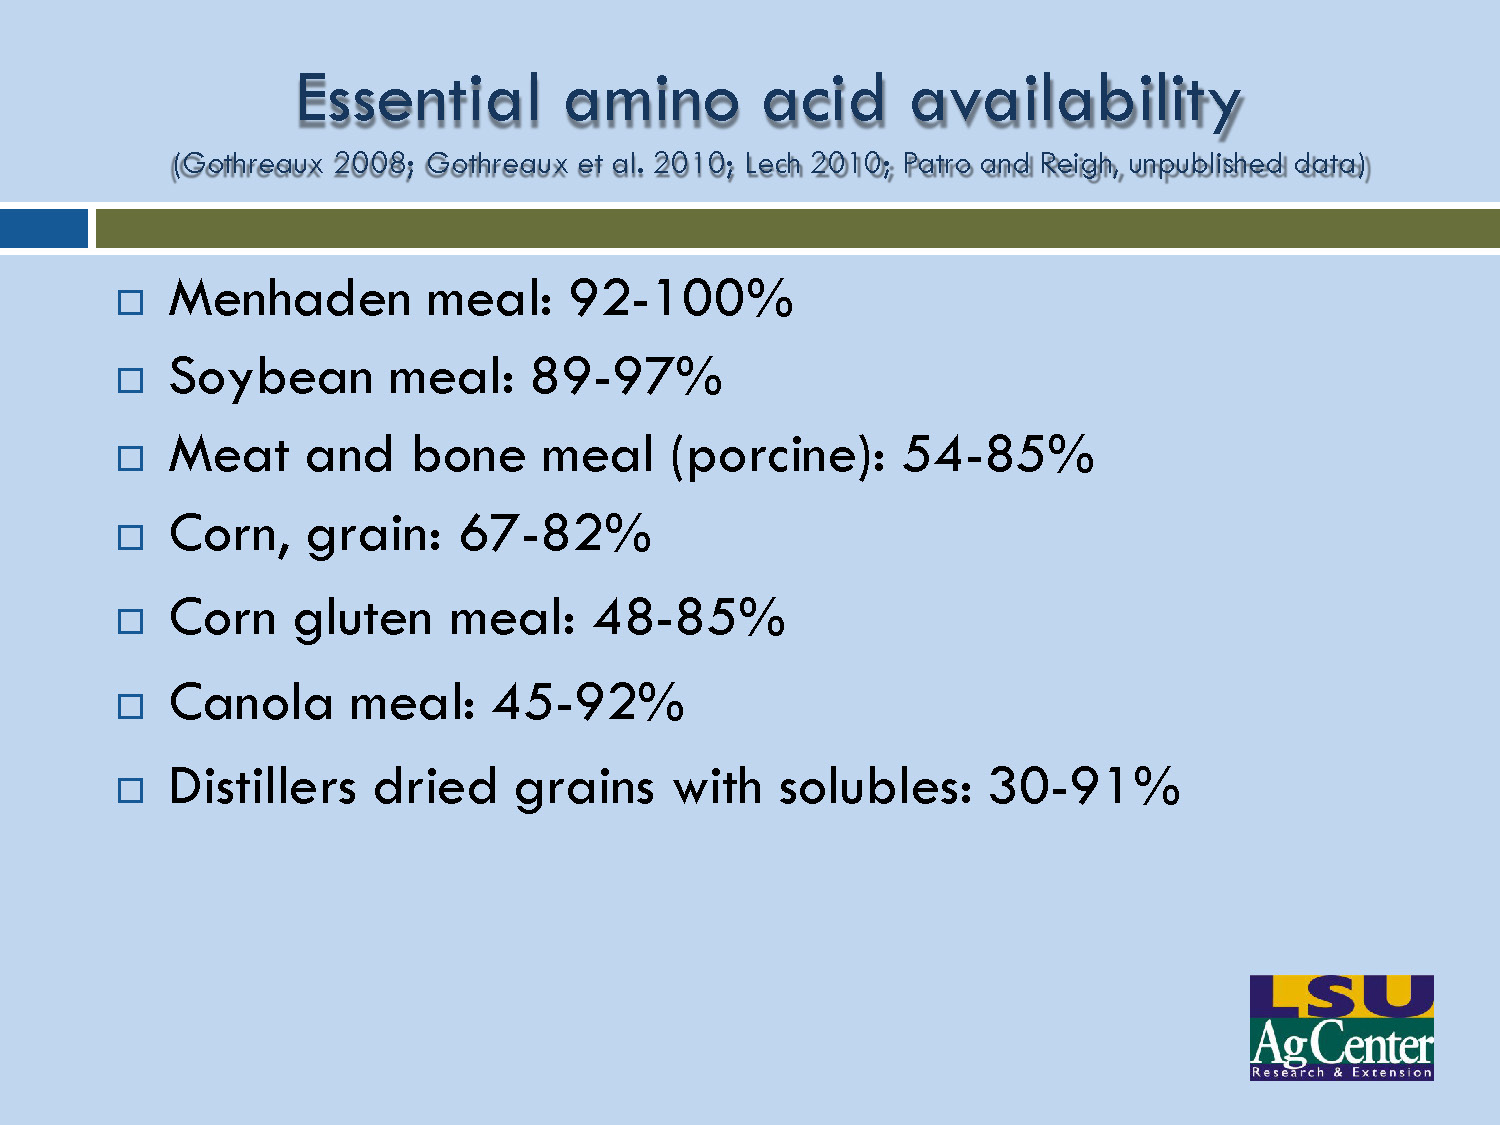
Essential amino acid availability
(Gothreaux 2008; Gothreaux et al. 2010; Lech 2010; Patro and Reigh, unpublished data)
- Menhaden meal: 92-100%
- Soybean meal: 89-97%
- Meat and bone meal (porcine): 54-85%
- Corn, grain: 67-82%
- Corn gluten meal: 48-85%
- Canola meal: 45-92%
- Distillers dried grains with solubles: 30-91%
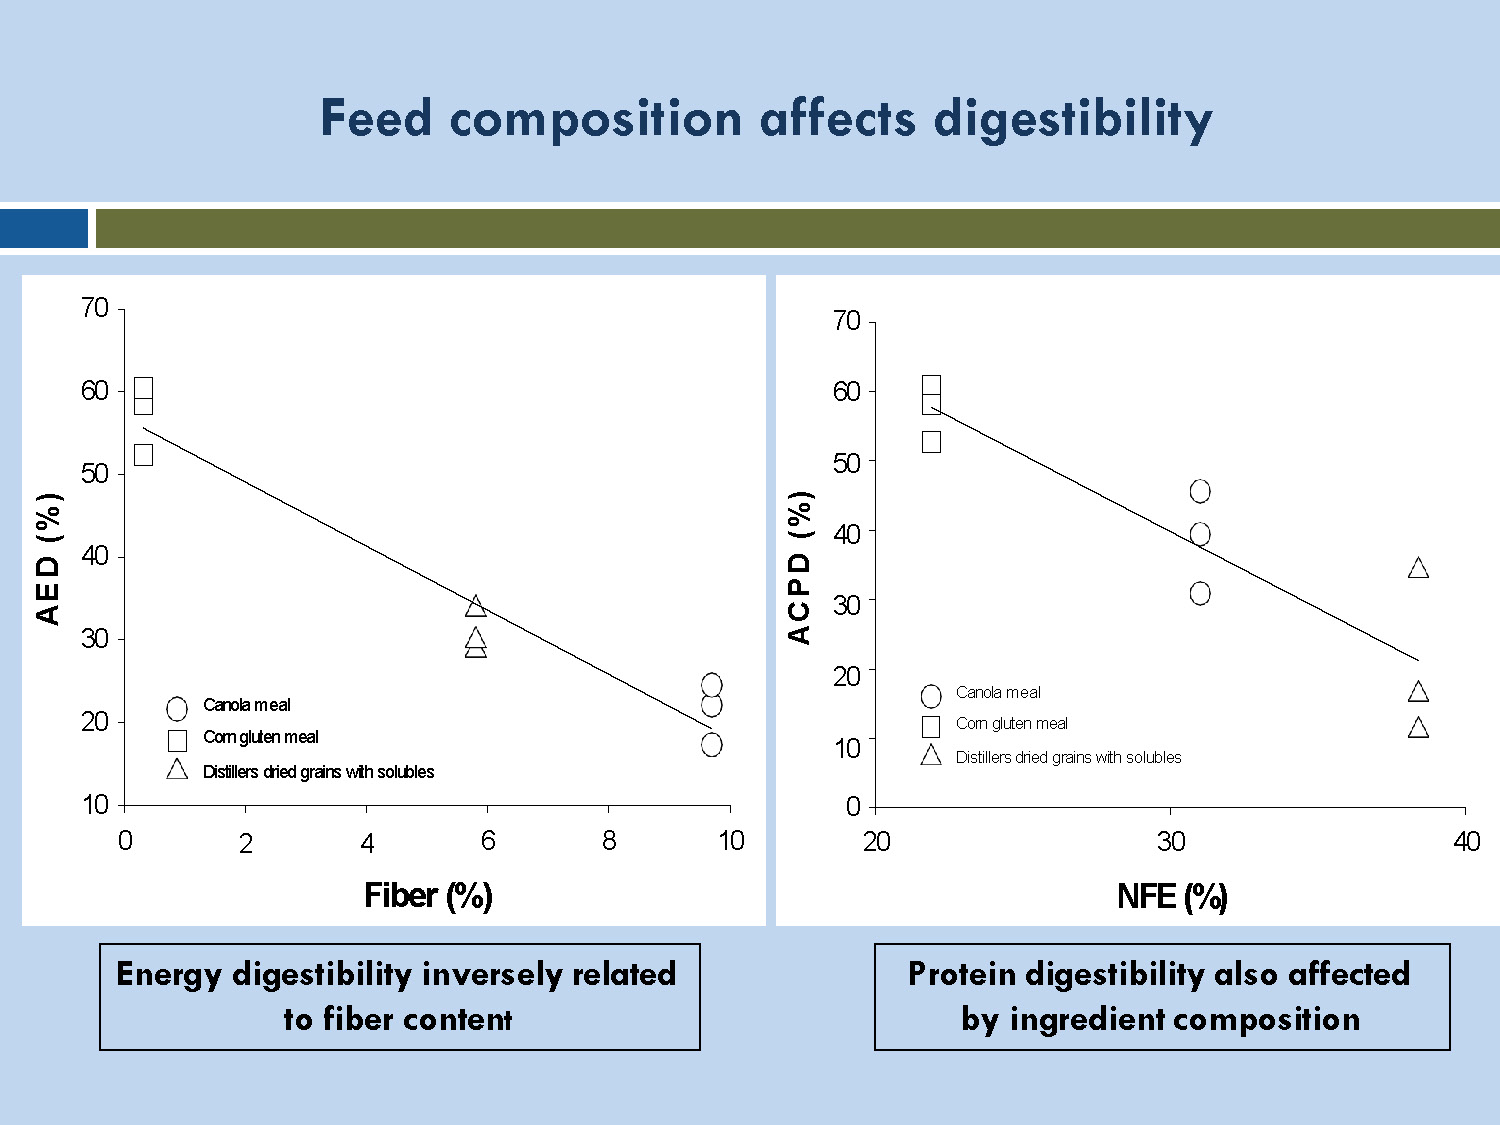
Feed composition affects digestibility
Two scatter plots are shown:
Left graph: Energy digestibility inversely related to fiber content
The x-axis shows Fiber (%) from 0 to 10, and the y-axis shows AED (%) from 10 to 70. Three ingredients are plotted:
- Canola meal: Shows a negative correlation, with digestibility decreasing as fiber increases
- Corn gluten meal: Displays moderate fiber content with corresponding digestibility values
- Distillers dried grains with solubles: Shows varying digestibility across different fiber levels
Right graph: Protein digestibility also affected by ingredient composition
The x-axis shows NFE (%) from 0 to 40, and the y-axis shows ACPD (%) from 0 to 70. The same three ingredients show:
- Canola meal: Varying protein digestibility across different NFE levels
- Corn gluten meal: Shows relationship between nitrogen-free extract and protein digestibility
- Distillers dried grains with solubles: Displays scattered data points showing variability
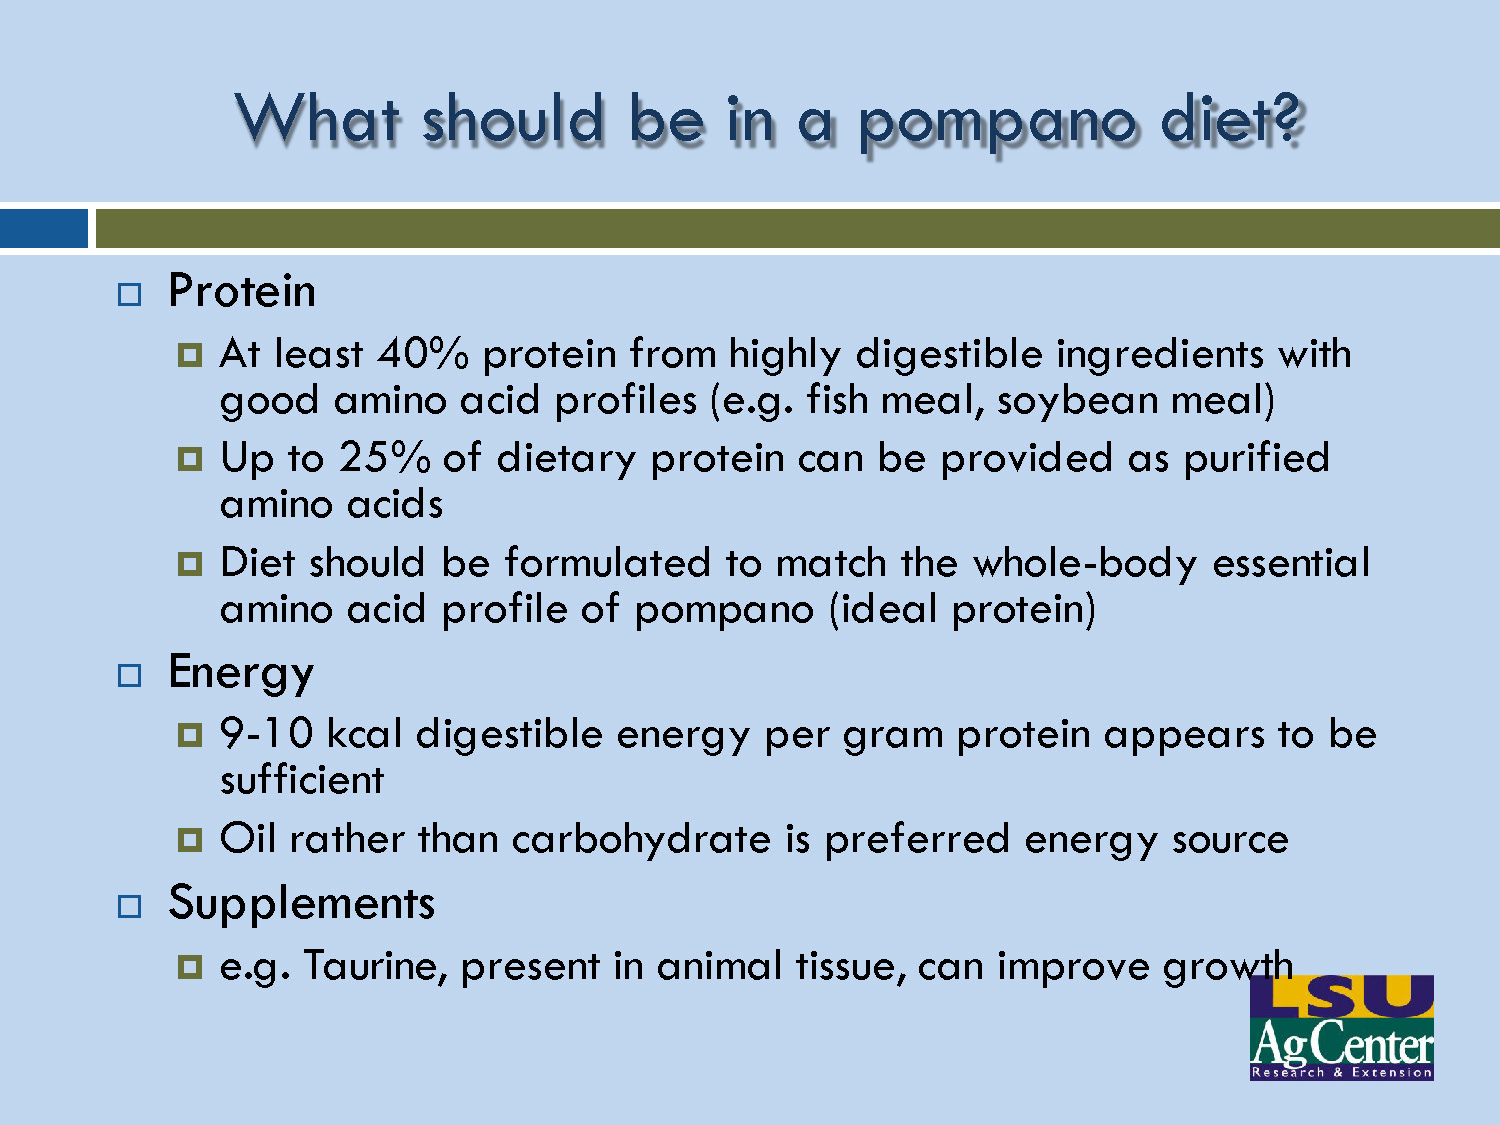
What should be in a pompano diet?
Protein
- At least 40% protein from highly digestible ingredients with good amino acid profiles (e.g. fish meal, soybean meal)
- Up to 25% of dietary protein can be provided as purified amino acids
- Diet should be formulated to match the whole-body essential amino acid profile of pompano (ideal protein)
Energy
- 9-10 kcal digestible energy per gram protein appears to be sufficient
- Oil rather than carbohydrate is preferred energy source
Supplements
- e.g. Taurine, present in animal tissue, can improve growth
Commercial Diets
- Some commercial diets now available are good
- High protein, high lipid diets can work well
- Probably nutritionally over-fortified
- More expensive than they need to be
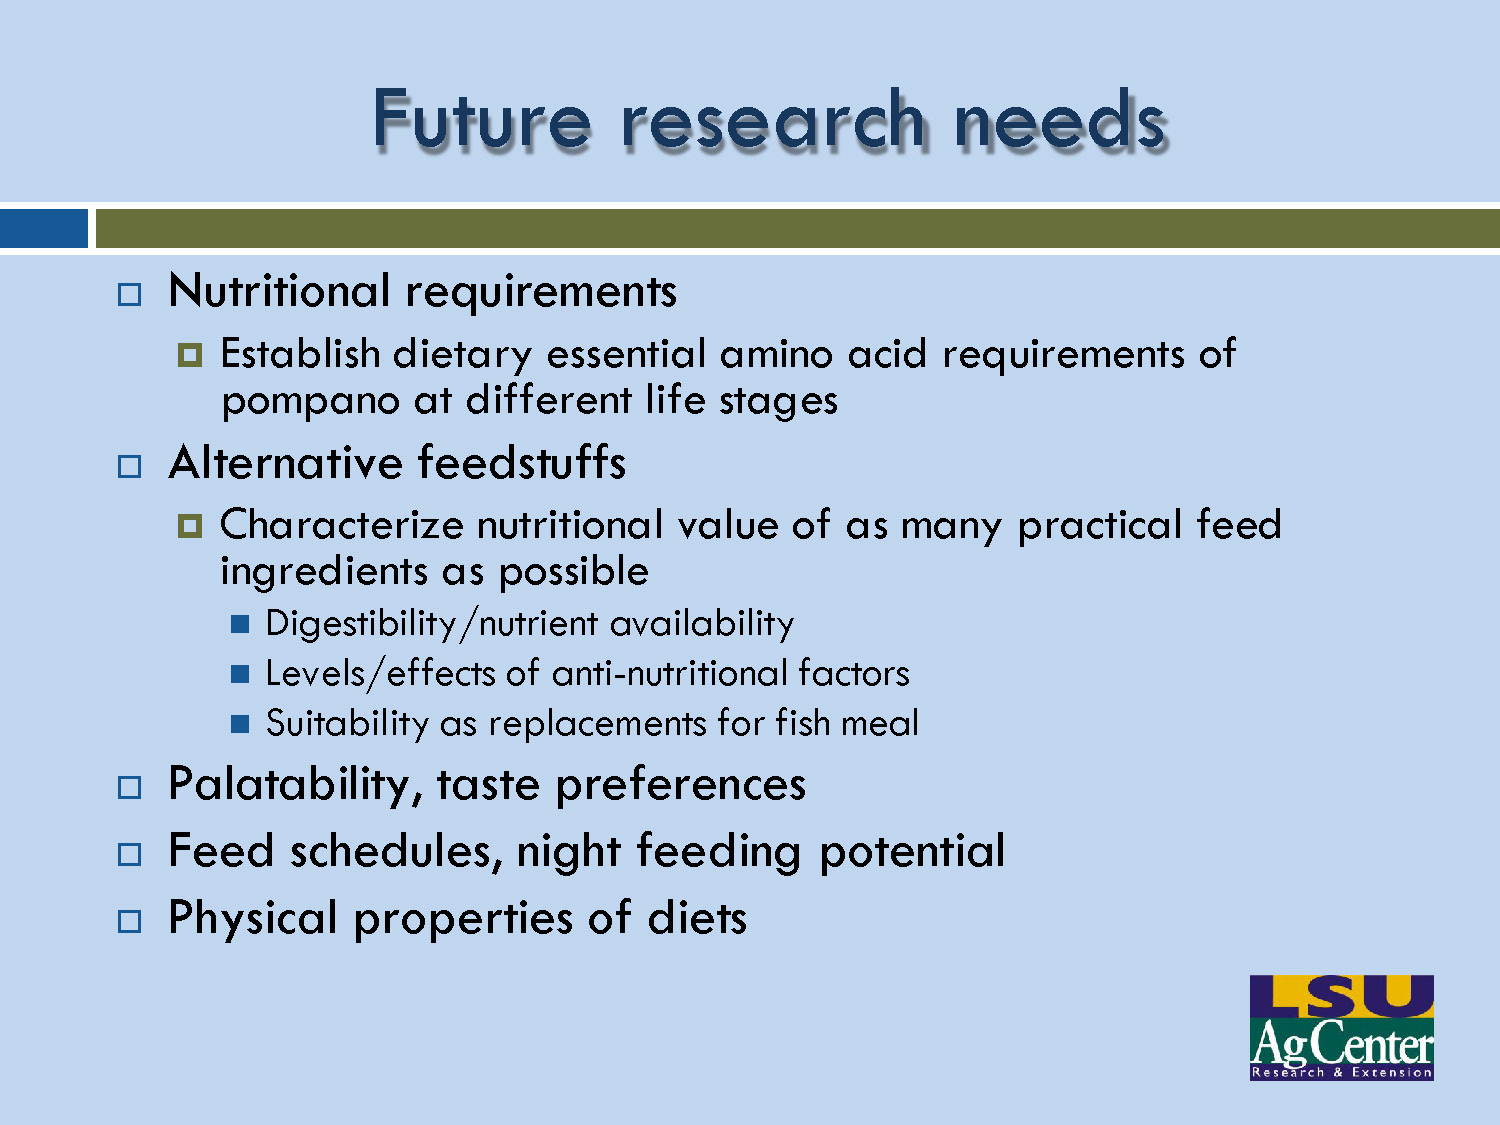
Future research needs
Nutritional requirements
- Establish dietary essential amino acid requirements of pompano at different life stages
Alternative feedstuffs
- Characterize nutritional value of as many practical feed ingredients as possible
- Digestibility/nutrient availability
- Levels/effects of anti-nutritional factors
- Suitability as replacements for fish meal
- Palatability, taste preferences
- Feed schedules, night feeding potential
- Physical properties of diets
Marine Research Team
Mote Marine Laboratory
Mote Aquaculture Research Park
- Dr. Kevan Main, Director
- Dr. Nate Brennan, UF
- Dr. Carlos Yanes, U. Stirling
- Michael Nystrom (MS, systems & fish production), Nicole Rhody (larval rearing, broodstock, Phd Student), Matt Resley (MS, broodstock), Carole Neidig (MS, fisheries and larval rearing), Paula Caldenty (Stock Enhancement, Phd Student)
- 12 student Interns: Clark Schnoover, Tim Mullin, Catie Orr, Jimmy Kilfoil, Phoebe Racine, Adam Collier, Duane Friedman, Sara Stevens, Nick Pearson, Andrew Angelos, Hayley Blumenthal, Drake Stevens
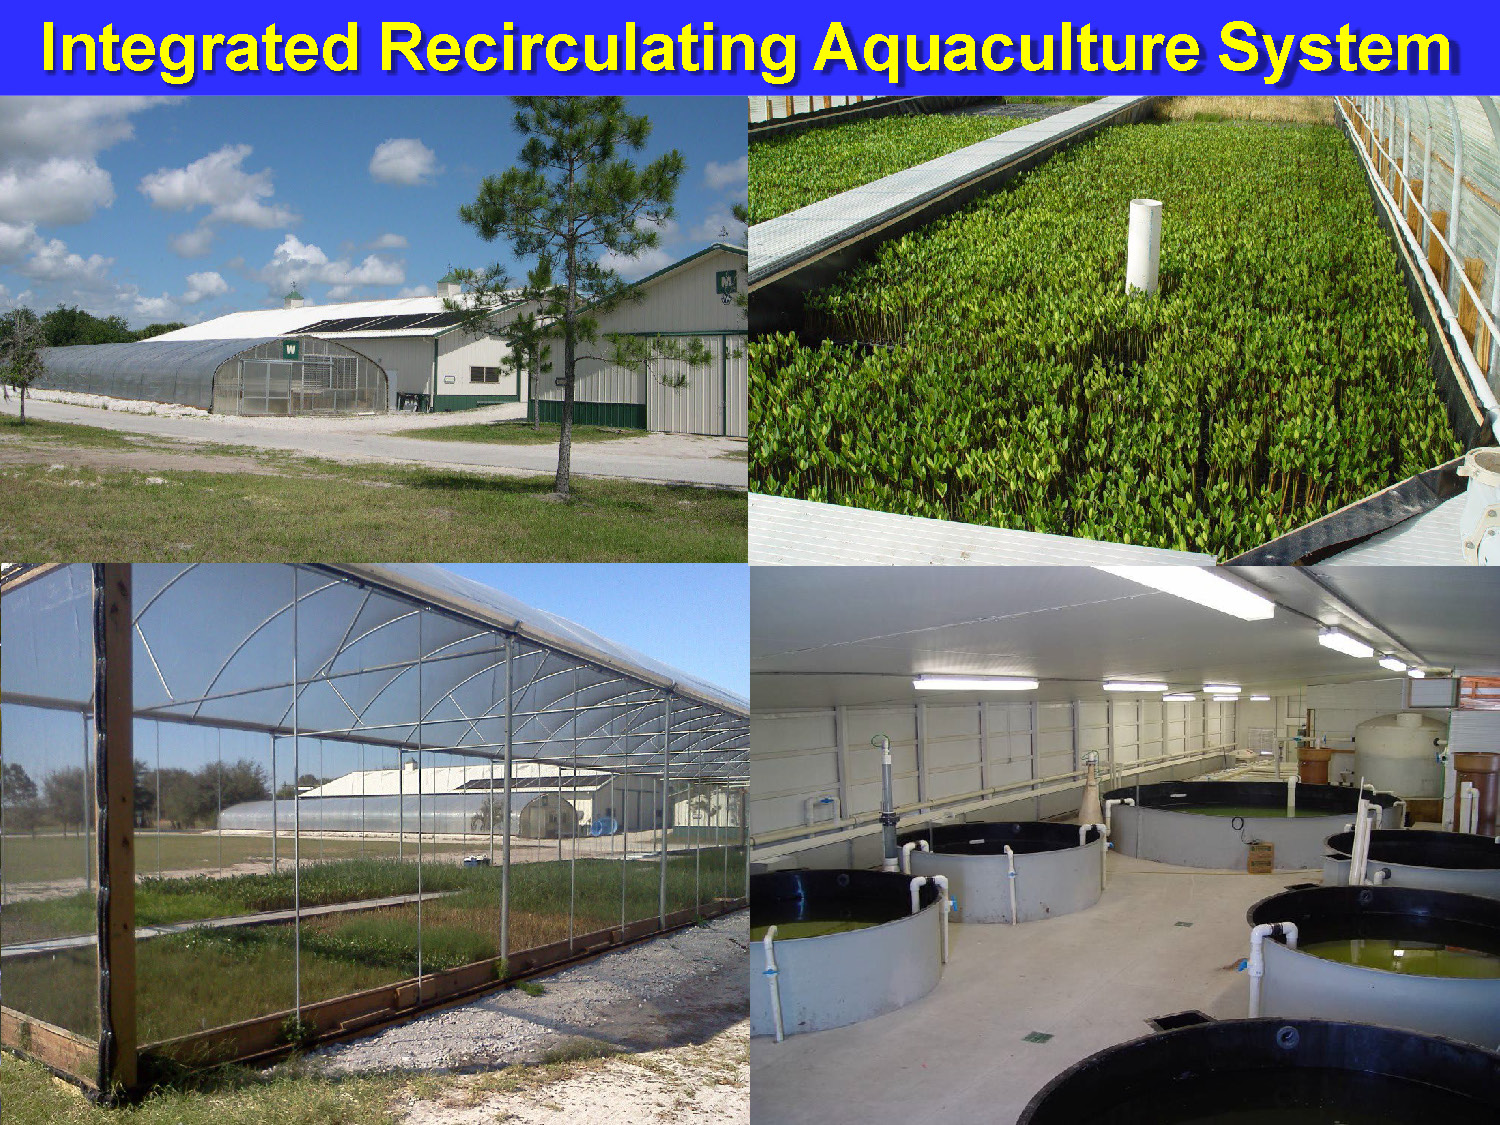
Integrated Recirculating Aquaculture System
The diagram shows a schematic layout of a recirculating aquaculture system with multiple culture tanks connected to filtration systems including biofilters, drum filters, and water treatment components. The system is designed to recycle and treat water for optimal fish production conditions.
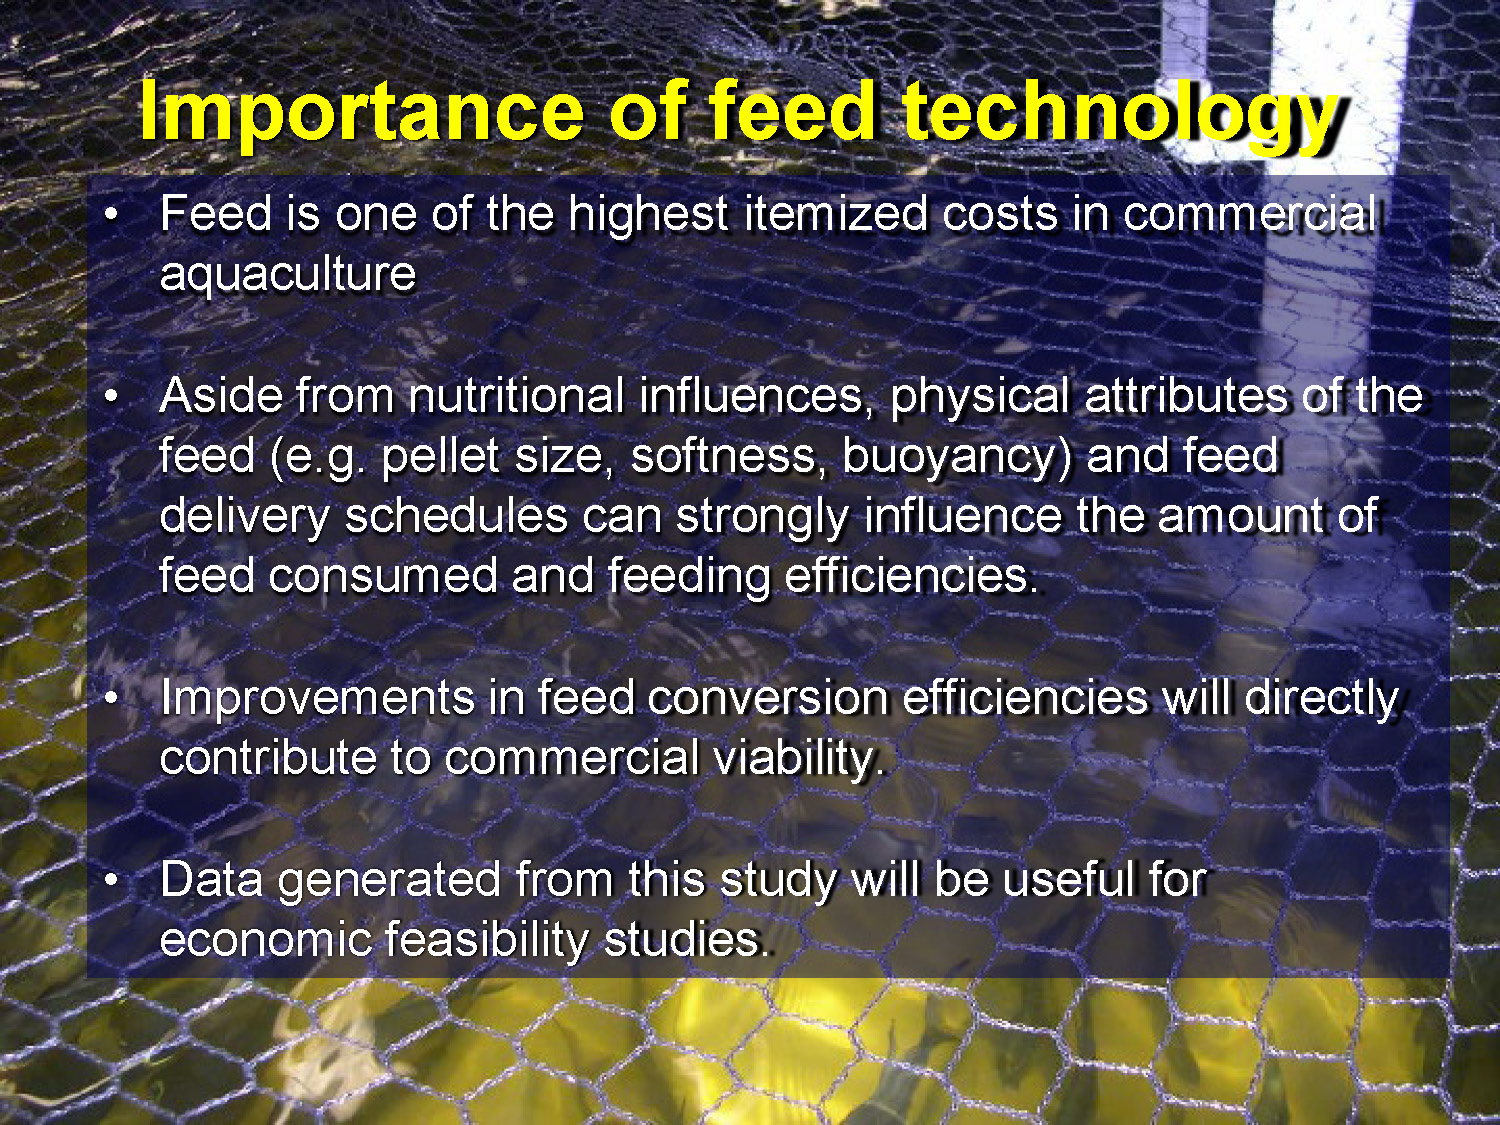
Importance of feed technology
- Feed is one of the highest itemized costs in commercial aquaculture
- Aside from nutritional influences, physical attributes of the feed (e.g. pellet size, softness, buoyancy) and feed delivery schedules can strongly influence the amount of feed consumed and feeding efficiencies.
- Improvements in feed conversion efficiencies will directly contribute to commercial viability.
- Data generated from this study will be useful for economic feasibility studies.
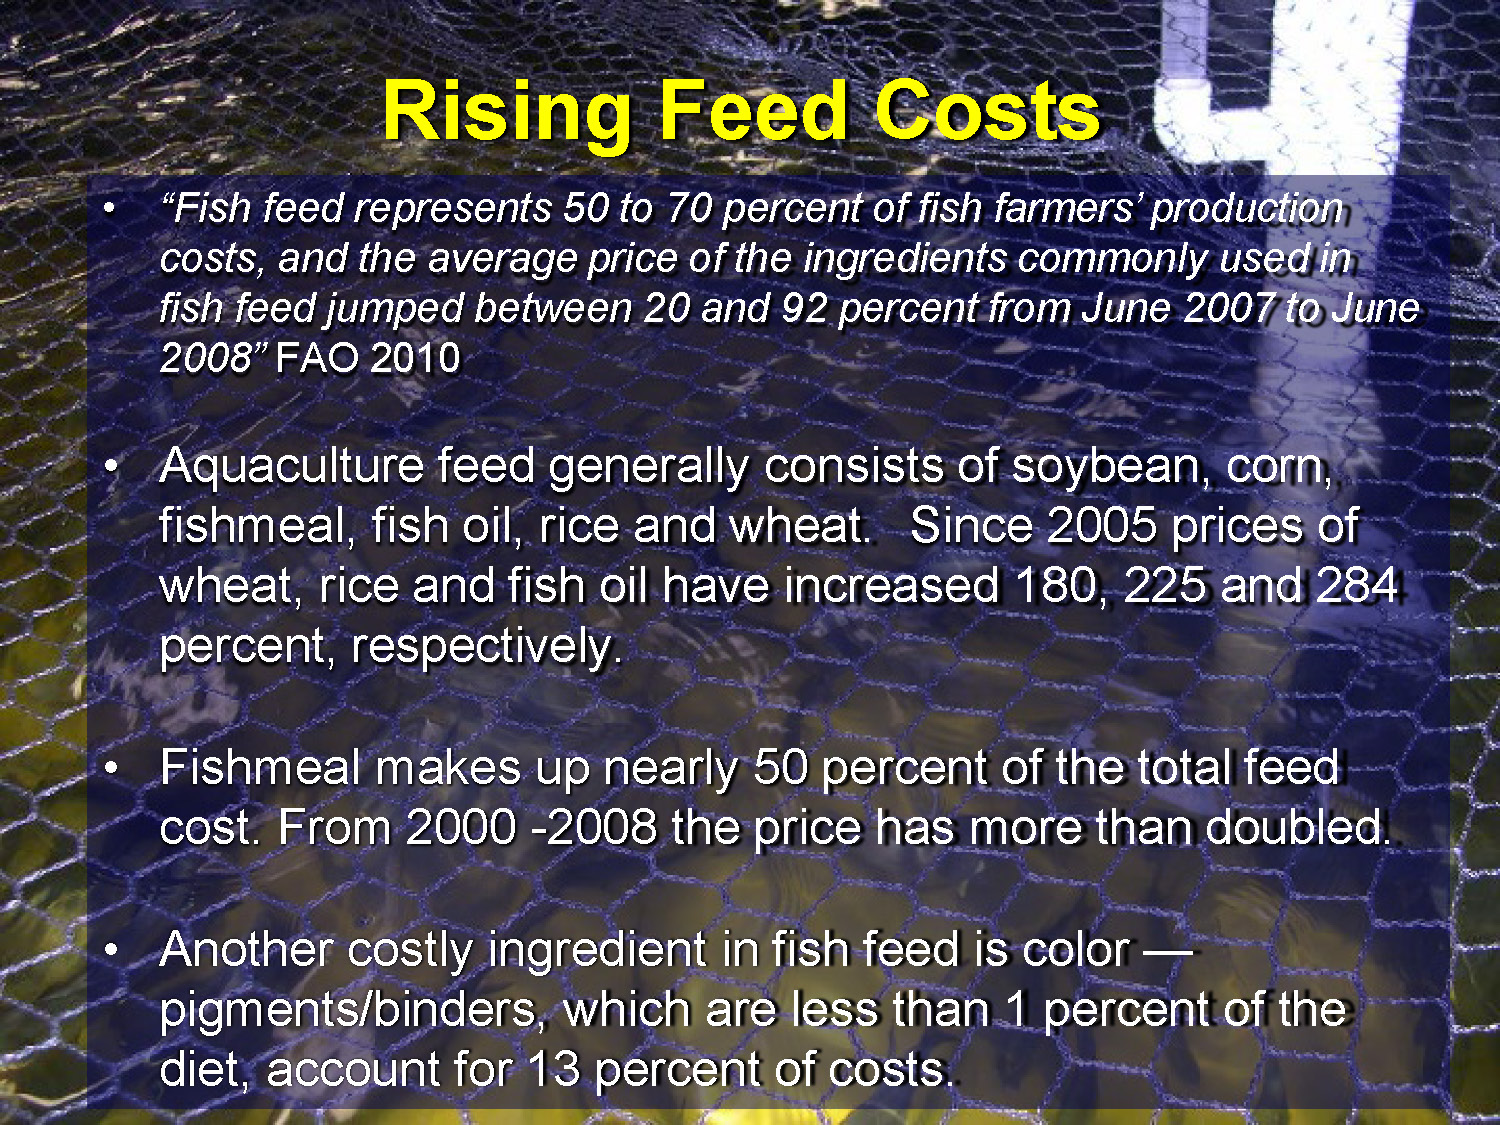
Rising Feed Costs
- "Fish feed represents 50 to 70 percent of fish farmers' production costs, and the average price of the ingredients commonly used in fish feed jumped between 20 and 92 percent from June 2007 to June 2008" FAO 2010
- Aquaculture feed generally consists of soybean, corn, fishmeal, fish oil, rice and wheat. Since 2005 prices of wheat, rice and fish oil have increased 180, 225 and 284 percent, respectively.
- Fishmeal makes up nearly 50 percent of the total feed cost. From 2000 -2008 the price has more than doubled.
- Another costly ingredient in fish feed is color — pigments/binders, which are less than 1 percent of the diet, account for 13 percent of costs.
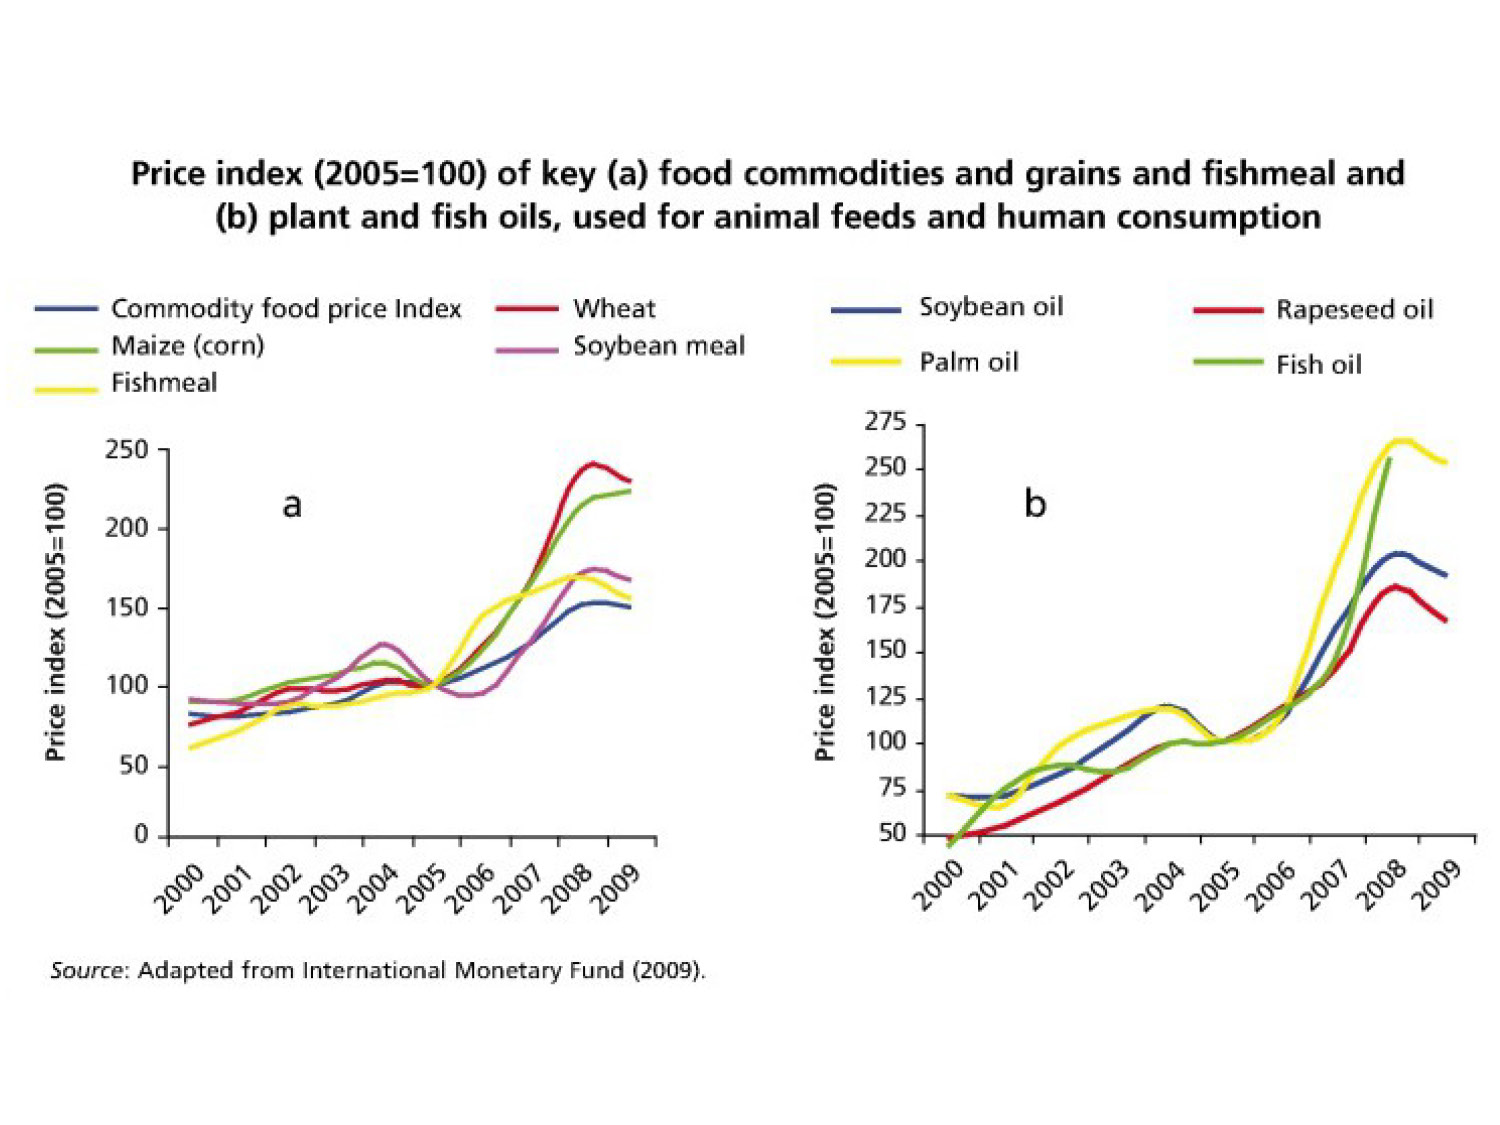
Price index (2005=100) of key (a) food commodities and grains and fishmeal and (b) plant and fish oils, used for animal feeds and human consumption
Chart (a): Food Commodities, Grains, and Fishmeal
Legend:
• Commodity food price Index (dark blue line)
• Wheat (red line)
• Maize (corn) (green line)
• Soybean meal (purple line)
• Fishmeal (yellow line)
Key Observations:
- 2000-2005: All commodities remained relatively stable, hovering around or slightly above the index value of 100. The commodity food price index, wheat, maize, and soybean meal tracked closely together during this period. Fishmeal started slightly lower, around 75.
- 2005-2007: A dramatic price surge began. All commodities showed upward trends, with prices beginning to diverge significantly.
-
2007-2008 Peak: Prices reached their highest points:
- Wheat peaked highest at approximately 245 (index value)
- Maize reached approximately 225
- Fishmeal climbed to around 170
- Soybean meal reached approximately 170
- Commodity food price index peaked at about 155
- 2008-2009: All commodities showed a decline from their peak values, though they remained elevated compared to the early 2000s baseline.
Chart (b): Plant and Fish Oils
Legend:
• Soybean oil (dark blue line)
• Rapeseed oil (red line)
• Palm oil (yellow line)
• Fish oil (green line)
Key Observations:
-
2000-2002: Oils showed varied starting positions:
- Soybean oil began around 75
- Palm oil started near 60
- Rapeseed oil started lowest at approximately 50
- Fish oil began around 70
- 2002-2004: A moderate price increase occurred, with palm oil and soybean oil showing the most notable gains, reaching peaks around 115-120.
- 2004-2006: Prices stabilized and even declined slightly, hovering around the 100 index baseline.
-
2007-2008 Dramatic Surge: An explosive price increase occurred:
- Palm oil surged most dramatically, peaking at approximately 265
- Fish oil reached nearly 260
- Soybean oil climbed to about 200
- Rapeseed oil increased to approximately 185
- 2008-2009 Decline: All oils experienced significant price drops from their peaks but remained well above their early 2000s levels. Palm oil showed the steepest decline, while fish oil maintained relatively higher levels.
Source: Adapted from International Monetary Fund (2009).
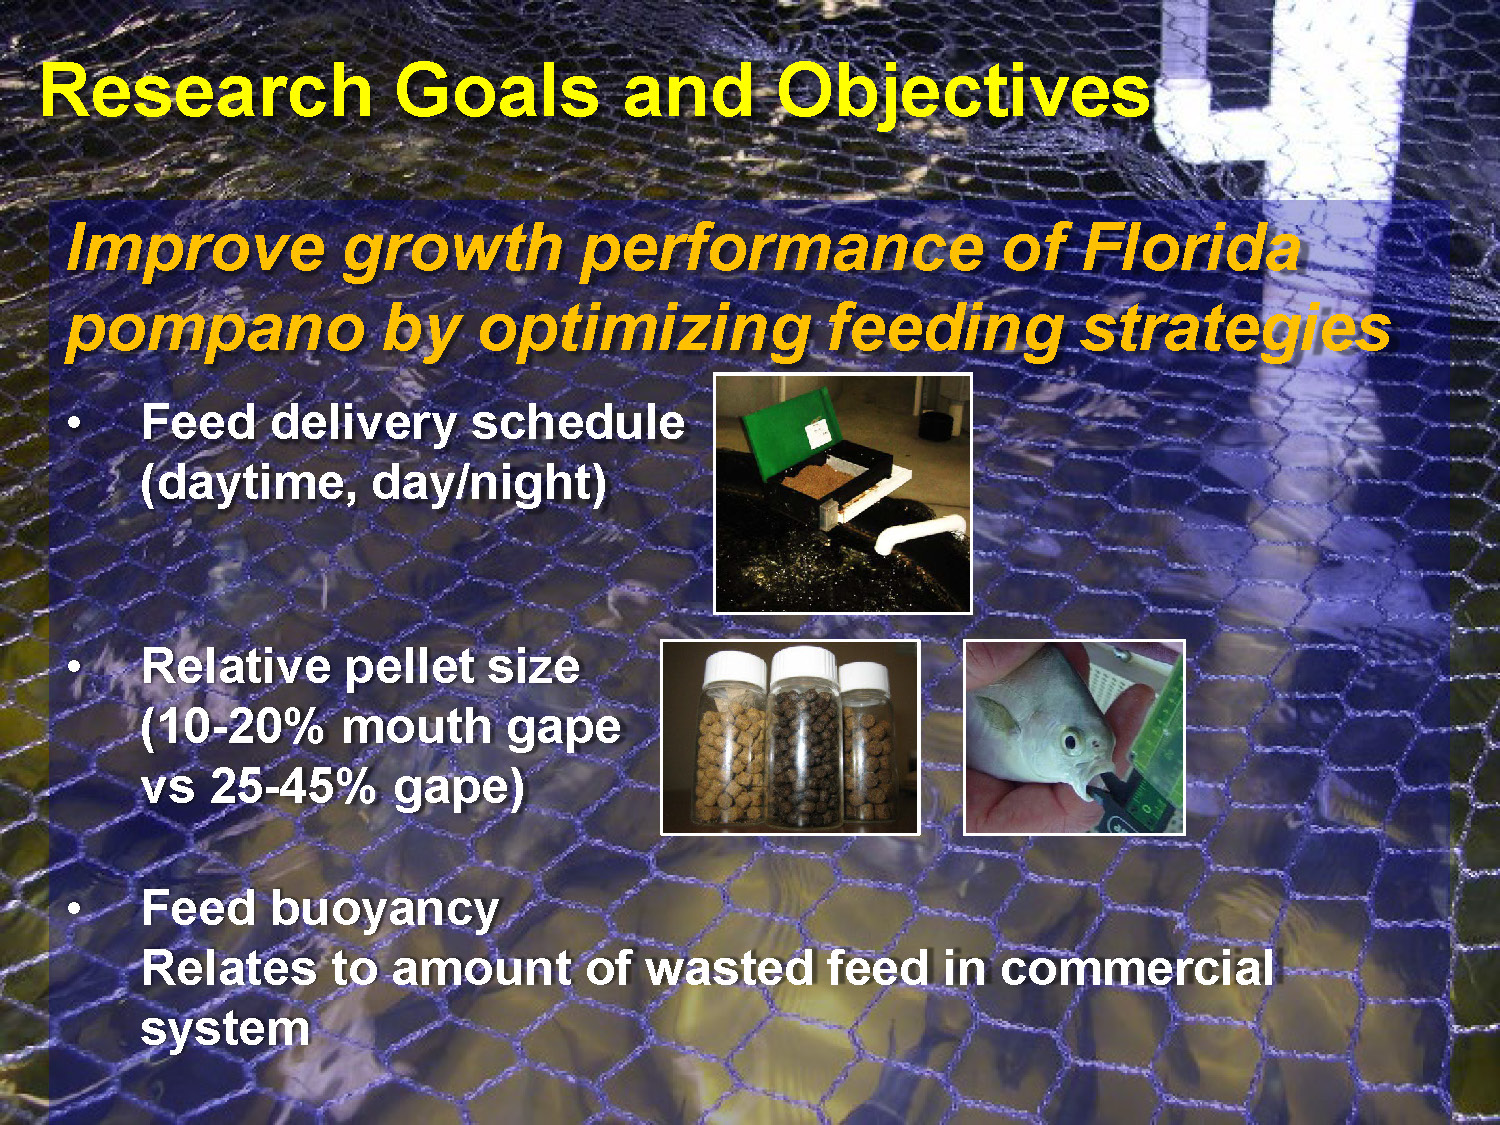
Research Goals and Objectives
Improve growth performance of Florida pompano by optimizing feeding strategies
- Feed delivery schedule (daytime, day/night)
- Relative pellet size (10-20% mouth gape vs 25-45% gape)
- Feed buoyancy
Relates to amount of wasted feed in commercial system
Research Goals and Objectives
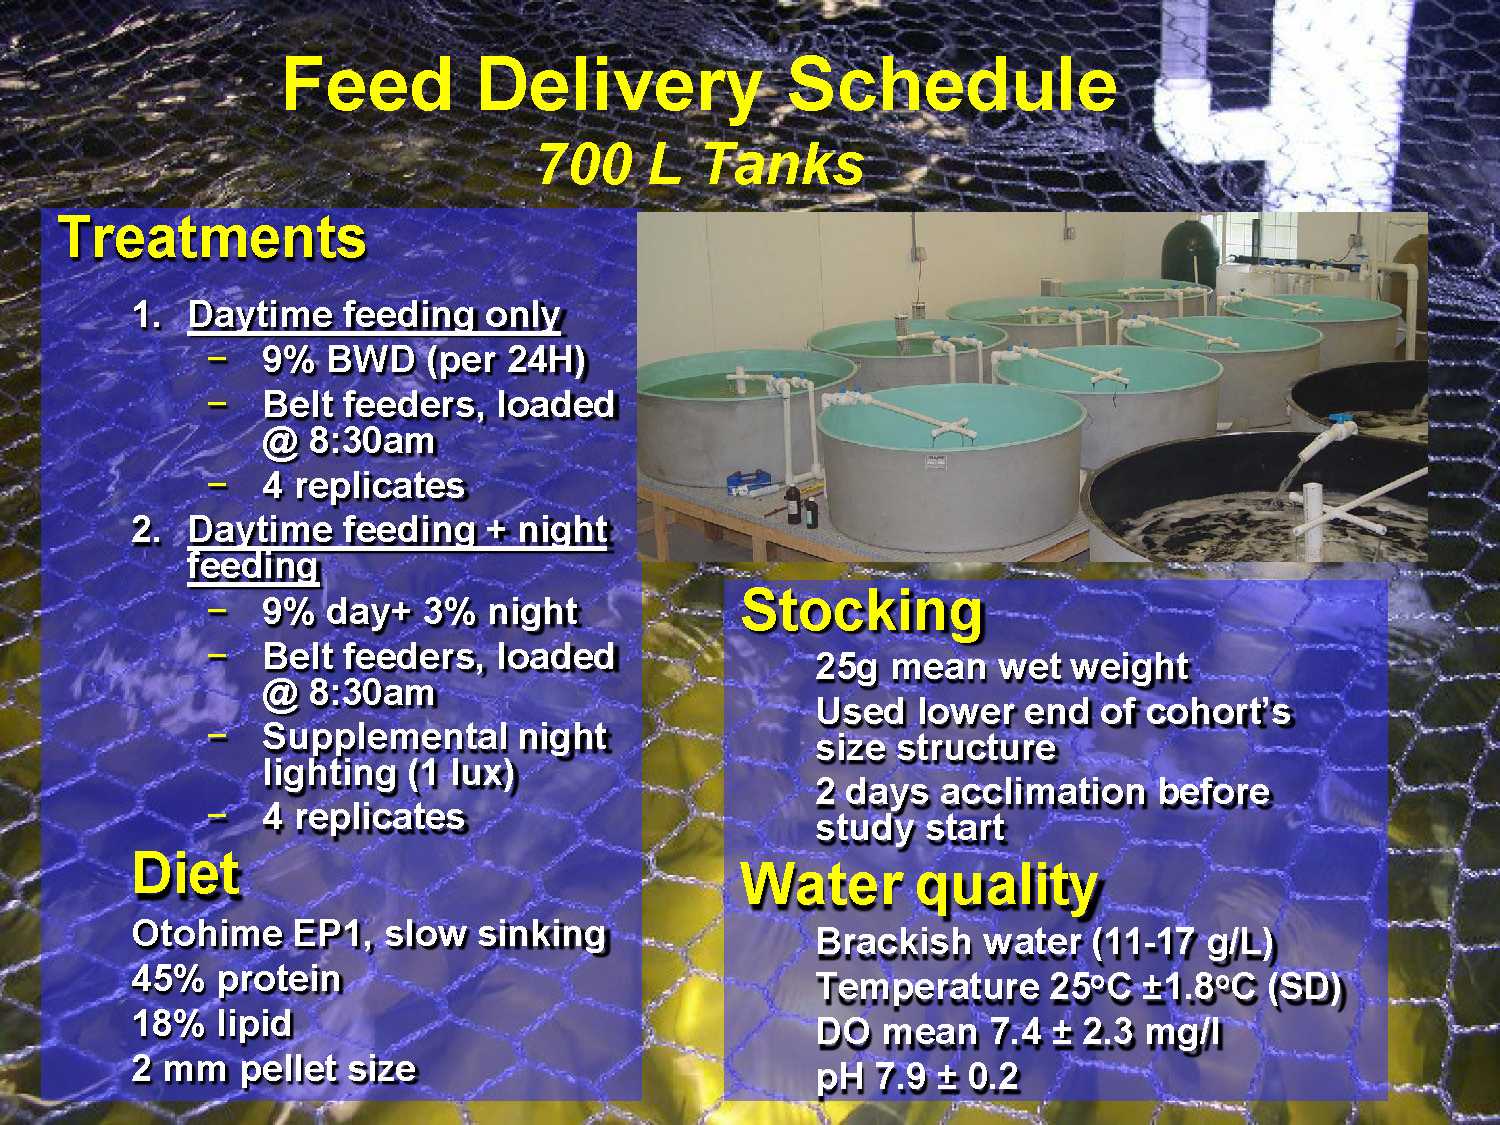
Feed Delivery Schedule
700 L Tanks
Treatments
1. Daytime feeding only
- 9% BWD (per 24H)
- Belt feeders, loaded @ 8:30am
- 4 replicates
2. Daytime feeding + night feeding
- 9% day+ 3% night
- Belt feeders, loaded @ 8:30am
- Supplemental night lighting (1 lux)
- 4 replicates
Diet
Otohime EP1, slow sinking
45% protein
18% lipid
2 mm pellet size
Stocking
25g mean wet weight
Used lower end of cohort's size structure
2 days acclimation before study start
Water quality
Brackish water (11-17 g/L)
Temperature 25°C ±1.8°C (SD)
DO mean 7.4 ± 2.3 mg/l
pH 7.9 ± 0.2
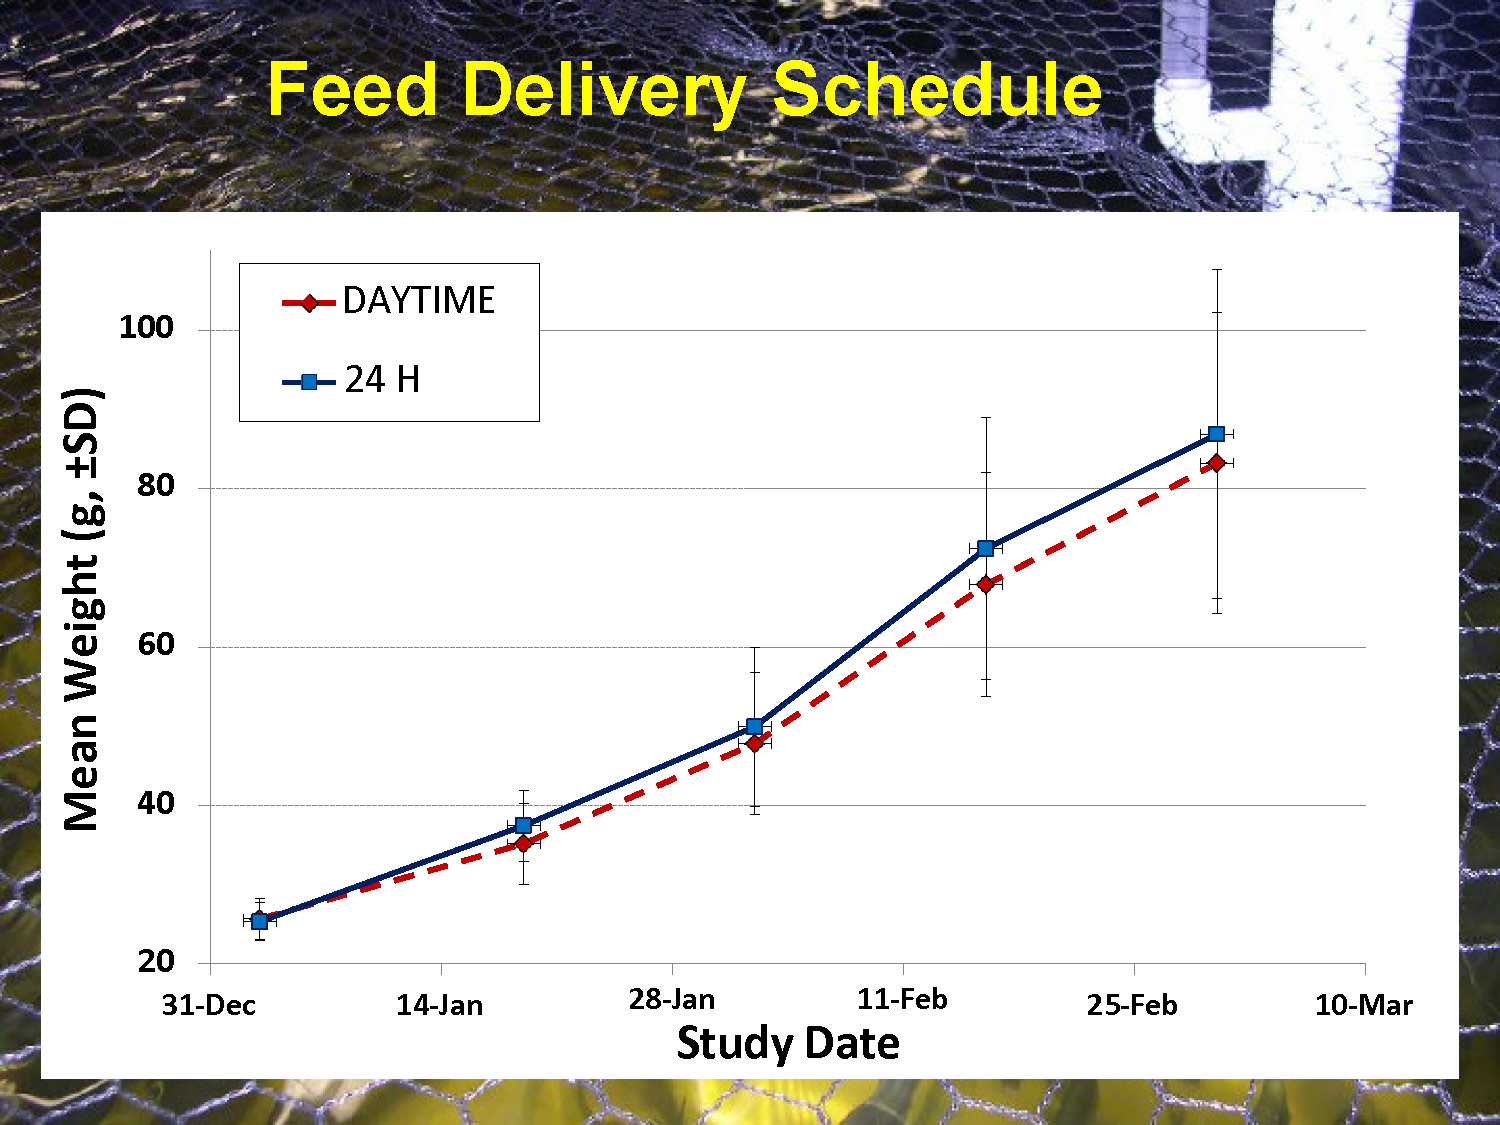
Feed Delivery Schedule
This line graph shows mean weight (g, ±SD) over time for two feeding treatments:
- DAYTIME (represented by one line)
- 24 H (represented by another line)
The x-axis shows study dates from 31-Dec through 10-Mar, with measurements at:
- 31-Dec
- 14-Jan
- 28-Jan
- 11-Feb
- 25-Feb
- 10-Mar
The y-axis shows mean weight ranging from 20g to 100g. Both treatments show similar growth patterns, starting at approximately 25g and increasing to around 80-90g by the end of the study period, with error bars indicating standard deviation at each measurement point.
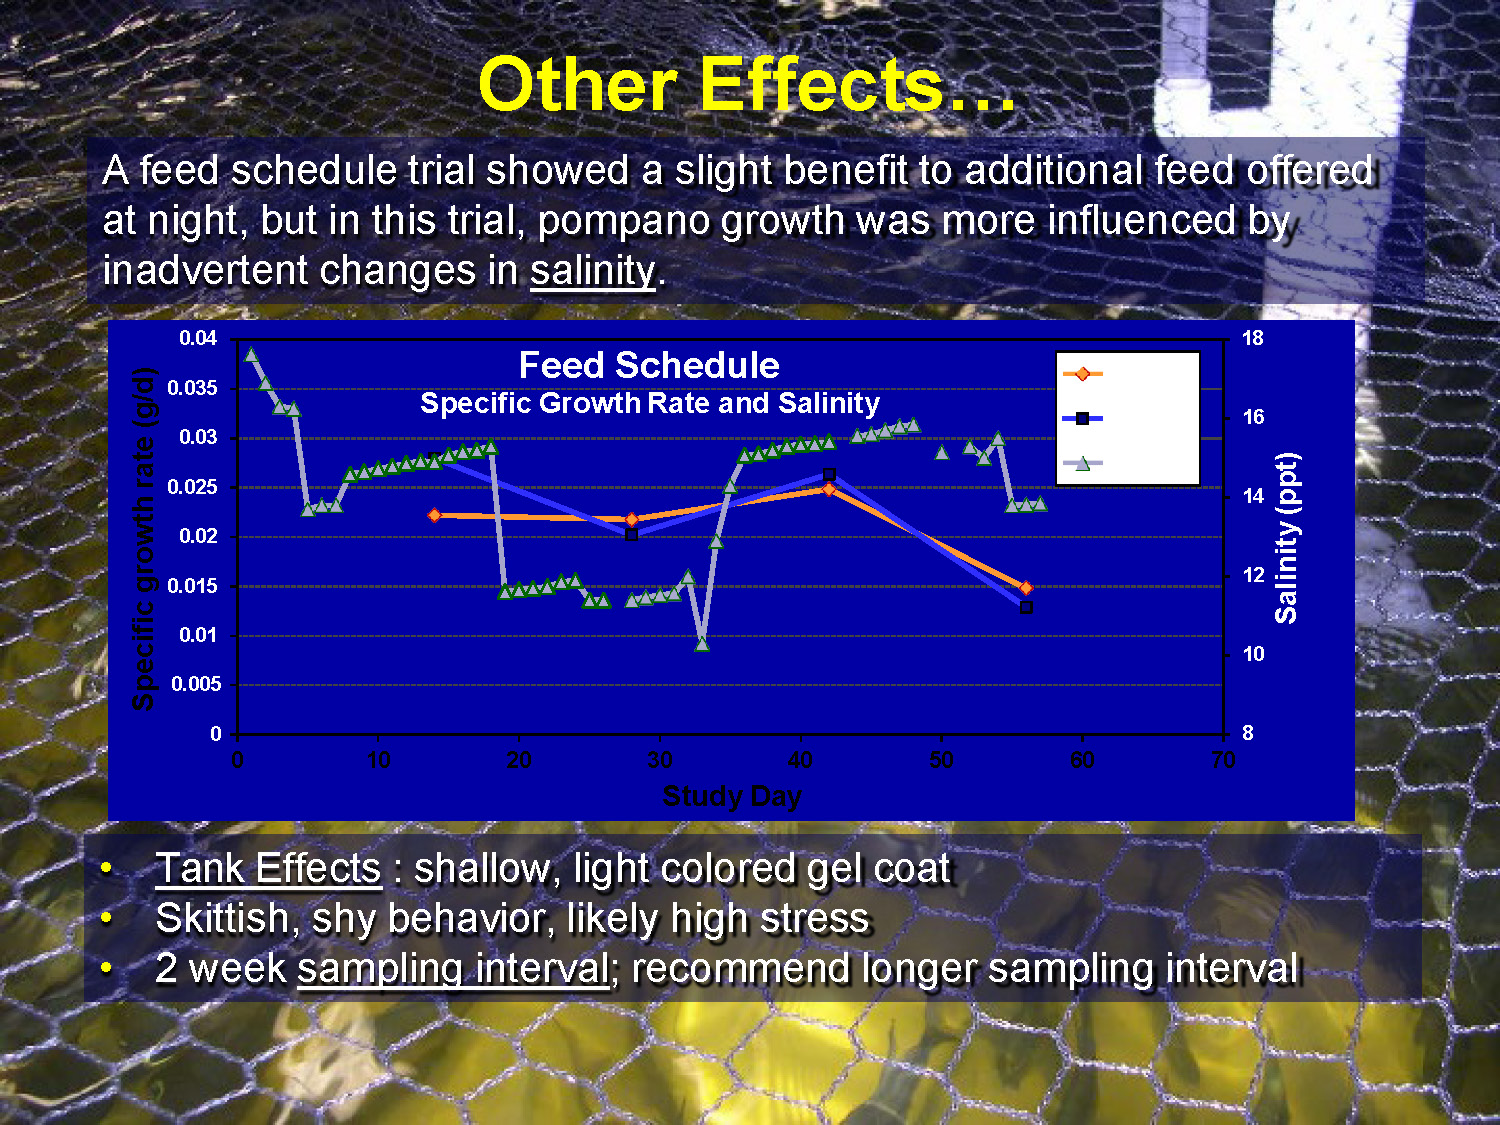
Other Effects…
A feed schedule trial showed a slight benefit to additional feed offered at night, but in this trial, pompano growth was more influenced by inadvertent changes in salinity.
Feed Schedule Specific Growth Rate and Salinity
The graph shows two y-axes:
- Left y-axis: Specific growth rate (g/d) ranging from 0 to 0.04
- Right y-axis: Salinity (ppt) ranging from 8 to 18
The x-axis shows Study Day from 0 to 70. The graph illustrates the relationship between specific growth rate and salinity changes throughout the trial period, showing fluctuations in both parameters over time.
Tank Effects:
- shallow, light colored gel coat
- Skittish, shy behavior, likely high stress
- 2 week sampling interval; recommend longer sampling interval
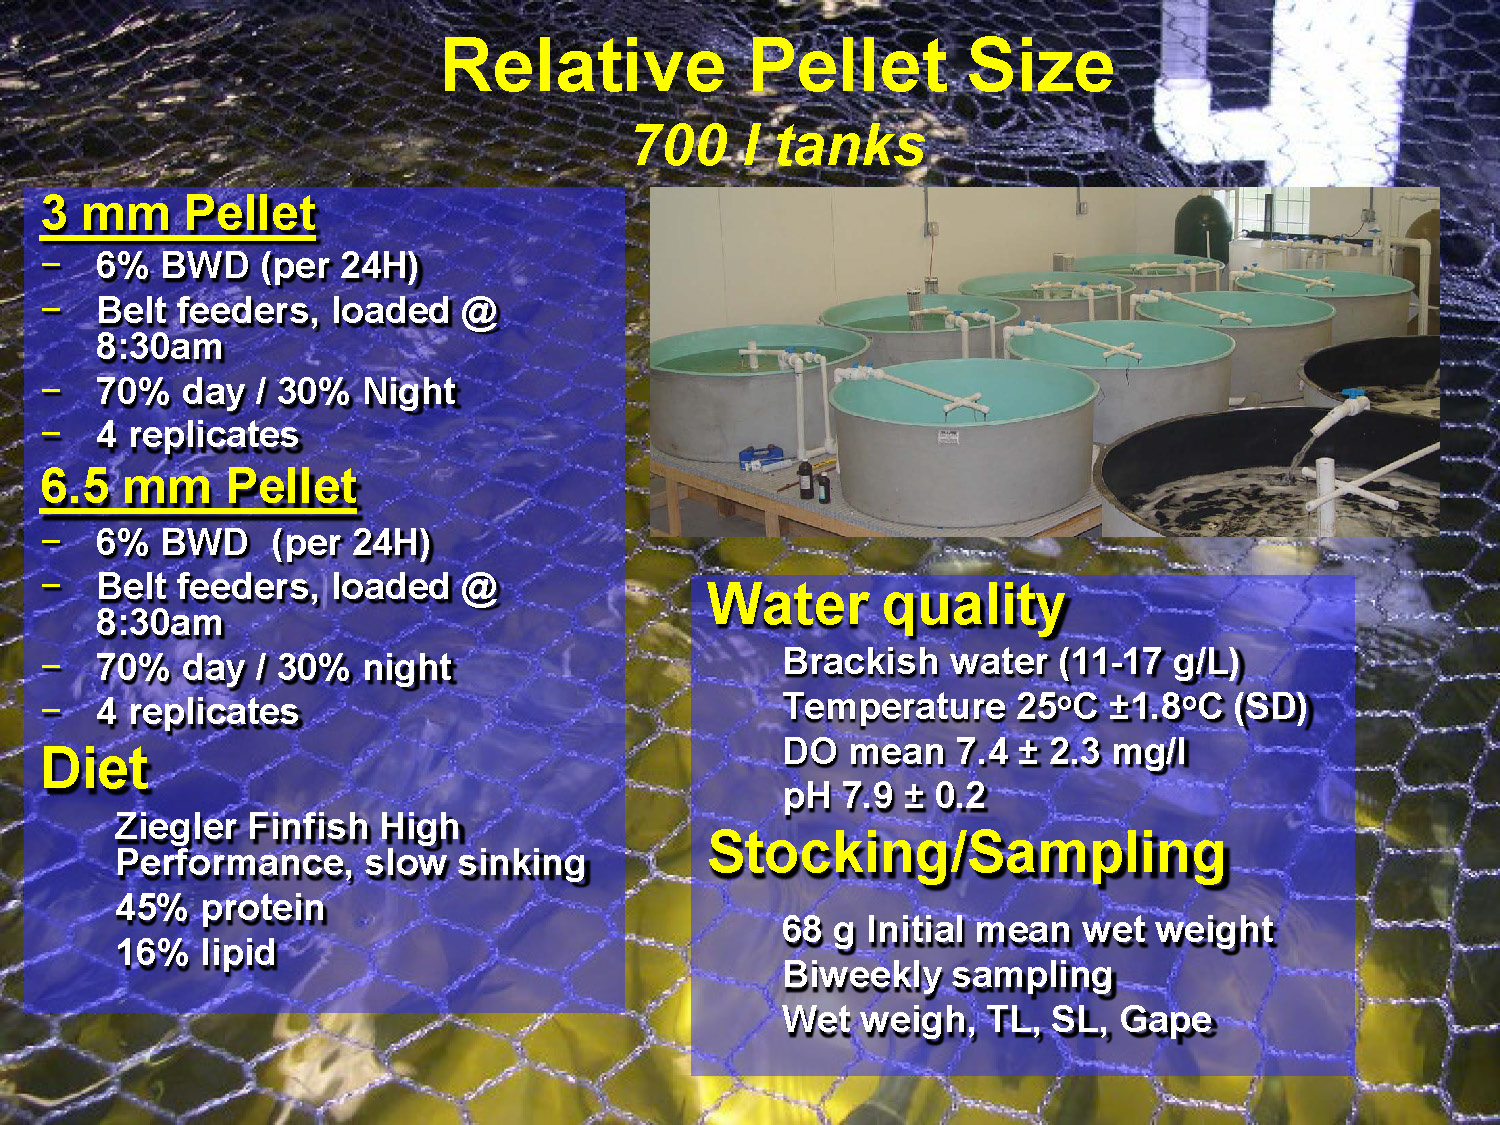
Relative Pellet Size
700 l tanks
3 mm Pellet
- 6% BWD (per 24H)
- Belt feeders, loaded @ 8:30am
- 70% day / 30% Night
- 4 replicates
6.5 mm Pellet
- 6% BWD (per 24H)
- Belt feeders, loaded @ 8:30am
- 70% day / 30% night
- 4 replicates
Diet
Ziegler Finfish High Performance, slow sinking
45% protein
16% lipid
Water quality
Brackish water (11-17 g/L)
Temperature 25°C ±1.8°C (SD)
DO mean 7.4 ± 2.3 mg/l
pH 7.9 ± 0.2
Stocking/Sampling
68 g Initial mean wet weight
Biweekly sampling
Wet weigh, TL, SL, Gape
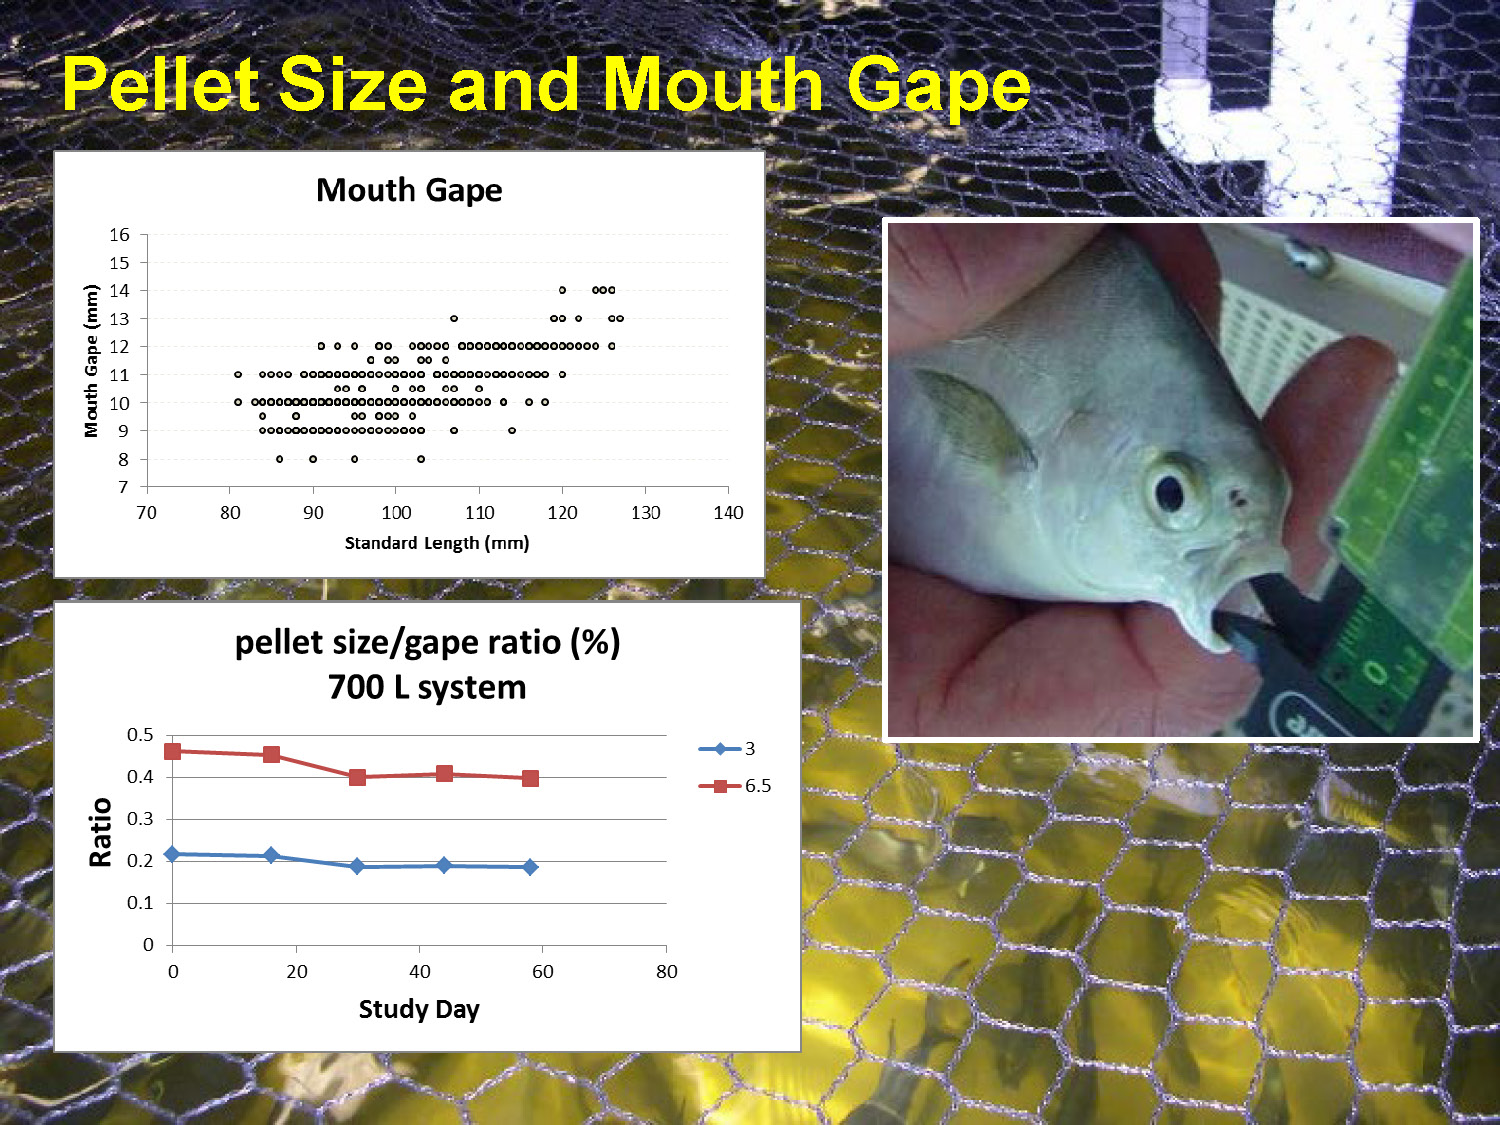
Pellet Size and Mouth Gape
The diagram shows a visual representation of different pellet sizes relative to a pompano fish's mouth gape, illustrating the relationship between feed pellet dimensions and the fish's ability to consume them efficiently.
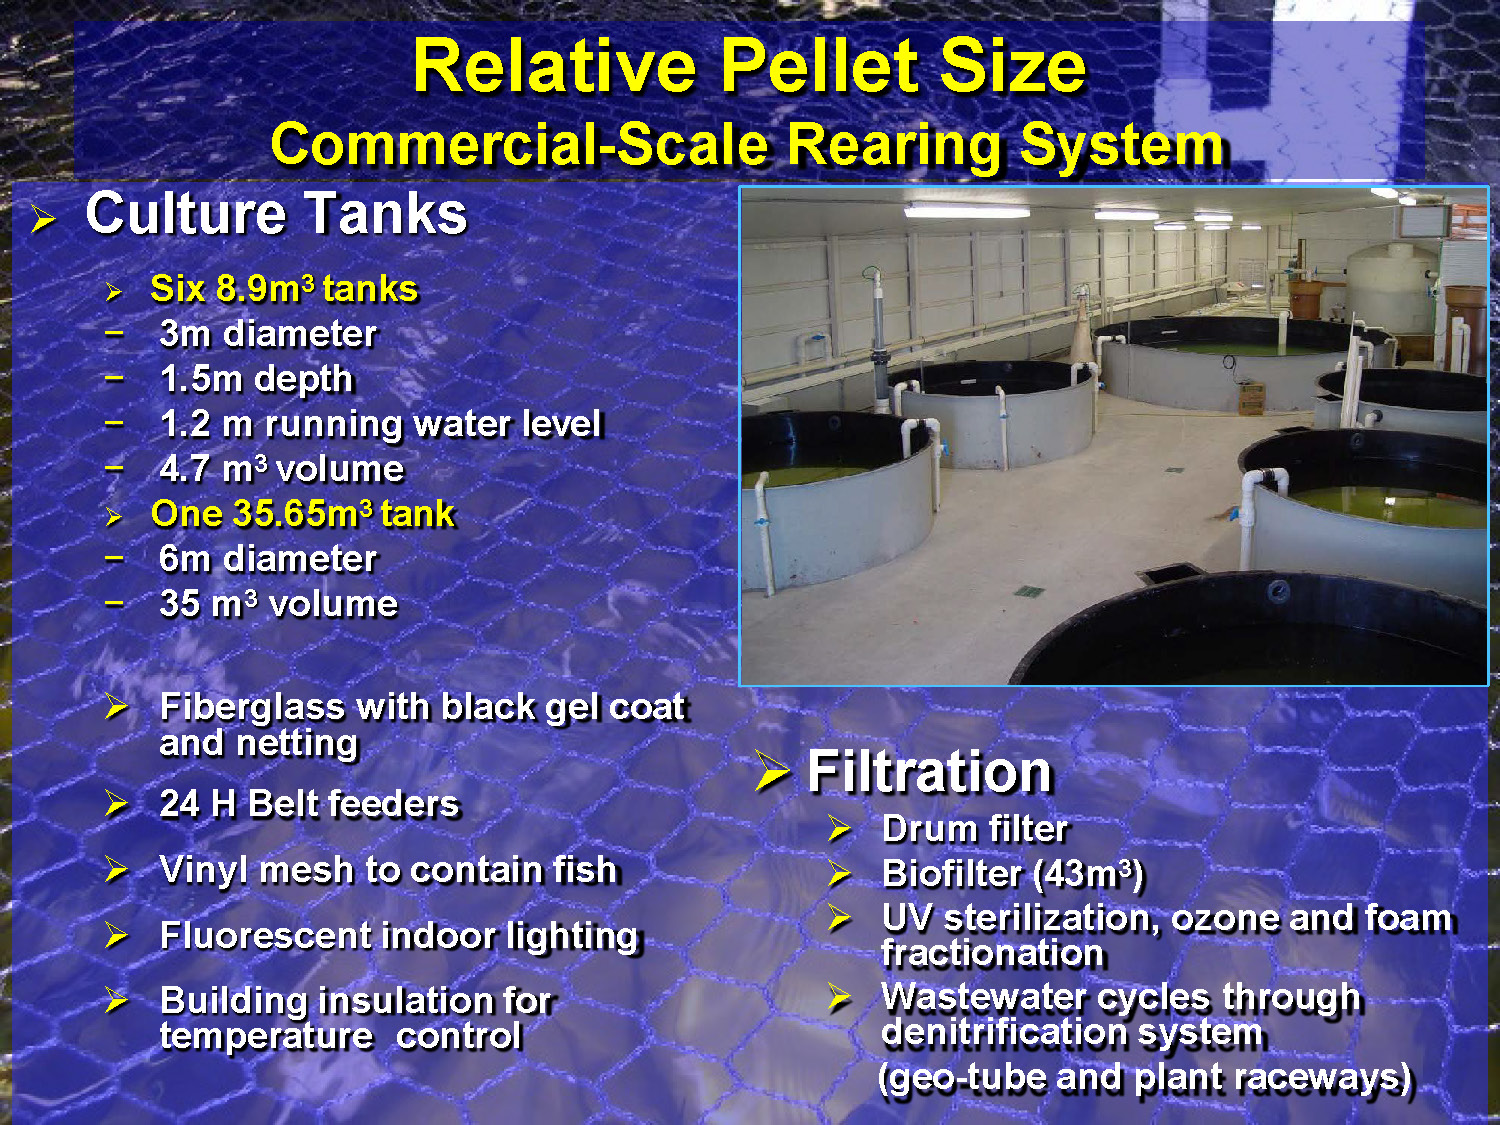
Relative Pellet Size
Commercial-Scale Rearing System
Culture Tanks
- Six 8.9m³ tanks
- 3m diameter
- 1.5m depth
- 1.2 m running water level
- 4.7 m³ volume
- One 35.65m³ tank
- 6m diameter
- 35 m³ volume
- Fiberglass with black gel coat and netting
- 24 H Belt feeders
- Vinyl mesh to contain fish
- Fluorescent indoor lighting
- Building insulation for temperature control
- Filtration
- Drum filter
- Biofilter (43m³)
- UV sterilization, ozone and foam fractionation
- Wastewater cycles through denitrification system (geo-tube and plant raceways)
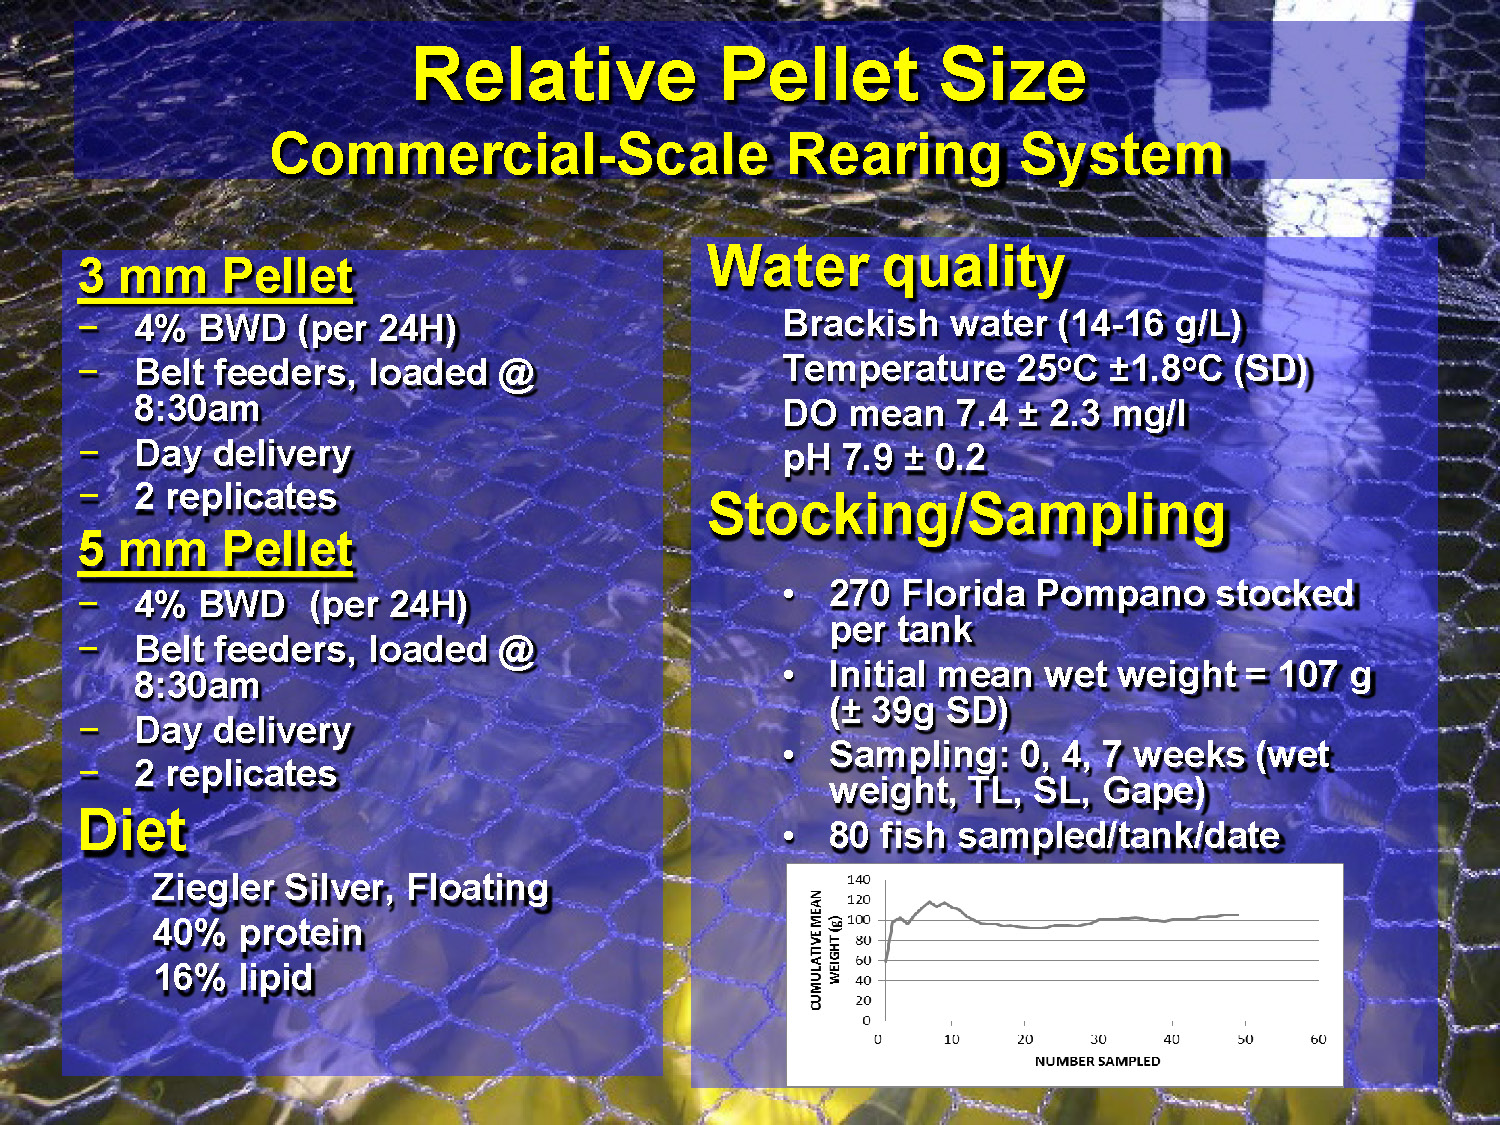
Relative Pellet Size
Commercial-Scale Rearing System
3 mm Pellet
- 4% BWD (per 24H)
- Belt feeders, loaded @ 8:30am
- Day delivery
- 2 replicates
5 mm Pellet
- 4% BWD (per 24H)
- Belt feeders, loaded @ 8:30am
- Day delivery
- 2 replicates
Diet
Ziegler Silver, Floating
40% protein
16% lipid
Water quality
Brackish water (14-16 g/L)
Temperature 25°C ±1.8°C (SD)
DO mean 7.4 ± 2.3 mg/l
pH 7.9 ± 0.2
Stocking/Sampling
- 270 Florida Pompano stocked per tank
- Initial mean wet weight = 107 g (± 39g SD)
- Sampling: 0, 4, 7 weeks (wet weight, TL, SL, Gape)
- 80 fish sampled/tank/date
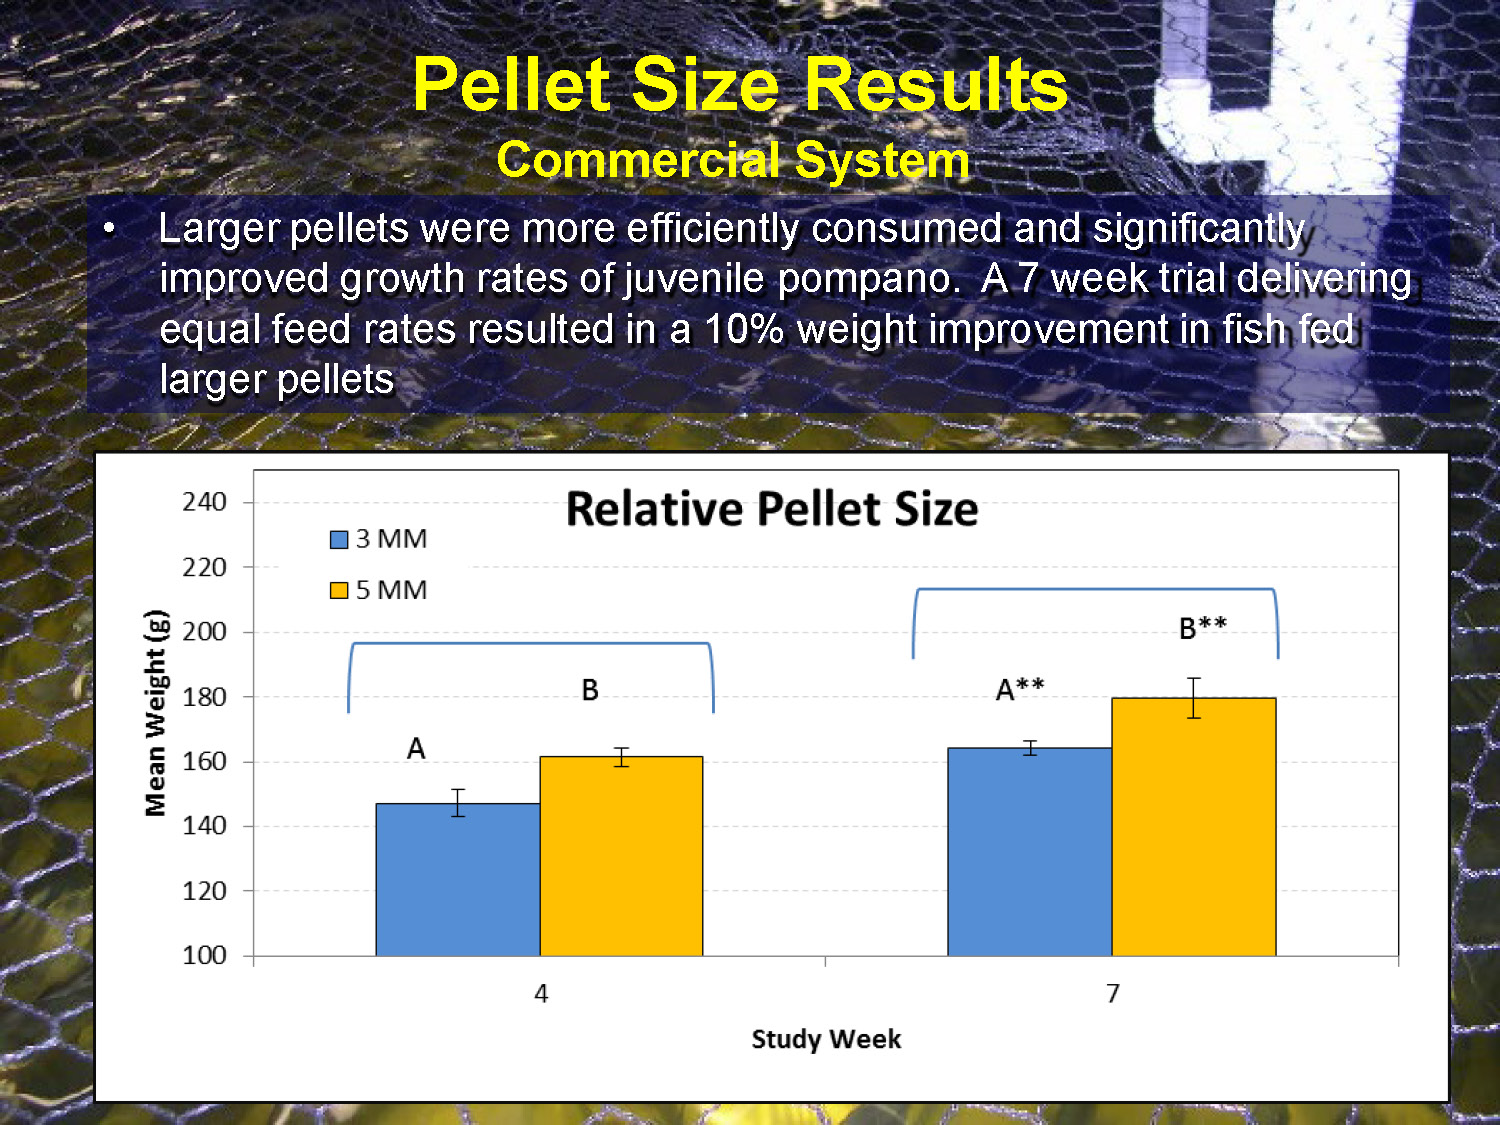
Pellet Size Results
Commercial System
Larger pellets were more efficiently consumed and significantly improved growth rates of juvenile pompano. A 7 week trial delivering equal feed rates resulted in a 10% weight improvement in fish fed larger pellets
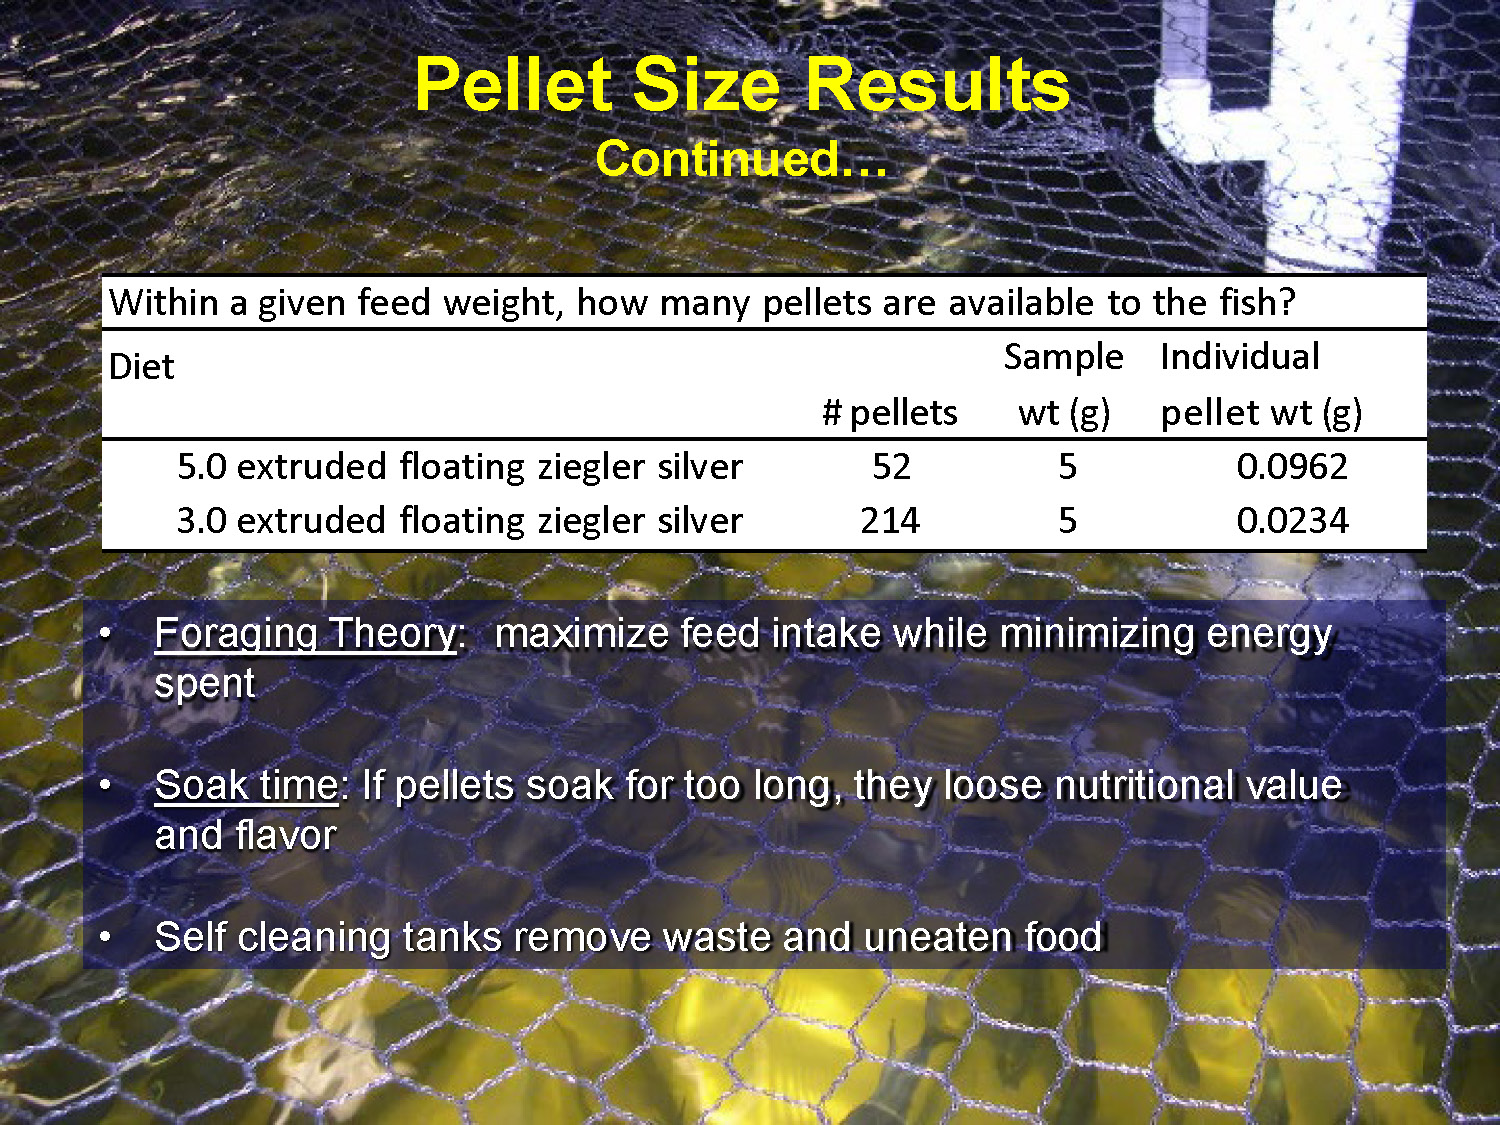
Pellet Size Results
Continued…
Within a given feed weight, how many pellets are available to the fish?
| Diet Sample | Individual | # pellets | wt (g) | pellet wt (g) |
|---|---|---|---|---|
| 5.0 extruded floating ziegler silver | 52 | 5 | 0.0962 | |
| 3.0 extruded floating ziegler silver | 214 | 5 | 0.0234 |
- Foraging Theory: maximize feed intake while minimizing energy spent
- Soak time: If pellets soak for too long, they loose nutritional value and flavor
- Self cleaning tanks remove waste and uneaten food
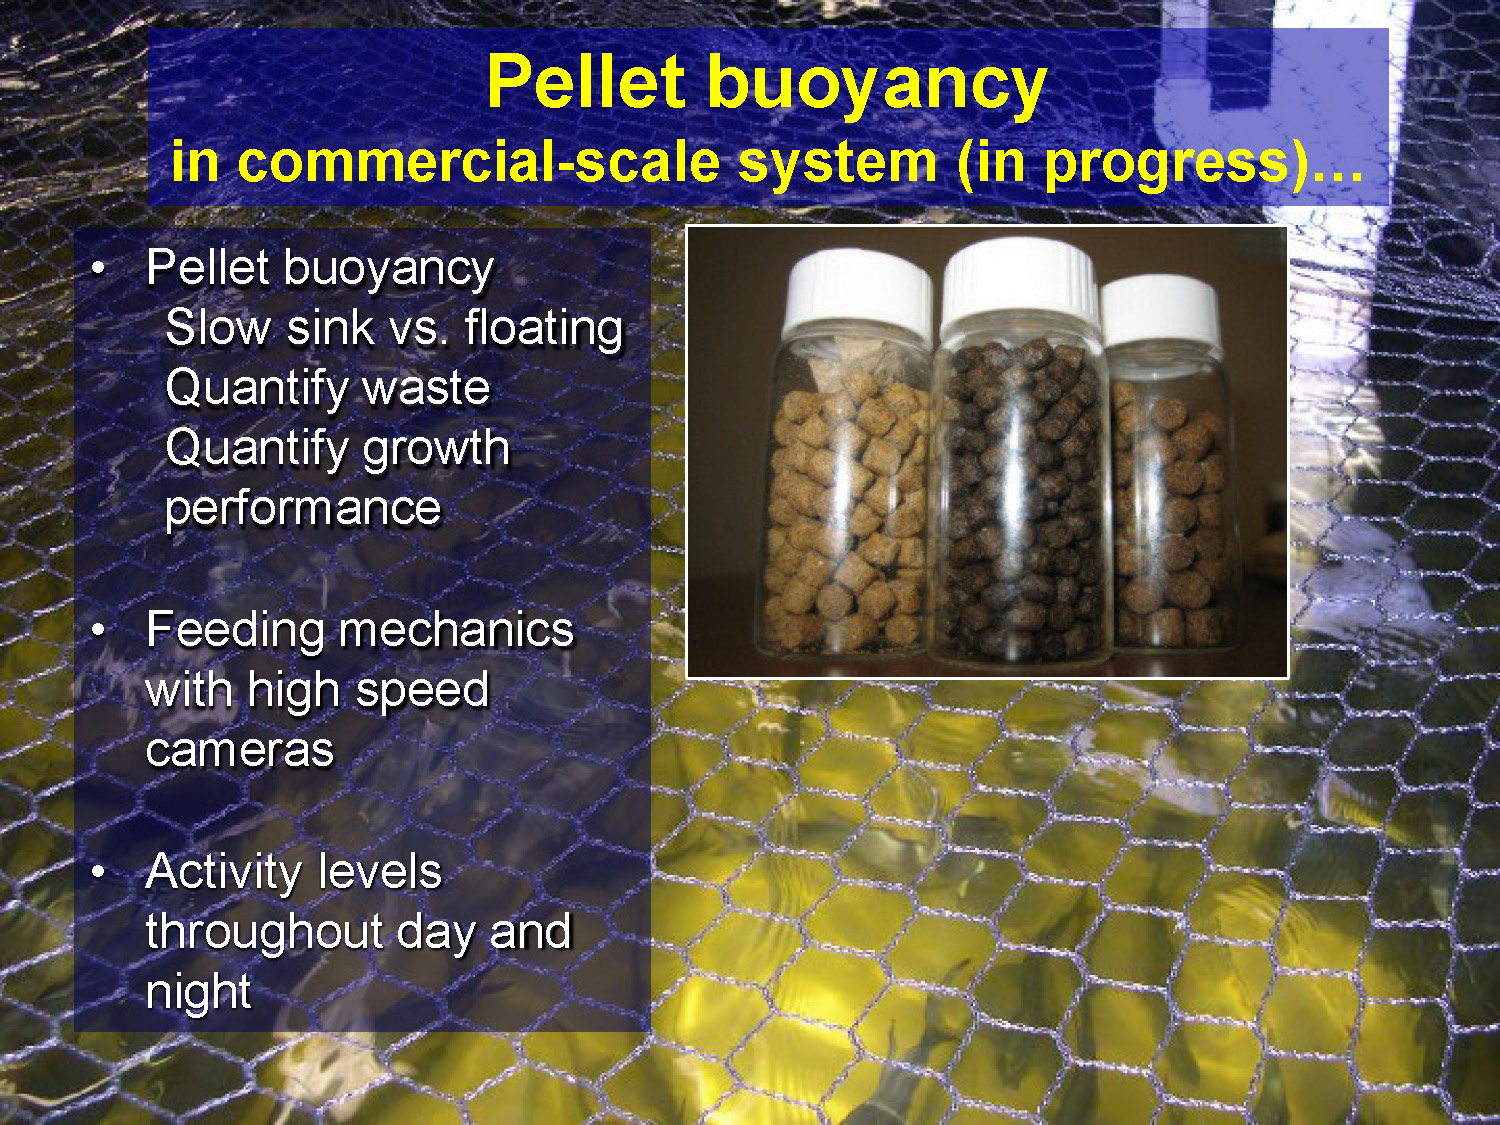
Pellet buoyancy
in commercial-scale system (in progress)…
- Pellet buoyancy
- Slow sink vs. floating
- Quantify waste
- Quantify growth performance
- Feeding mechanics with high speed cameras
- Activity levels throughout day and night

Pellet Buoyancy and feed waste management
Side & bottom drains and feed buoyancy affect feed residence time in tanks and amount wasted
The diagram illustrates how tank design features including drain placement and pellet buoyancy characteristics influence how long feed remains available in the tank and the proportion of feed that is wasted through the drainage system.
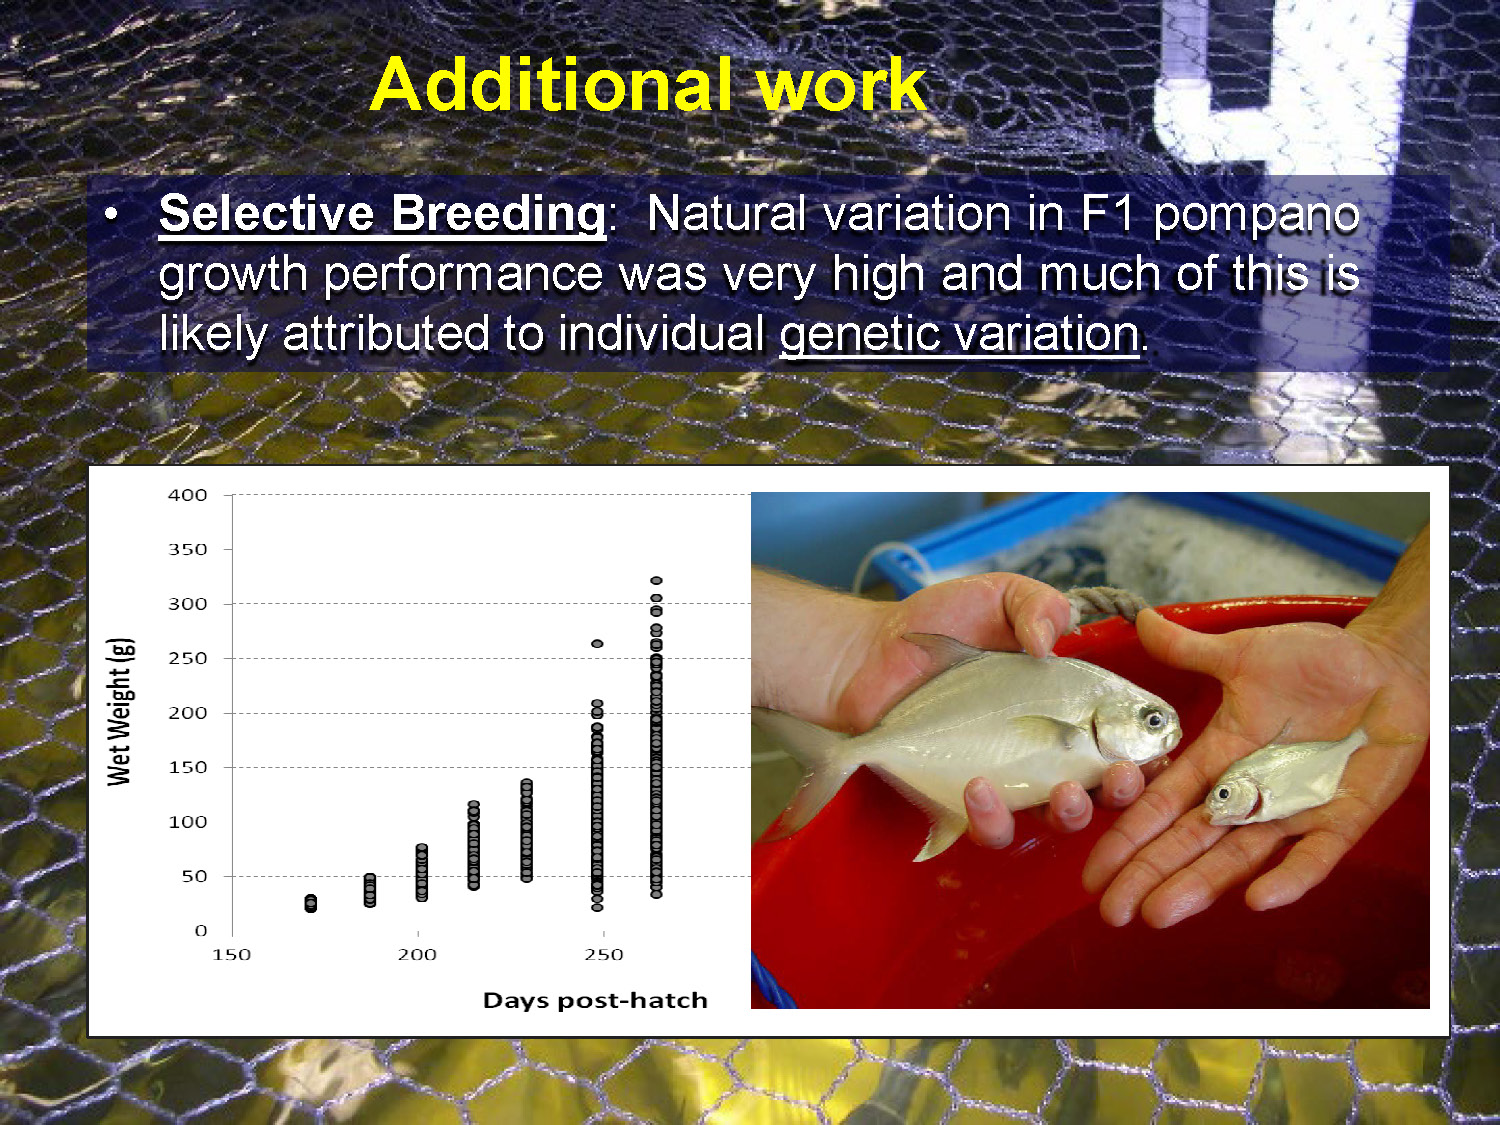
Additional work
Selective Breeding: Natural variation in F1 pompano growth performance was very high and much of this is likely attributed to individual genetic variation.
Additional work
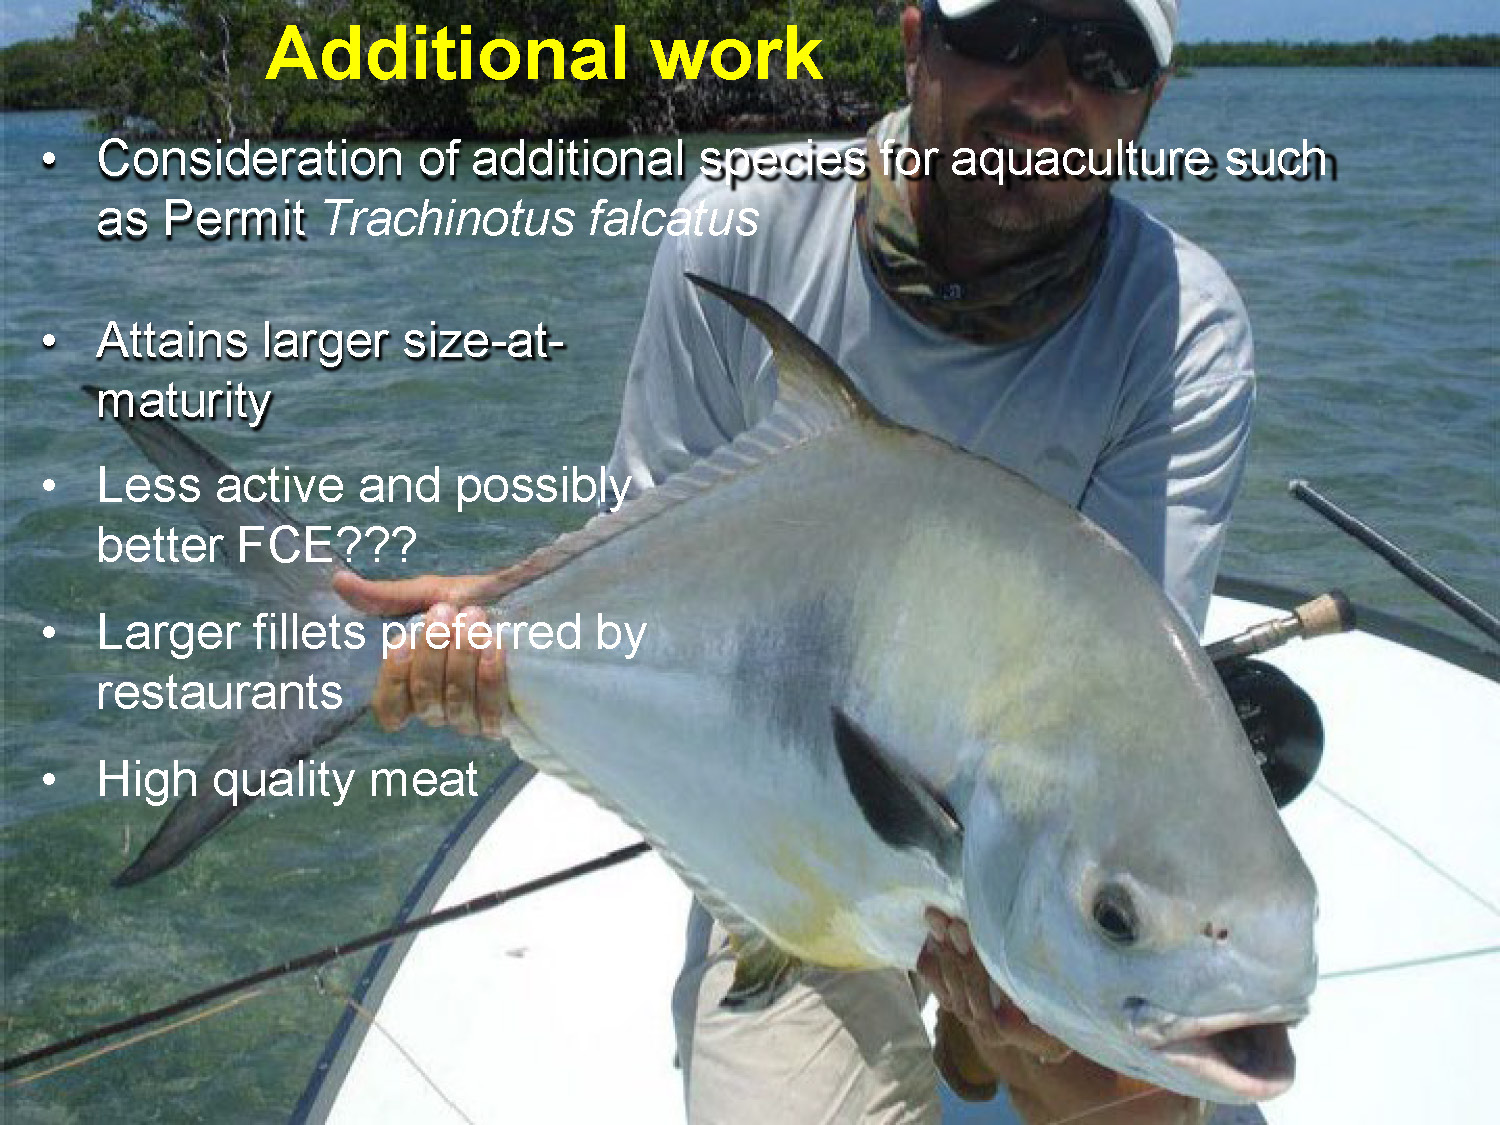
Consideration of additional species for aquaculture such as Permit Trachinotus falcatus
- Attains larger size-at-maturity
- Less active and possibly better FCE???
- Larger fillets preferred by restaurants
- High quality meat
A photograph shows a Permit fish specimen.
Support Provided by:
- NIFA/USDA Fellowship Program
- Mote Marine Laboratory
- NOAA-Sea Grant
- Florida Division of Aquaculture/Aquaculture Research Council
End of presentation.
Go to top of page.