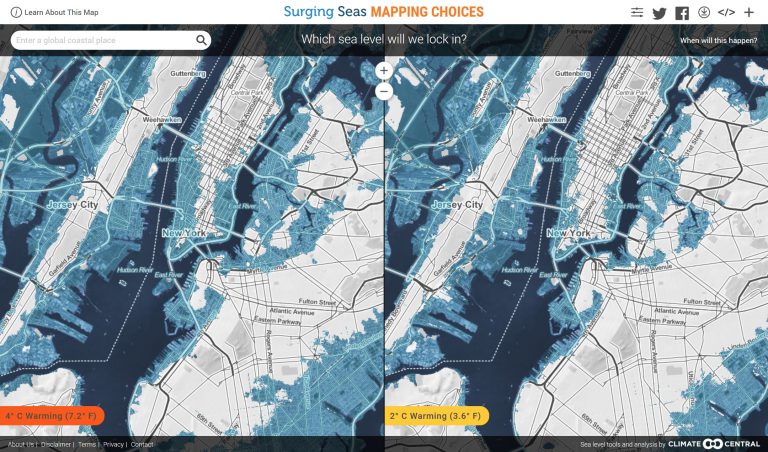
Surging Seas Mapping Choices is an interactive global online map that allows anyone to search for a global location and visually compare the local potential consequences of different emissions and warming scenarios.
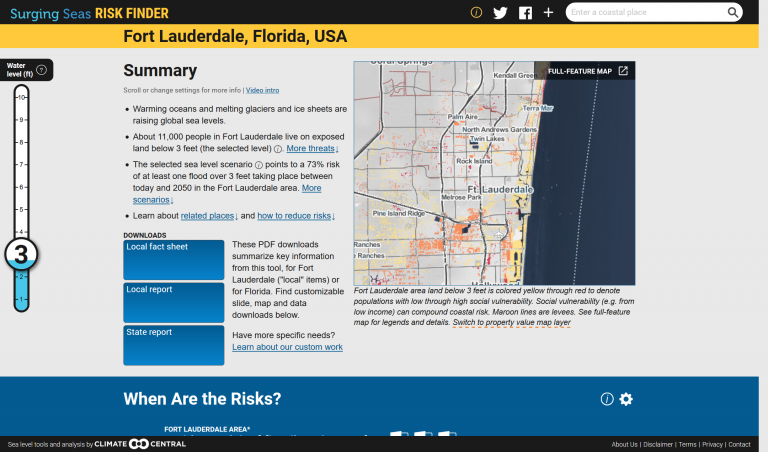
Climate Central’s Surging Seas Risk Finder is a searchable web tool designed to provide citizens, communities and policymakers in the U.S. with the tailored local information they need to understand and respond to the risks...
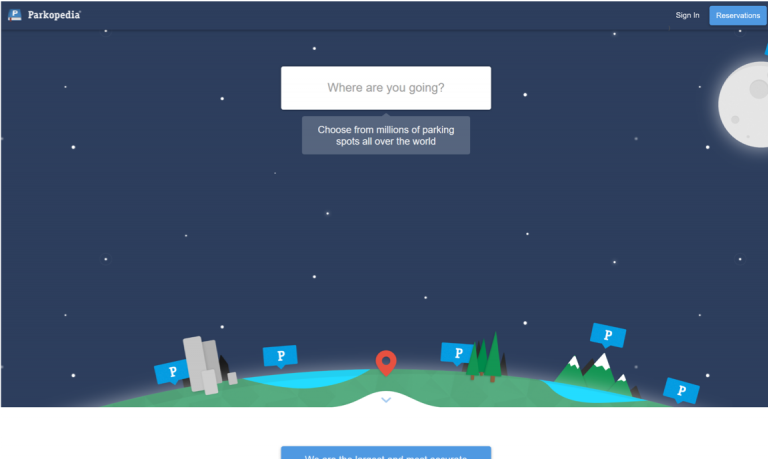
Parkopedia allows drivers to find the closest parking to their destination, tells them how much it will cost and whether the space is available.
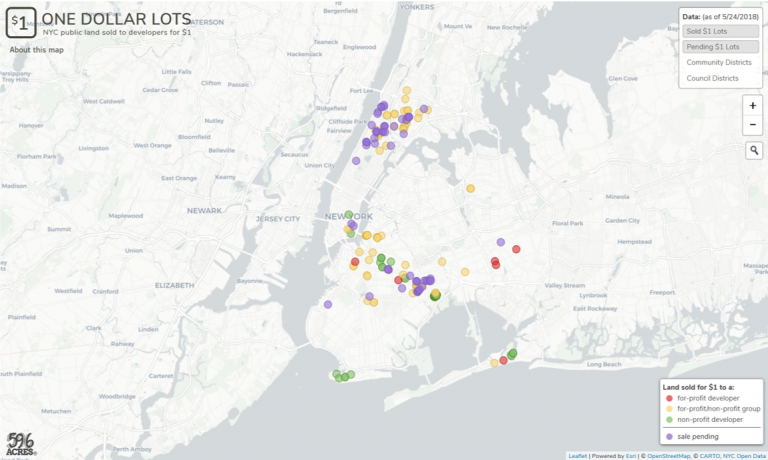
The ONE DOLLAR LOTS project by 596 Acres is an archive of these $1 lot sales.
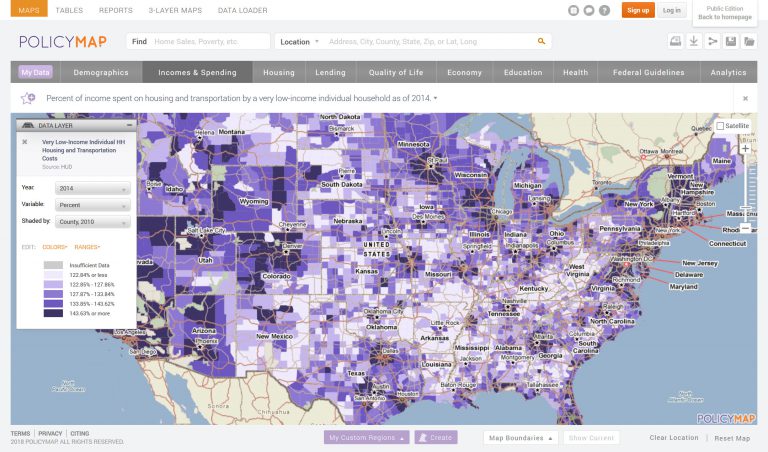
PolicyMap offers easy-to-use online mapping with data on demographics, real estate, health, jobs and more in communities across the US.
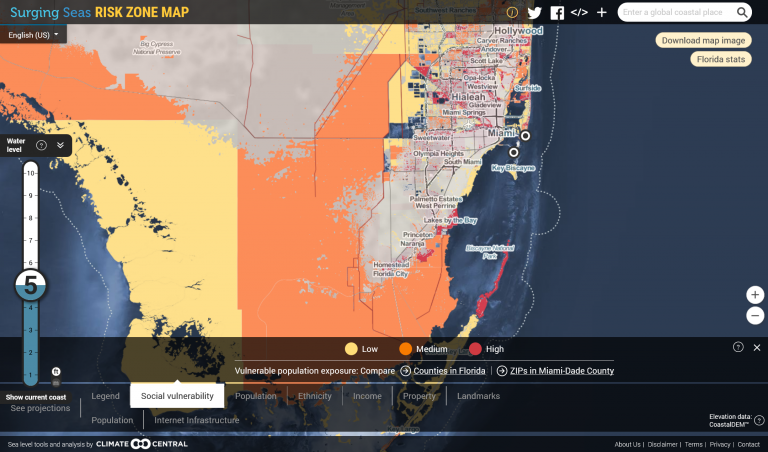
Climate Central’s Surging Seas: Risk Zone map shows areas vulnerable to near-term flooding from different combinations of sea level rise, storm surge, tides, and tsunamis, or to permanent submersion by long-term sea level...
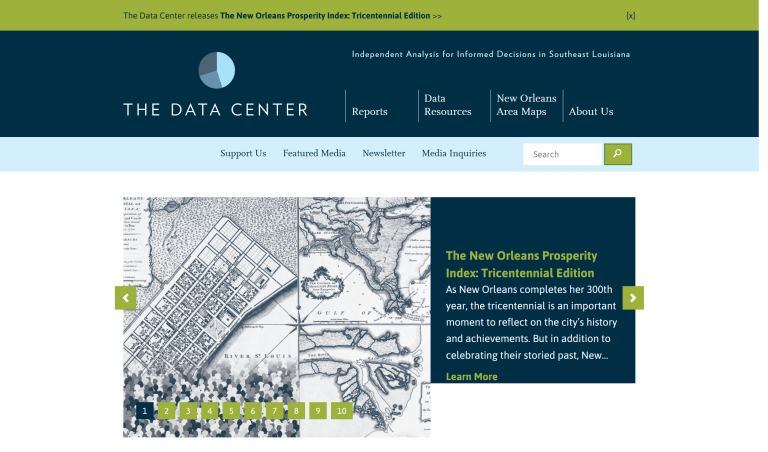
The Data Center brings data together from multiple sources, analyzing data at a 360–degree look regarding regional issues from the government, business, nonprofit, and community perspective.
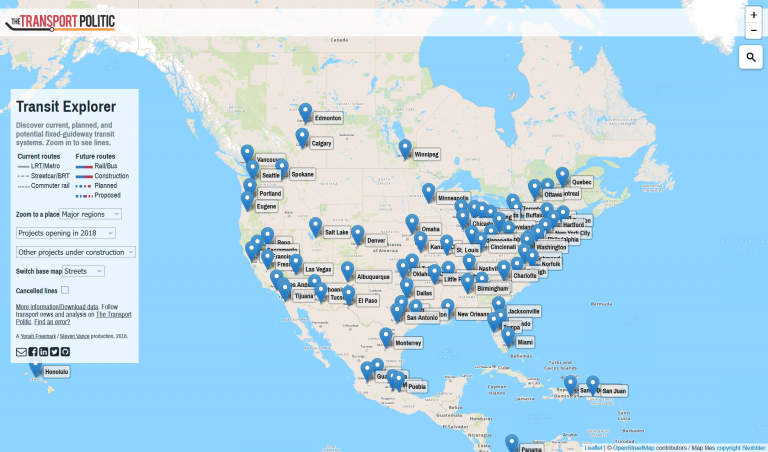
A web-based tool to discover current, planned, and potential fixed-guideway transit systems across North America.
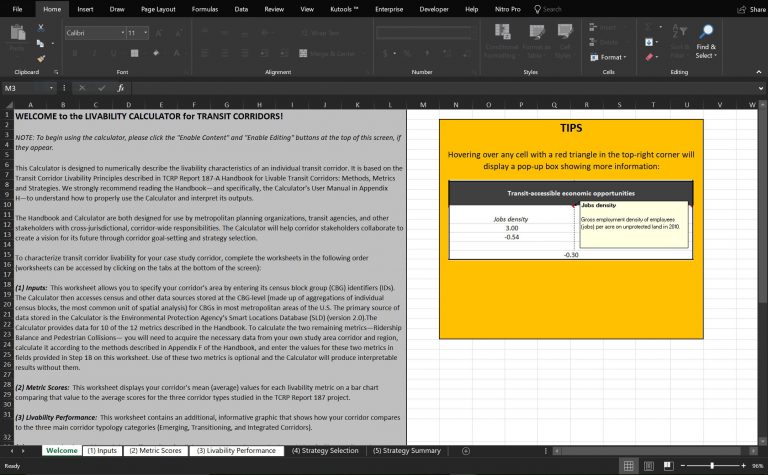
This calculator is designed to numerically describe the livability characteristics of an individual transit corridor.