Indian River Lagoon Observations
July 31, 2020: IRLON 2.0
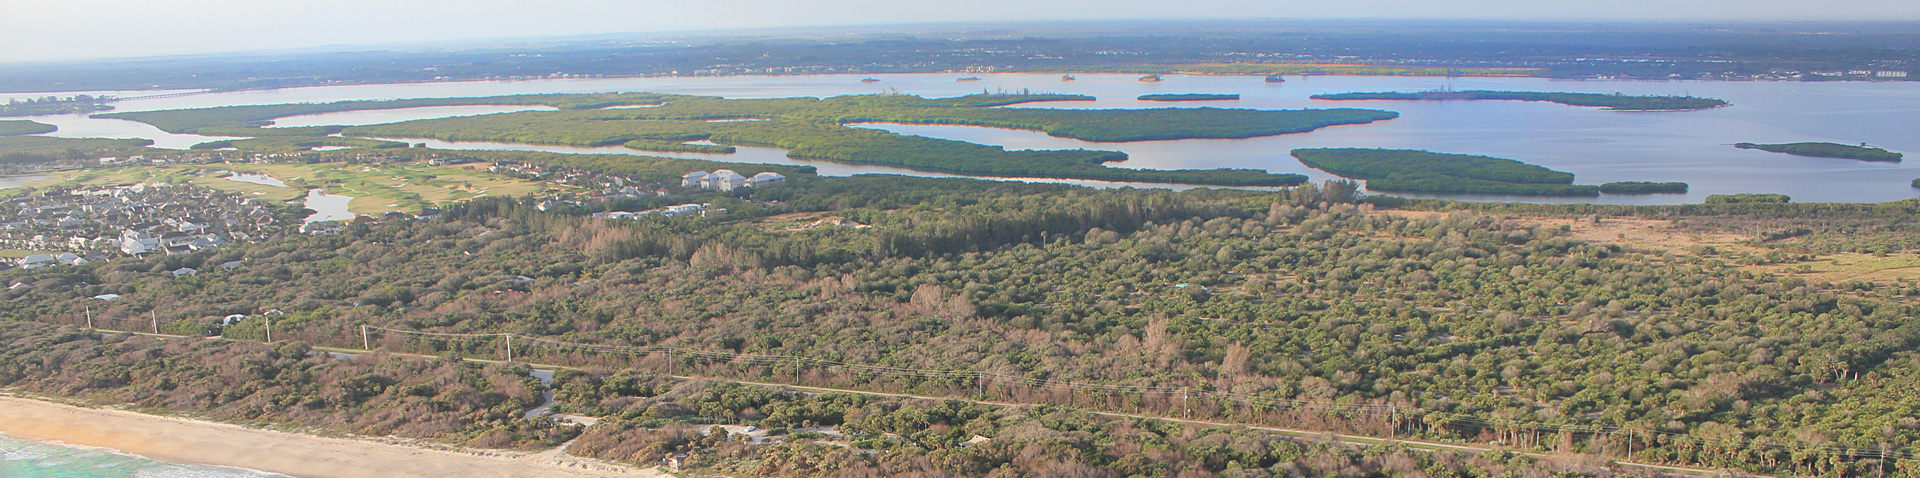
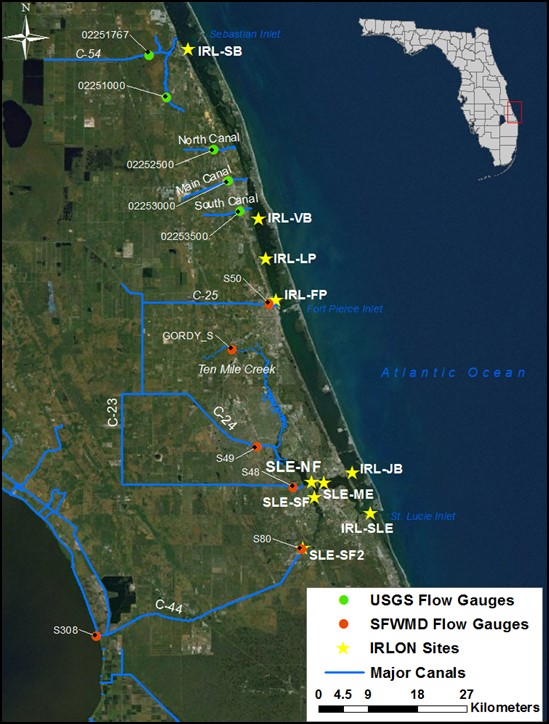
In 2013, the Indian River Lagoon Observatory Network of environmental sensors (IRLON) was launched with a single station in 2013 and expanded into 10 strategically located stations in the south central IRL and the St. Lucie Estuary (SLE) with funding from the Harbor Branch Oceanographic Institute Foundation (HBOIF), Florida Department of Environmental Protection (FDEP), and South Florida Water Management District (SFWMD). IRLON has since provided an unprecedented flow of water quality and meteorological data for the Lagoon. Operational support has been provided by annual grants from FDEP and the Save Our Seas Specialty License Plate, which is administered by HBOIF. Those of us working on IRLON have learned a lot since that first station at the end of the Harbor Branch Channel. IRLON is now entering its next phase which will enhance and expand our capabilities; we call it IRLON 2.0 for short.
View the following past issues of the IRL Observations newsletter here.
- April 6, 2016:You can observe a lot by just watching
- April 27, 2016: Our Tenth IRLON Site
- May 12, 2016: Barnacle Busting
- May 26, 2016: Future of Water Quality Research in Florida Workshop
- June 29, 2016: St. Lucie Estuary Algal Blooms
- July 08, 2016: Connecting Users to IRL Data
- October 11, 2016: A Brush with Hurricane Matthew
- January 17, 2017: Martin County Youth Leadership Environmental Day
- March 3, 2017: St. Lucie Estuary – What A Difference A Year Makes!
- June 12, 2017: Here Comes the Rain – 2017’s First Flush
- August 24, 2017: An Estuary at your Fingertips: Connecting the Community to Environmental Data
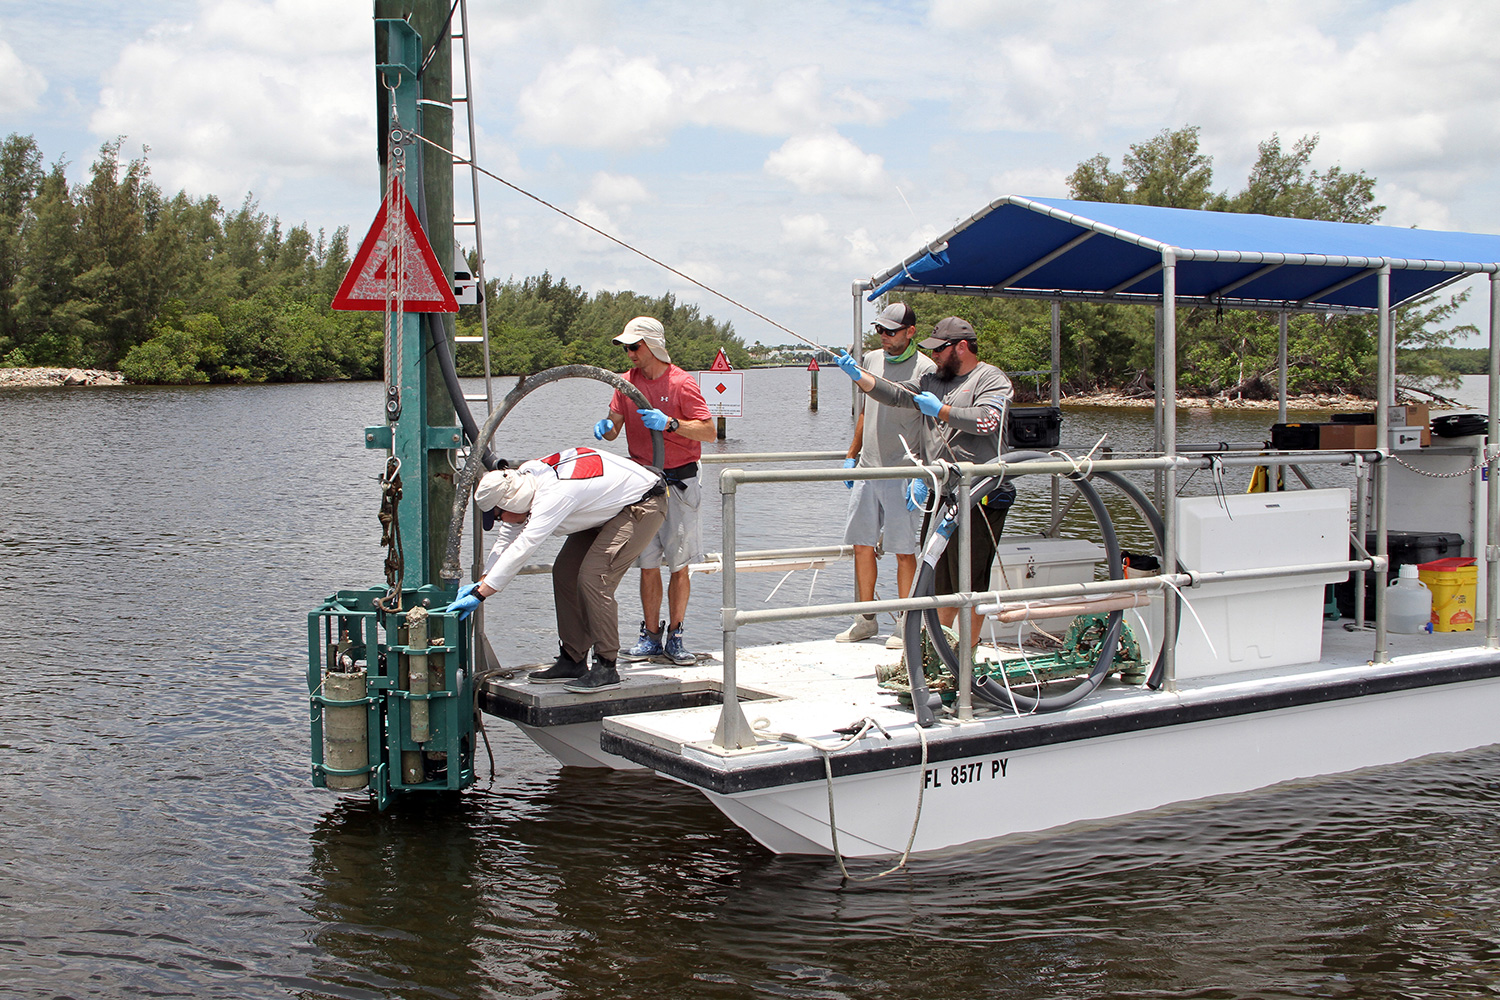
- Evaluate and address existing challenges with IRLON: We recently added remote connection to our IRLON stations to allow troubleshooting of instrumentation (saving numerous boat trips to the stations); added weather stations to the 3 sites (IRL-SB, IRL-VB, IRL-FP) that did not have them; replaced the STOR-X data loggers with CR1000X data loggers; and established a new IRLON data portal www.irlon.org.
- Add new technical capabilities to the existing IRLON stations to address emerging issues of IRL health – harmful algal blooms (HABs) and coastal acidification: We have purchased and this summer we will finish deploying new sensors that will measure phycocyanin and phycoerythrin, a proxy of cyanobacteria; fluorescent chlorophyll, a proxy of phytoplankton: pCO2, a measure of the partial pressure of carbon dioxide, which, when coupled with IRLON’s SeaFET pH capabilities, will allow calculation of the remaining carbonate system parameters including aragonite saturation, an important component in acidification of estuaries and the coastal ocean.
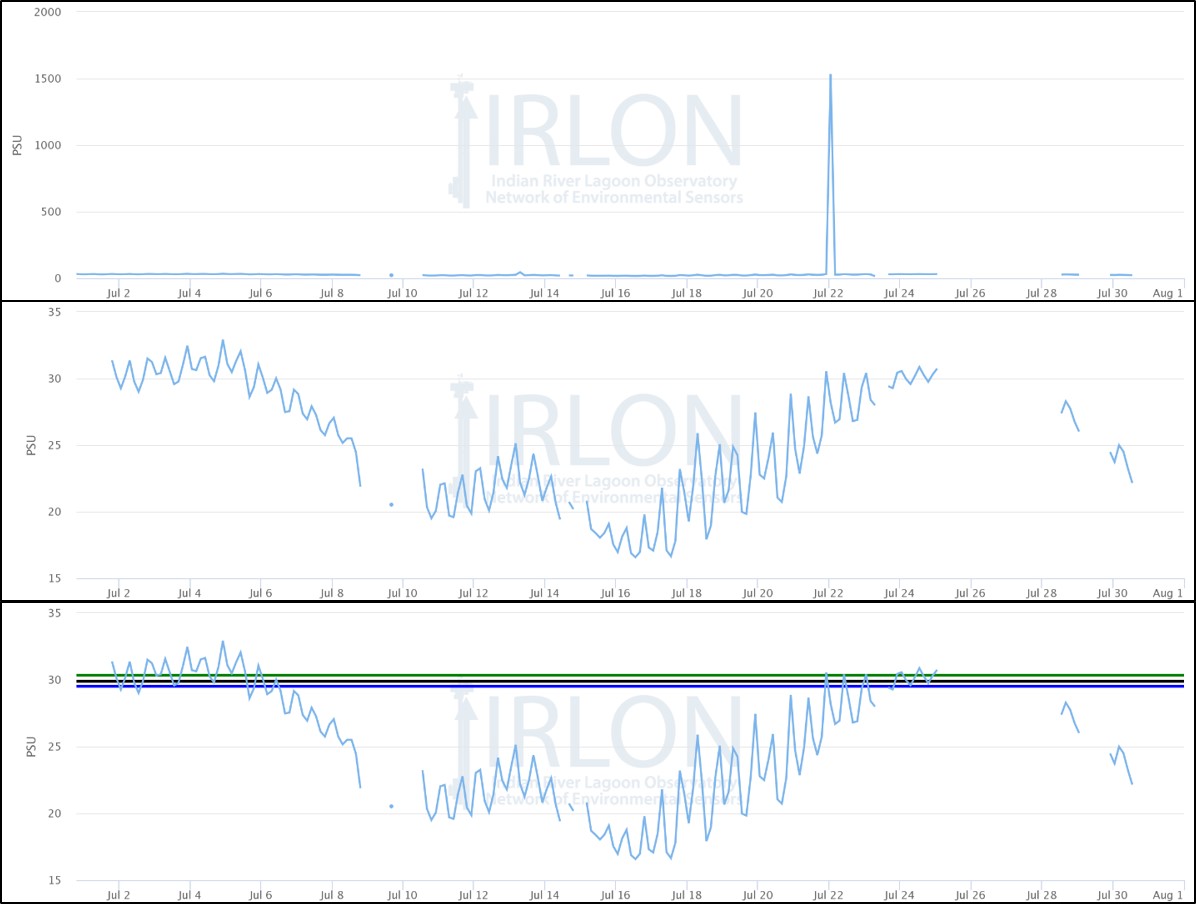
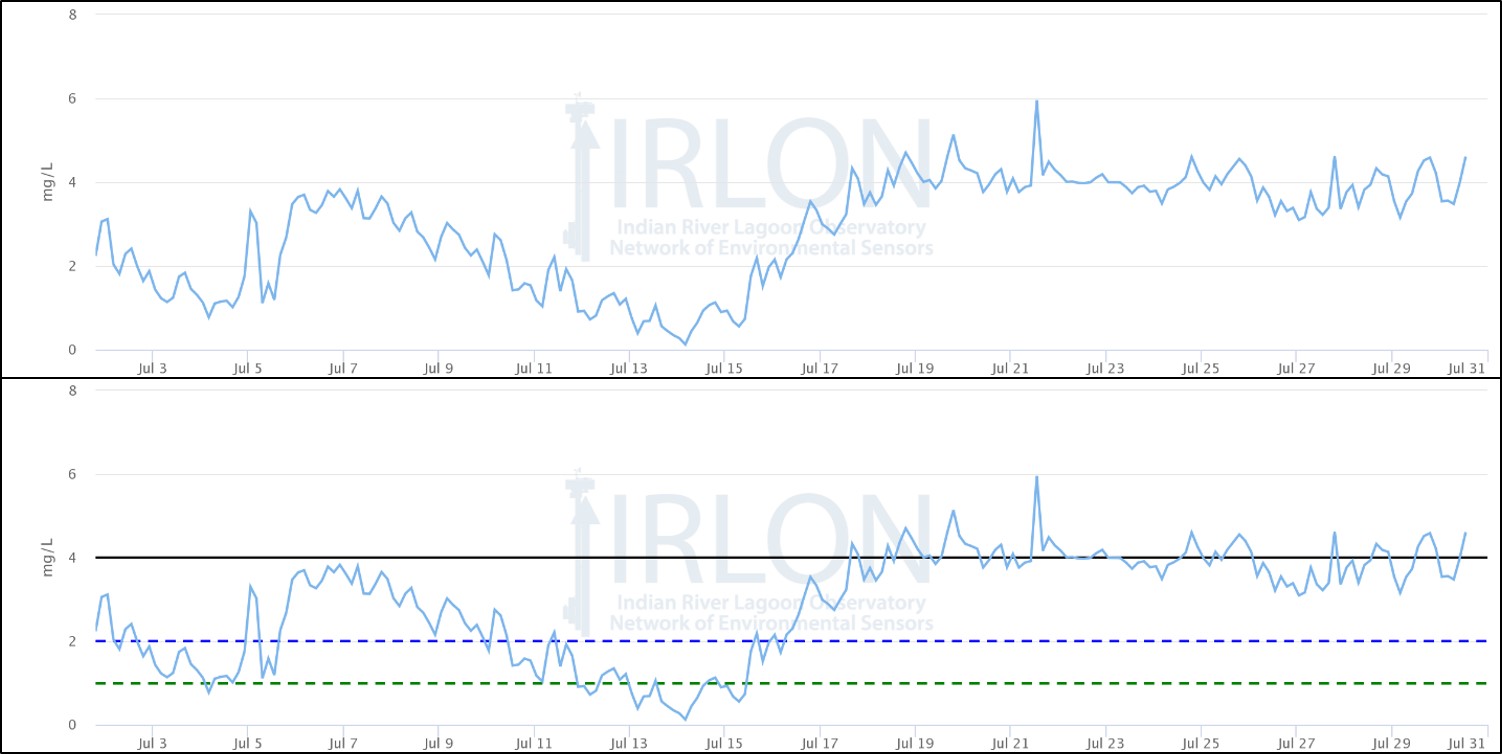
- Add new utility to the IRLON data portal that will facilitate how users can better understand the data being generated in terms of health of the Indian River Lagoon: For example, our new data portal provides reference points for key water quality parameters, including comparisons to historical data at each station and indicators of water quality stress (e.g., low dissolved oxygen levels, phytoplankton blooms). IRLON data are now also automatically undergoing data quality testing with protocols developed by QARTOD (Quality Assurance / Quality Control of Real Time Oceanographic Data) developed by the Integrated Ocean Observing System (IOOS); IRLON data users will be able to access all raw data, or those that pass all QARTOD screening. Note that by the end of August we will have transferred all of our legacy data from fau.loboviz.com to our new data portal and added QARTOD evaluations.
- Add three new IRLON stations in Brevard County: This expansion will address gaps in real-time water quality observations in the IRL overall and bring the new capabilities proposed in objective 2 to a region where no one is monitoring those parameters. Last month, we hosted an IRLON Science Technical Advisory Committee (STAC) virtual workshop to help us select sites for the new station. Highest priority was given to the northern Banana River and the northern IRL basin where brown tides have been recurring since 2012 and the Malabar/Grant area which is downstream of the freshwater inputs associated with Melbourne.

IRLON 2.0’s enhancement and expansion has been funded by HBOIF in two phases. Launching of our new IRLON portal completes Phase 1; establishing the new Brevard stations is the key deliverable in Phase 2, and we plan to have them online this winter.
Making a list of objectives is much easier than achieving them! The last 6 months (Phase 1 of IRLON 2.0) was an incredible challenge: implementing new telemetry, coding new data loggers, building a new website – all at the same time, in the midst of the COVID pandemic!! We carefully mapped a detailed pathway for the project and achieved it with tremendous effort of our dedicated IRLON staff: Kristen Davis, Jon Richardson, Haley McQueen, Chris Hoey, Scott Hurley, Ron Cloutier, and Bryan Botson. Three of them (Haley in February, Scott and Ron in April) were hired during this phase. We also benefitted from the talented expertise of Harbor Branch’s Technical Ops team of engineers and fabricators, led by Stewart Moreaux, with Csaba Vaczo the Lead Engineer. Collectively this was a tremendous team effort by many people we could not have accomplished this without them all!
Stay tune for more enhancements with our new data portal; there are some things we still would like to have done before making the portal open to all users, but with the approach of Hurricane Isaias over the weekend, we thought we should share what we have now! And please note that you can watch the advance of this storm and other weather by clicking on “Radar Imagery” and “Tropical Cyclones” under maps on the landing page (see the image above).
Enjoy!