Indian River Lagoon Observations Newsletter Archive
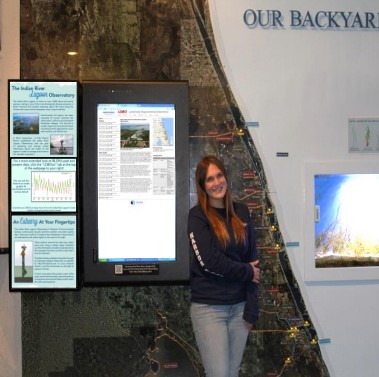
Audrey Sellepack
SUNY College of Environmental Science and Forestry, and 2017 Harbor
Branch Summer Intern
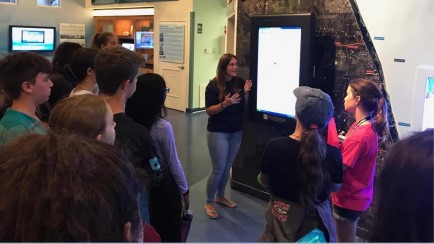
Overall, this project was a very successful experience. The ODC received positive reviews of the exhibit from visitors, and the IRLON data were effectively conveyed to the public. I was the first summer intern to conduct an outreach project at the ODC. The outcome of this exhibit shows just one example of how essential outreach is for the scientific community. During a time when our environment is constantly changing, it is important to keep the public informed on how scientists are studying that changing environment, and what the public can do to help.
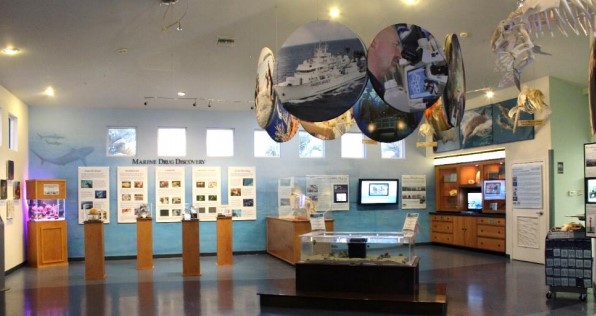
This summer, I had the privilege of completing an outreach project through Harbor Branch’s summer internship program. My position was centered at the Ocean Discovery Visitor’s Center (ODC) – a place for Harbor Branch students, scientists,and engineers to showcase their research to the public. Here, there are five exhibits, and each one displays a specific area of research. My project revolved around the Marine Ecosystem Health Exhibit. My Project Mentors were Dr. Gabby Barbarite, who leads the ODC, and Dr. Dennis Hanisak, who leads the Indian River Lagoon Observatory.
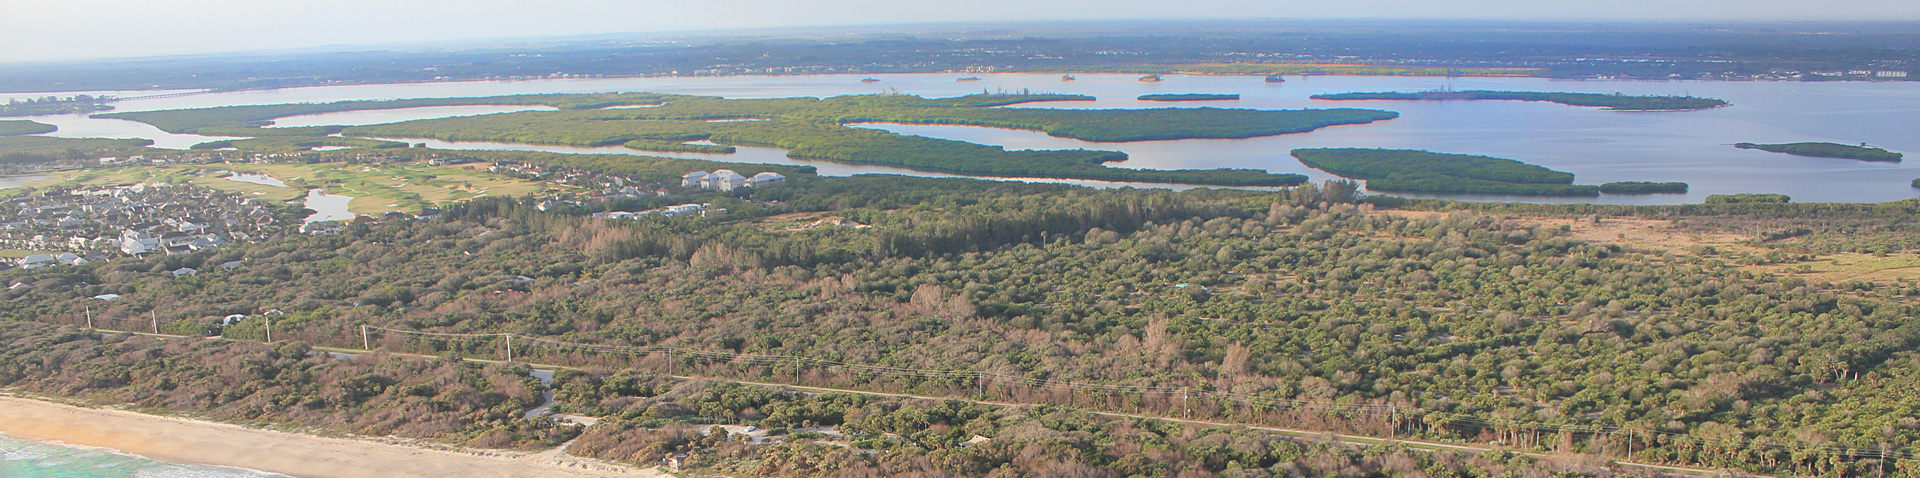
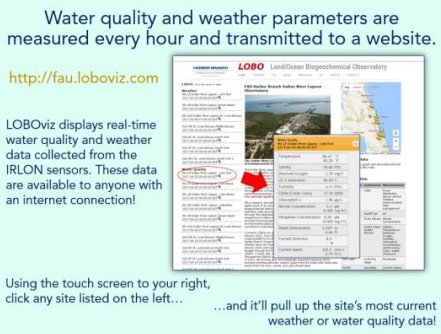
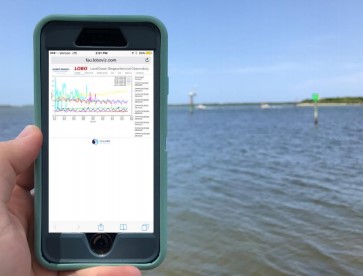
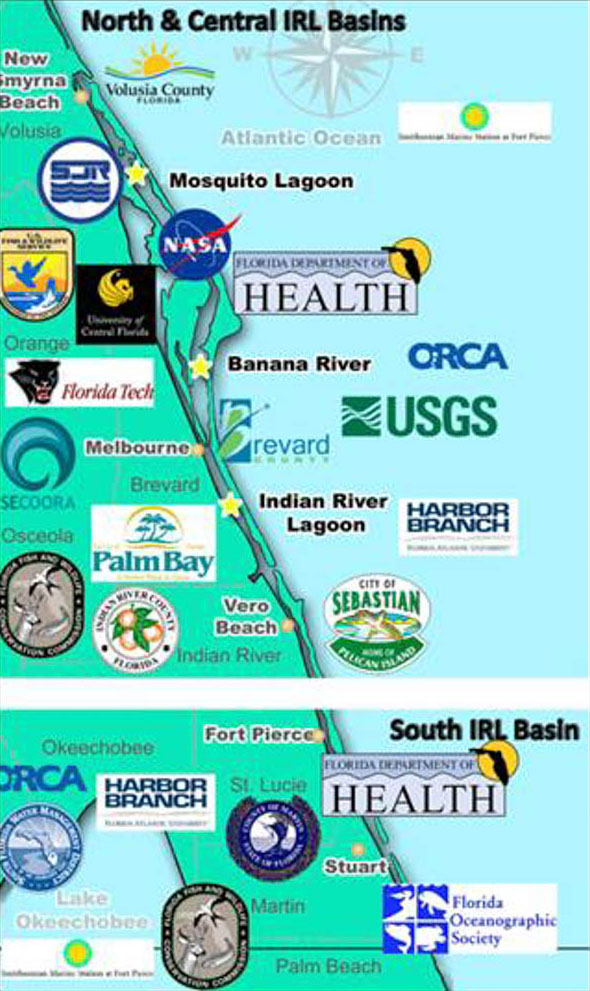
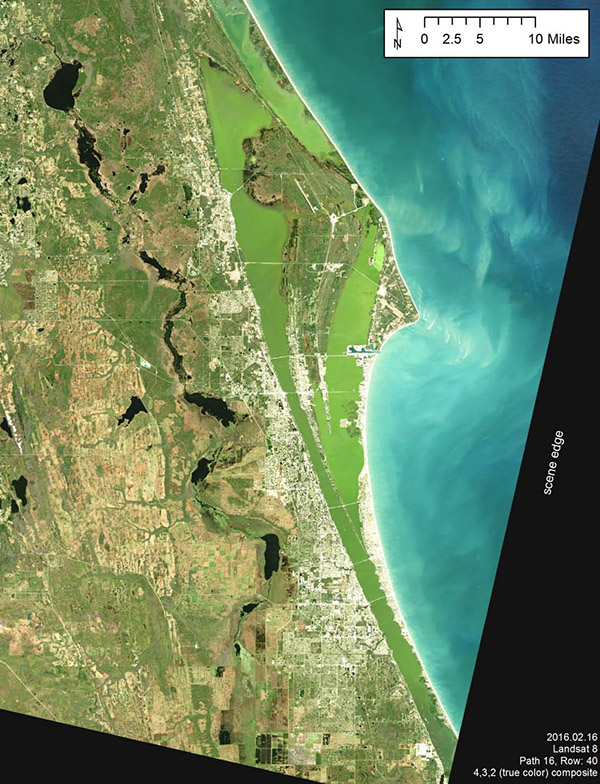
This exhibit’s primary focus is the Indian River Lagoon (IRL), a biodiverse estuary that covers around 40% of the Florida east coast. This dynamic system is constantly undergoing environmental issues due to urbanization and pollution of the watershed. In 2013, Harbor Branch established the Indian River Lagoon Observatory Network of Environmental Sensors (IRLON) to monitor some of these issues. This network contains 10 stations with water quality sensors located throughout the Lagoon from Sebastian to Stuart, and each one is transmitting real-time water quality data hourly to the IRLON data website. Some of the stations also collect atmospheric data, which can help determine the current weather at that station. The IRLON data can be very useful for both scientists and the community. Individuals can now understand the water quality of the lagoon – both in the present and how it was in the past.
The new IRLON exhibit at the ODC aims to bridge the gap between IRLON’s data and the community. Here, visitors can get an overview of IRLON, how it acquires and transmits data, and how to access it through LOBOviz. I transformed the aerial image of the lagoon into a map that allows visitors to visualize the IRL region and where the sensors are located. The final component of renovating this exhibit was to create a tutorial video showing visitors how to access and interpret IRLON’s data. If you’d like to learn more about the IRLON sensors and how to use their data to your advantage, come by the ODC for a closer look!
Kristen S. Davis, IRLON Manager
M. Dennis Hanisak, Research Professor & IRLO
Director
FAU Harbor Branch
After an exceptional dry season fraught with increased wild fires, the wet season began in earnest last week with heavy rainfall driven by the remnants of a tropical depression originating in the Pacific. The rainfall is providing much needed relief to the entire state, which has been in a drought for much of the dry season. What a difference when compared to 2016, at which point discharges from Lake Okeechobee had already been occurring for 123 days due to above normal rainfall in the dry season. Please see our Indian River Lagoon Observations, March 3, 2017 for a comparison on last year’s wet year with this year’s dry year.
During the dry season, pollutants on land accumulate on roads, parking lots, lawns, etc. so the longer the period without rainfall, the higher the concentration of the pollutants. Once the first rainfall event of the year occurs, which typically coincides with the beginning of the wet season, storm water flushes the accumulated pollutants into local waterways. This phenomenon is called the “first flush.”
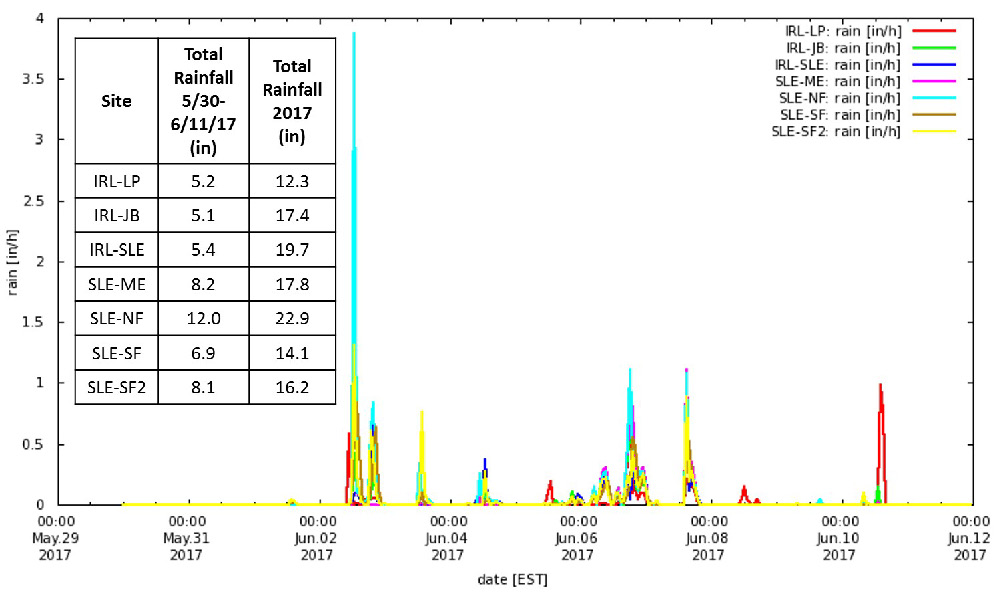
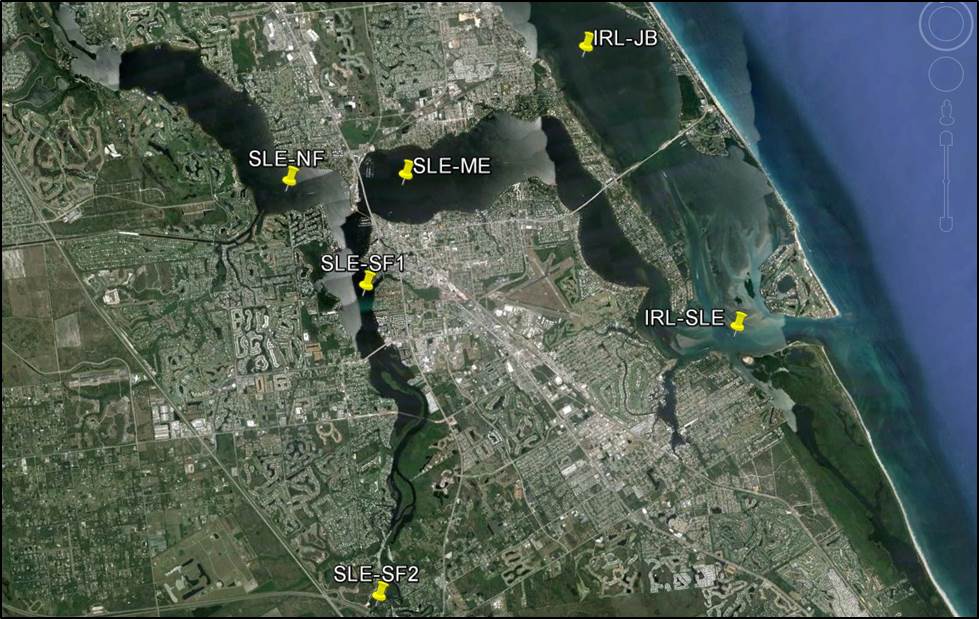
Our Indian River Lagoon Observatory Network of Environmental Sensors (IRLON) has been recording the response of the St. Lucie Estuary (SLE) and nearby Indian River Lagoon (IRL) to the first rainfall event since the beginning of the wet season. Total rainfall from the May 30 to June 11, 2017 ranged from 5.1 inches at IRL-JB near the coast to 12.0 inches at SLE-NF further upstream in the North Fork of the SLE (see Figure 1) and accounts for approximately 27 to 52% of the total year-to-date rainfall among sites.
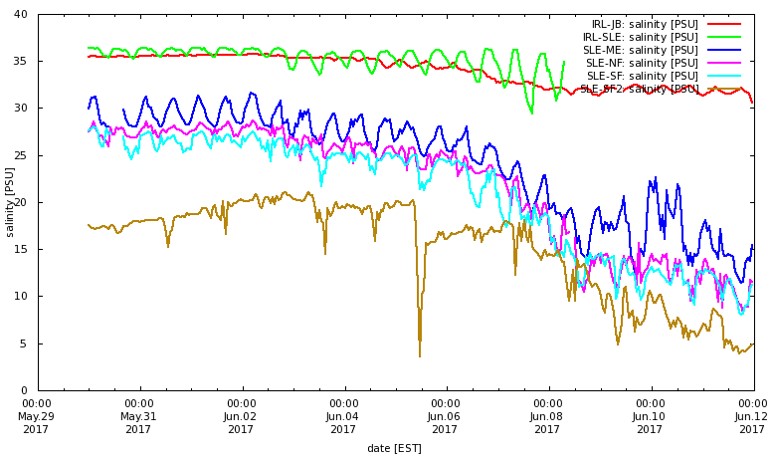
The most obvious sign of the “first flush” is reduced salinity. Salinity decreased at all sites with the greatest decrease visible at all four SLE sites. Values, which had remained stable above 20 PSU since the Lake Okeechobee releases ended in November 2016, dropped to approximately 5, 10, and 15 PSU at SLE-SF2, SLE-NF and SLE-SF, and SLE-ME respectively (see Figure 2). Salinity at the sites closer in proximity to the St. Lucie Inlet (IRL-SLE, IRL-JB) showed a minimal decrease in salinity.
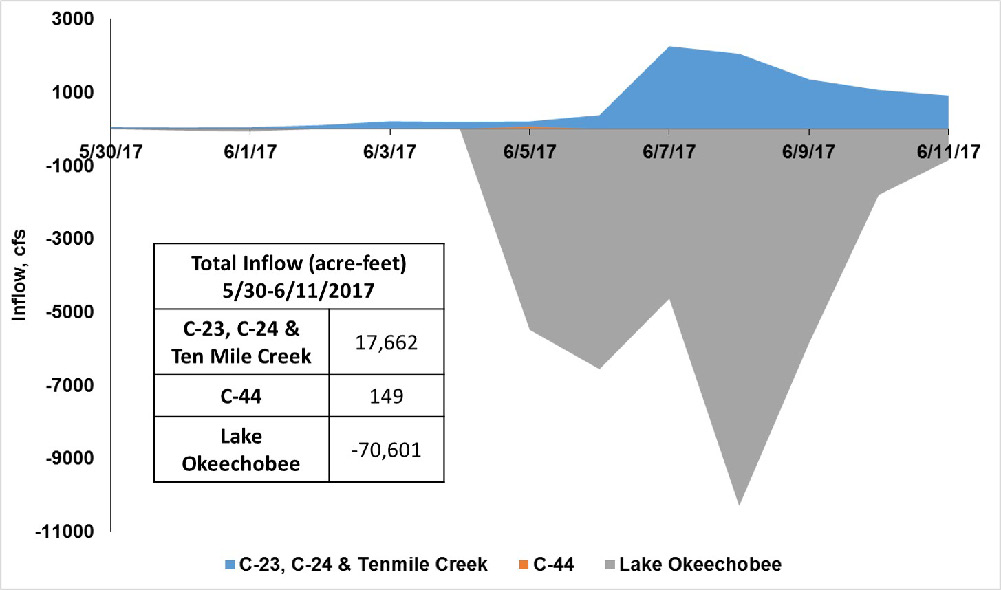
Most of the storm water into the St. Lucie Estuary flowed from the North Fork with a combined total inflow of 17,662 acre-feet from May 30 to June 11, 2017 for Ten Mile Creek, the C-23 and C-24 canals (see Figure3: Data source: DBHYDRO, SFWMD). Inflow into the South Fork of the SLE was limited to localized watershed runoff, as very minimal inflow was recorded at the St. Lucie Locks and Dam. Negative inflows recorded at the S308 lock and damn structure at Port Mayaca, indicate that runoff from the C-44 watershed is flowing back into Lake Okeechobee instead of moving east into the SLE. Note that more water is flowing back to Lake Okeechobee through these canals than what is flowing into the Estuary. Combined with other inflows, lake levels have increased more than half a foot, from 11.00 feet on May 30to 11.76 feet NGVD29 (National Geodetic Vertical Datum of 1929, a type of system for elevation comparisons) on June 11.
Reduced salinity is stressful to many plants and animals in estuaries. The severity of low-salinity stress depends primarily on how long the condition lasts. Stay tuned for any further impacts of this “first flush”on the St. Lucie Estuary and nearby Indian River Lagoon by accessing data at our IRLON website
M. Dennis Hanisak, Research Professor & IRLO Director
Kristen S. Davis, IRLON
Manager
FAU Harbor Branch
Anyone who lived along the St. Lucie Estuary in 2016 will recall the large discharges of freshwater from Lake Okeechobee which essentially converted the estuary into a freshwater system. Impacts included large blooms of cyanobacteria (blue-green algae) that led Governor Rick Scott to declare a state of emergency in St. Lucie and Martin Counties. The large amount of freshwater discharges was due to an abnormally high rainfall throughout the center of the state during last year’s dry season. The resulting runoff flowed down the center of the state via the Kissimmee River and then into Lake O. When water levels in the lake exceed a certain level, the U.S. Army Corps of Engineers releases freshwater into estuaries on both coasts of Florida, including the South Fork of the St. Lucie Estuary via the C-44 Canal.
In 2016, the freshwater discharges started on January 29, and persisted, at various rates, for 9 months. In contrast, this year we are having a more typical dry season and there have been no freshwater releases from the lake (see discharge data in the table below). Our Indian River Lagoon Observatory Network of Environmental Sensors (IRLON) is strategically located to address the impact of releases from Lake Okeechobee on the estuary (see map).
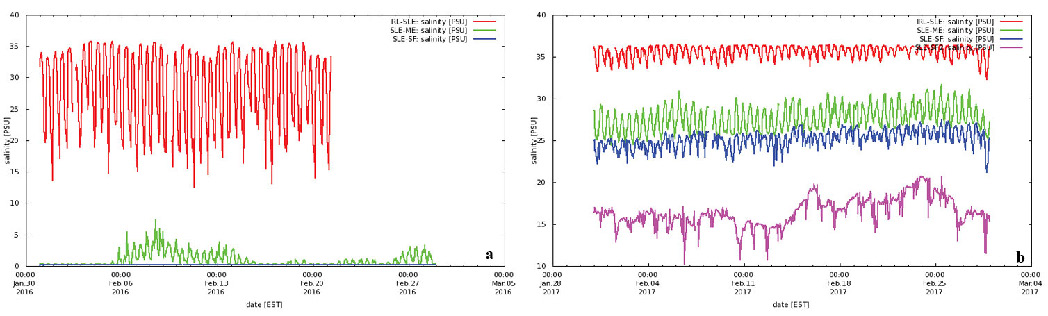
Figure 1 (a) shows salinities at three of our sites a year ago. IRL-SLE, located near the inlet, had the highest salinity, with strong tidal influences, ranging from oceanic salinity of 35, but much lower (sometime less than 15) at low tide. Meanwhile, upstream at SLE-SF, near the base of the South Fork,salinities were essentially zero, due to the freshwater flows from the lake. At times a completely freshwater environment extended all the way down to SLE-ME, our mid-estuary site near the Roosevelt Bridge in downtown Stuart; even when some saltwater was present, salinity was seldom above 5. These extended periods of reduced salinity would have been detrimental to plants and animals in the estuary that do not move, such as seagrasses and oysters, which are important resources.
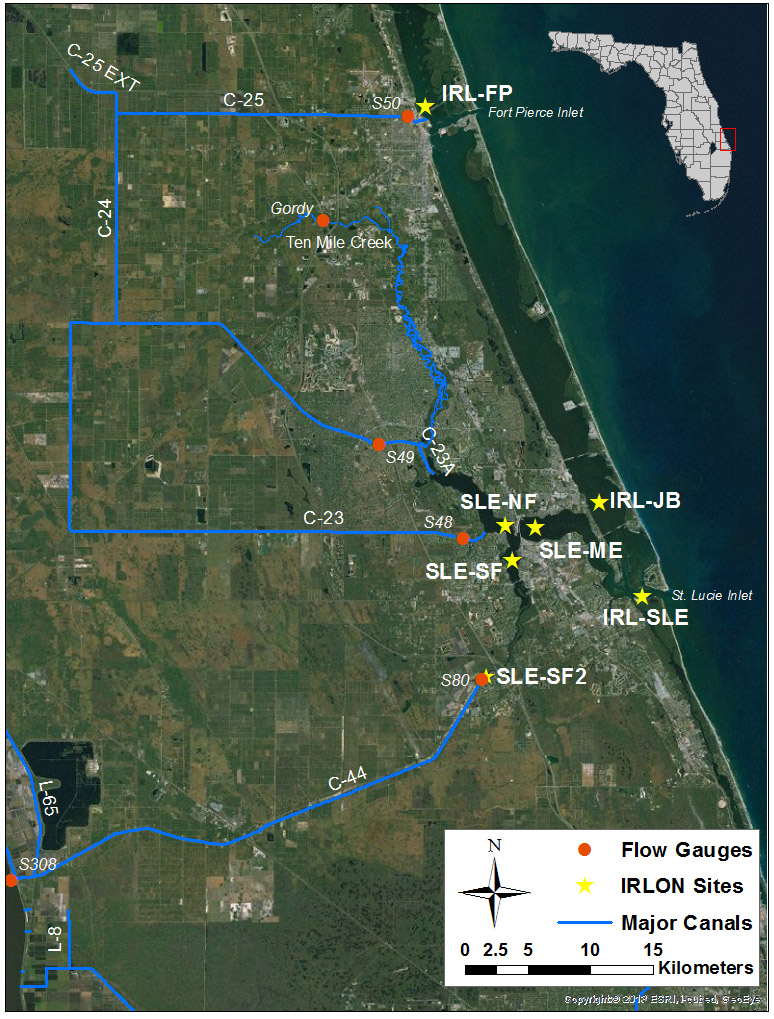
Monthly inflow (acre-feet) from major canals and discharge stations into the St. Lucie Estuary (Data Source: DBHYDRO, South Florida Water Management District). See locations in the map above.
| Source | Discharge Site | Feb-2016 | Feb-2017 |
|---|---|---|---|
| Lake Okeechobee | S308 | 217,576 | 0 |
| C-44 Canal | S80 | 227,922 | 0 |
| C23 | S48 | 19,753 | 13 |
| C24 | S49 | 23,650 | 0 |
| Ten Mile Creek | Gordy | 10,322 | 2,970 |
Figure 1 (b) shows salinities this past month. Notice that salinities at IRL-SLE, near the inlet, were higher overall, with much less variability during the tidal cycle than in 2016, resulting in a much more stable environment for more oceanic species that live near the inlet. Salinities at both SLE-SF and SLE-ME were much higher than in 2016, being in the 20’s the entire month, with tidal patterns more obvious than last year. This is quite a favorable salinity range for estuarine species compared to the freshwater environment present in 2016. Another station, SLE-SF2,came on line in April 2016 near the C-44 lock and dam which is the entry point for the freshwater releases from Lake O into the estuary. Salinities at that station were about half that of full-strength seawater, showing the degree that salt water can extend to the upper reaches of the South Fork. These data demonstrate that species such as seagrasses and oysters have a much more favorable environment this year than last.
This quick comparison of salinity, the most important factor in looking at the interaction of saltwater and freshwater in estuaries, readily reveals the magnitude (both absolute decline of salinity and spatial extent) of impacts from last year’s discharges in the St. Lucie Estuary. All of our data are readily available to anyone who wishes to access it at our IRLON data website (http://www.irlon.org/)
M. Dennis Hanisak, Research Professor & IRLO Director
FAU Harbor Branch
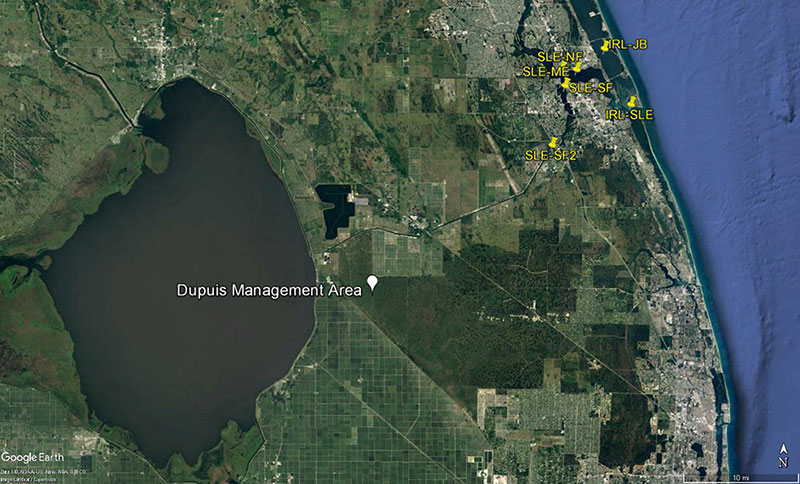
Today I had a chance to share how we use our Indian River Lagoon Observatory Network of Environmental Sensors (IRLON) with 40 high school students at the Martin County Youth Leadership Environmental Day at the DuPuis Nature Center. The nature center, once the home of John G. and Susan H. DuPuis, Jr., is located near Lake Okeechobee at the DuPuis Management Area (DMA), a 21,875-acre protected area in northwestern Palm Beach County and southwestern Martin County.
DuPuis contains a vast landscape of pine flatwoods, wet prairies, marshes, and cypress domes. The area also has a rich history. Archeological sites of native Americans date to 500 B.C. More recently the Seminoles used the DuPuis region as a refuge during the Second Seminole War of 1835-1842. Later the property was a ranch for cattle, sheep and goats. The DMA was purchased by the South Florida Water Management District (SFWMD) in 1986 through the Save Our Rivers program. FAU’s Florida Center for Environmental Studies (CES), in cooperation with SFWMD, has developed a field-based, interactive Education Program at the Nature Center that targets secondary students, teachers, adults, families, and the local community.
Earlier in the day the students had learned about water quality, the regional water flow that impacts the Indian River Lagoon, and efforts to reduce impacts, including the nearby Caulkins Water Farm project (http://www.huffingtonpost.com/christian-caballero/water-farming-an-engineering-concept-that-is-saving-fl oridas-coasts_b_7256936.html) from DuPuis educator Kim Elliott. The students also viewed Lake Okeechobee, water control structures, and the St. Lucie Canal (C-44) and took samples for phosphate analysis, one of the nutrients that has caused concerned because of its high levels in our freshwater systems and estuaries.
My job was then to discuss with the students how the freshwater they saw in the morning can move into and impact the St. Lucie Estuary and Indian River Lagoon. I told them about IRLON and we went online to look at our current and archived data. They enjoyed pointing their brief sampling effort into a bigger picture. They had many questions and we had a very nice time together.
I don’t know how many of these students might go on to careers that one way or another involve Florida’s water resources … maybe some will. But I do know that anyone who grows up living in Florida needs to understand the importance of water – fresh and salt – to our quality of life and our economy and how what we do on land impacts the quality of our resources. I think hands-on activities like what these students did today at Dupuis will help make them life-long stewards of water resources and the environment. Kudos to Kim Elliot and the rest of the CES staff for their excellent work with Florida’s next generation!
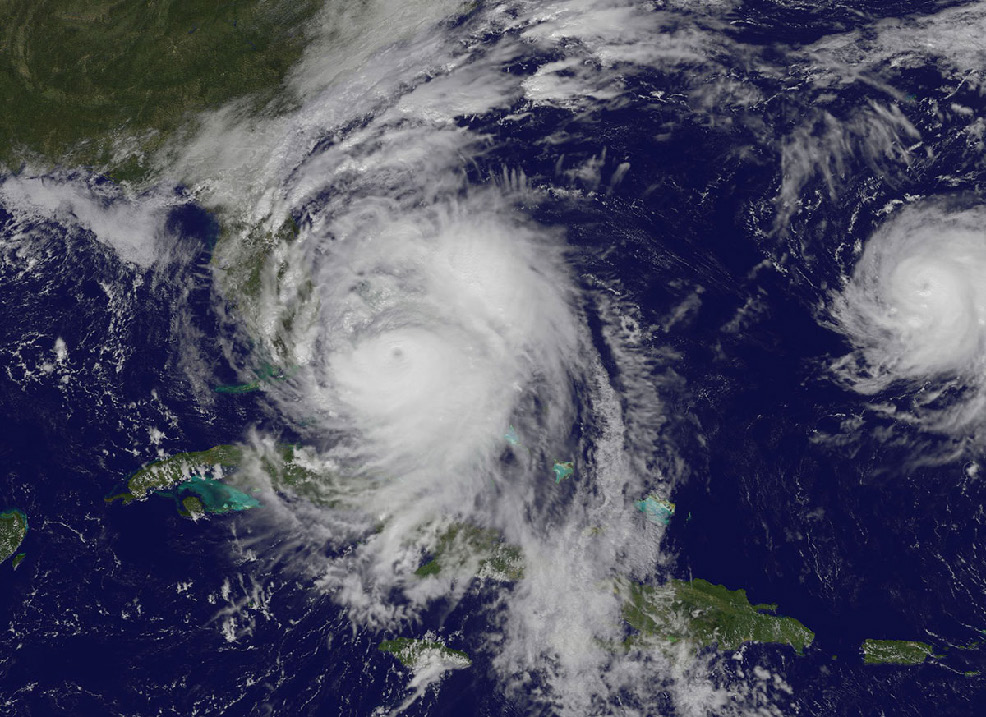
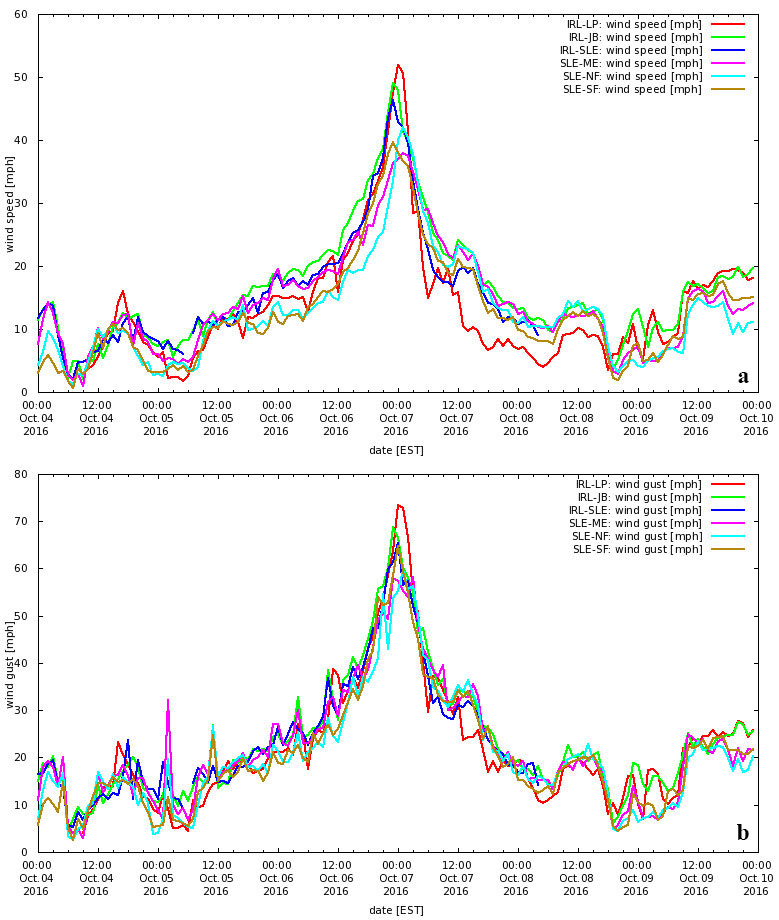
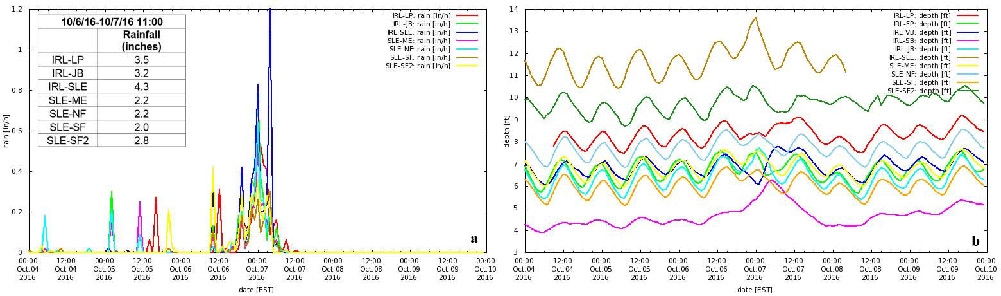
M. Dennis Hanisak, Research Professor & IRLO Director Kristen S. Davis, IRLON Manager FAU Harbor Branch Hurricane Matthew made a historical visit to the southeastern United States this past week. Matthew was briefly a Category 5 hurricane, the first one in the Atlantic since 2007. For about two days, it appeared that it would hit our part of the east Florida coast as a Category 4 hurricane that would have resulted in catastrophic damage and significant loss of life. But a last-minute small turn or “wobble” as it approached the coast resulted in our Treasure Coast receiving only moderate tropical storm conditions. Matthew continued north, making landfall in South Carolina as a Category 1 hurricane with historically high storm surges that caused extensive flooding in the Carolinas. Here on the Treasure Coast the Indian River Lagoon Observatory Network of Environmental Sensors (http://fau.loboviz.com/) (IRLON) captured the strong winds and heavy rain from Matthew as it moved northward from Stuart to Sebastian on October 6 and 7. Sustained winds increased from approximately 20mph on October 6 before increasing up to 50 mph at the peak of the storm in the early hours of October 7 (Figure 1 a). Maximal sustained winds were highest at IRLON sites closer to the coast with 51.8, 46.4 and 49.0 mph recorded at IRL-LP, IRL-SLE and IRL-JB respectively. SLE-ME, SLE-NF and SLE-SF in the St. Lucie Estuary measured maximal sustained winds ranging from 37.9, 42.1 and 39.6 mph respectively. During that time, maximal wind gusts ranged from 58.0 at SLE-ME to 73.4 mph at IRL-LP (Figure 1 b). We did not receive as much rainfall as had been predicted and it varied considerably among our sites, with total rain ranging from 2.0 inches at SLE-SF to 4.3 inches at IRL-SLE (Figure 2 a). To put that in perspective, we recorded much more rainfall in an event in September 2015 with a maximal one-day rainfall of 9.6 inches (see Indian River Lagoon Observations, May 26, 2016).
There was much concern in advance of the storm of potential storm surge along our coast. Fortunately, Matthew stayed offshore and moved quickly away. Storm surge in the IRL and SLE was minor (Figure 2 b),and only observable (about 1-1.5 foot) at sites near two of the inlets: St. Lucie Inlet (IRL-SLE) and Sebastian Inlet (IRL-SB). Storm surge was probably higher at our local beaches, as the lagoon is protected by the barrier island. But residents along our estuaries did not experience any surge, unlike the 2004 twin hurricanes where many shoreline residents experienced substantial flooding. In terms of water quality, we did see all of the expected short-term impacts, such as reduced salinity (due to the rainfall and runoff) and high turbidity (due to the winds stirring up the sediments and some erosion).The greatest impact is likely to be felt in the St. Lucie Estuary (SLE), as rainfall from Matthew all the way up to Orlando is draining down the Kissimmee Basin into Lake Okeechobee. Discharges from the lake into SLE that started in January have now exceeded 200 billion gallons and may very well continue for the rest of this year, as will the impacts on our local estuaries.
M. Dennis Hanisak
Research Professor & IRLO Director
FAU Harbor Branch
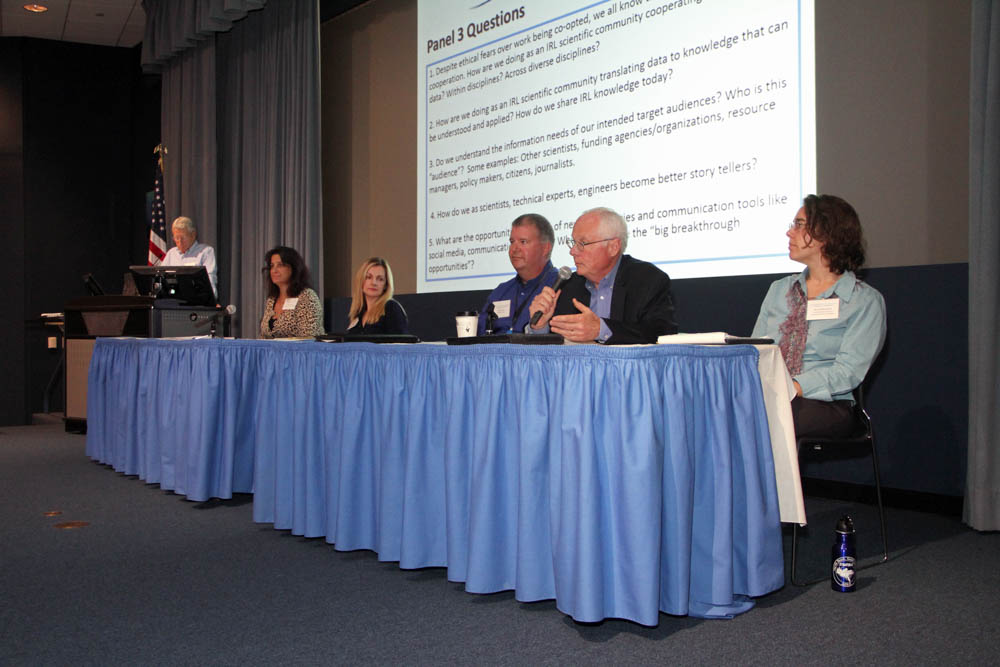
Today I gave an invited presentation to the IRL Council Board of Directors which manages the Indian River Lagoon National Estuary Program. (http://www.irlcouncil.com/) The main focus of my talk was to report on Indian River Lagoon Observatory’s Connecting Users to IRL Data Initiative. Good timing, as I had just picked up the first batch of printed copies yesterday! So my talk became the official release of that report.
The Connecting Users to IRL Data Initiative. examined how IRL scientific data are collected, translated and shared with users and how to improve those processes. We convened a workshop on December 7-8, 2015, at Harbor Branch, with primary financial support from the Harbor Branch Oceanographic Institute Foundation, Inc., and River Branch Foundation. Participants represented federal, state and local agencies, academia, non-profit entities, elected officials and the business sector, and included estuarine scientists, urban planners, weather forecasters, resource managers and educators.
The initiative also included a pre-workshop online survey to help define how we collect, use, translate and share data for the Indian River Lagoon. More than 95 data collectors and/or users completed the survey, revealing what data are available and what new pathways (e.g., social media, web publishing, file sharing and storage) will allow more effective data sharing and dissemination to end users. The survey results and future outcomes of this initiative are available here.
This workshop was the first organized effort to answer, where is IRL data housed? What types of data are collected? How are we using the data? And can we do a better job at collecting, organizing, translating and sharing the data? We need to answer these questions. If we do, then we may be able to understand how we can all work better together to share the knowledge and make changes in how we manage the Lagoon in the future.

Here are the consensus recommendations of the workshop:
1. Work collaboratively to
obtain the funding needed to maintain long-term data collection programs to meet
scientific demands
2. Use scientific data to identify pollution source locations
in the IRL watershed and stop the flow of pollution into the Lagoon
3. Identify
and maintain an inventory of historic and ongoing IRL data sets
4. Increase
efforts to archive IRL data sets and make them accessible to users
5. Organize and
maintain a centralized listing of available IRL data sets and information on how to
access them
6. Develop observation and prediction systems as tools that can be
used by a variety of user groups
7. Identify threshold levels for critical
environmental IRL data parameters and develop a way to automatically trigger flags when
a threshold is exceeded
8. Process and translate the science data to inform and
engage the community
The whole report is available here.
We will be moving forward on converting these recommendations, working with many others in the IRL community. Next steps include:
1. Initiate a listing of IRL data sources and data stewards and post on our IRLO website
2. Utilize IRLNEP’s Science, Technology Engineering and Modeling Advisory
Committee (STEM AC) to advance and implement the consensus recommendations and to
develop a long-term plan for IRL monitoring and research
3. Work with other
estuarine researchers to develop national standards for data acquisition, QA/QC, and
management
4. Inform and engage the community: tell more stories that are
meaningful!
5. Work with other IRL stakeholders to develop a substantial, stable,
recurring source of funding to support the long-term monitoring needed to properly
manage the Lagoon
Stay tune for progress on this initiative!
M. Dennis Hanisak
Research Professor & IRLO Director
FAU Harbor Branch
During the past week, the blooms in the St. Lucie Estuary (SLE) of cyanobacteria, also called blue-green algae, have increased to the point that today Governor Rick Scott declared a state of emergency in St. Lucie and Martin County.
All algal blooms require favorable light, temperature, and nutrient conditions. Cyanobacteria particularly grow well at warmer temperatures and higher light levels, such as what we have in the summer. As to nutrients, the most important ones for algal growth are nitrogen and phosphorus. Unfortunately our aquatic environments are increasing becoming too rich in nitrogen and phosphorus due to a number of our human activities.
The origin of these blooms is Lake Okeechobee. This year the center of the state, which drains into Lake O,experienced quite high rainfall – the “dry season” this past winter was abnormally wet. So, along with the water that flowed into the lake, there also were large amounts of nitrogen and phosphorus. As favorable light and temperature conditions arrived, cyanobacteria, primarily Microcystis aeruginosa , bloomed in the lake. That same abnormally high rain pattern led to the large amounts of water released from the lake by the U.S. Army Corps of Engineers via the C-44 Canal into the South Fork of the St. Lucie Estuary. These releases are made to lower lake levels in preparation for hurricane season. This bloom is adding to the tremendous impact of the freshwater on the SLE.
We know that these cyanobacteria may contain toxic compounds, which can adversely affect aquatic organisms and even humans that are exposed to them. But much is unknown about the fate of these algae and their toxins once they are in the estuary. While we understand what triggers these blooms, we don’t really know how they are sustained in the estuary. This year the cyanobacteria are surviving longer than expected throughout the estuary, in part because of the greatly reduced salinity due to the high discharges of freshwater. But as the algae use up the available nutrients, where do they get more to sustain their growth?
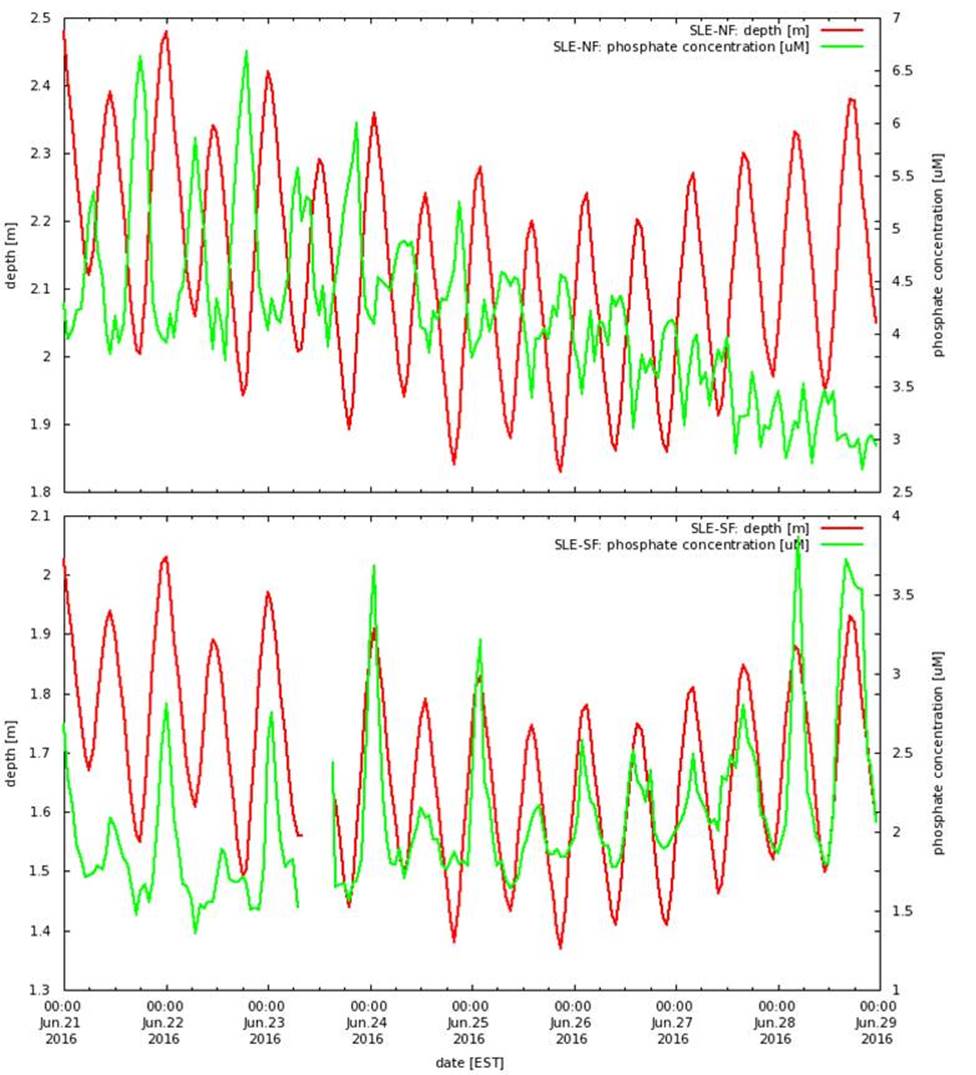
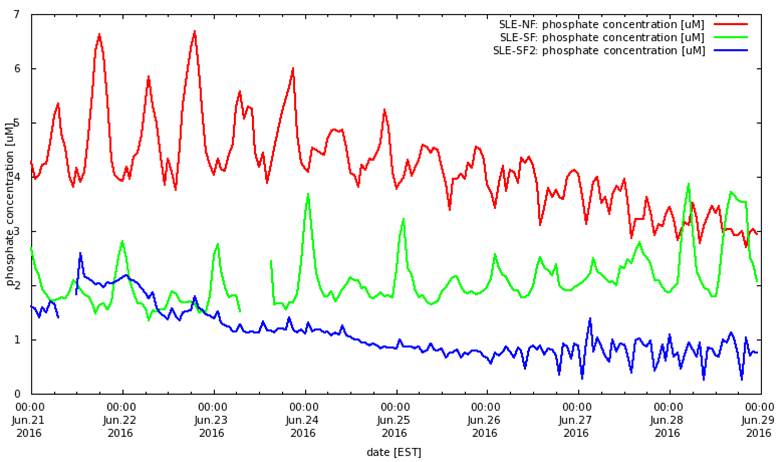
Our IRLON phosphate data strongly indicate that the bloom may be sustaining itself in the SLE with nutrients from the rest of the watershed that drains into the estuary. This evidence can be seen by looking at the phosphate data. Phosphate concentration is much higher in the North Fork (SLE-NF) than in the South Fork (SLE-SF), which is higher than in the water coming from the C-44 Canal (SLE-SF2). Phosphate levels are clearly related to circulation and tide. Phosphate is highest at low tide in the North Fork (SLE-NF) and highest at high tide at South Fork (SLE-SF). At low tide, water from the phosphate-rich North Fork flows into the South Fork and Middle Estuary near Stuart, maintaining the bloom far beyond what would be expected.
We will continue to gather supporting data for this hypothesis which will be used to better model the SLE and for water managers to most effectively address the current need to discharge Lake O water into the estuary. What, for example, would happen, if these large discharges were not done on a continuous basis, but in pluses (e.g., two weeks on, two weeks off)? Would that better flush the cyanobacteria out of the system quicker, and without enhancing the bloom in the estuary?
Kristen S. Davis
IRLON Manager
FAU Harbor Branch
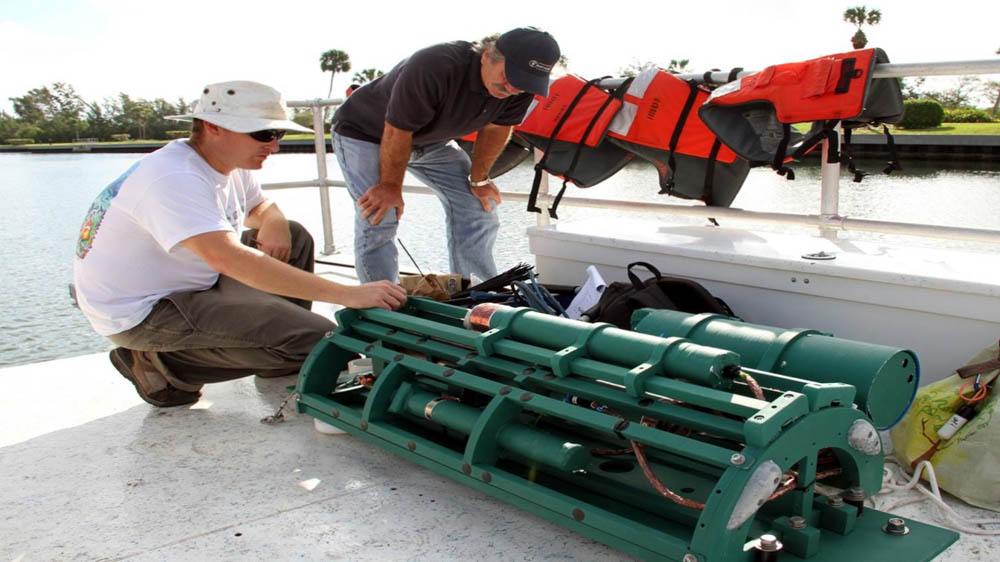
Barnacles and oysters, and bryozoans, oh my! Welcome to the wonderful world of biofouling, or more specifically the biofouling of in situ water quality instrumentation we use in IRLON. Biofouling is the unwanted growth of organisms on submerged structures. Biofouling organisms serve an important role in estuarine environments by improving water clarity, providing nursery habitat as well as a food source for other species.
Despite the benefits biofouling organisms have on the estuary, they are the biggest challenge facing long-term water quality monitoring. Biofouling can degrade sensor performance by growing atop optical windows and preventing flow through instrumentation. The rate of biofouling changes throughout the year with peak growth typically in the wet summer season when temperatures are higher and salinities are lower.
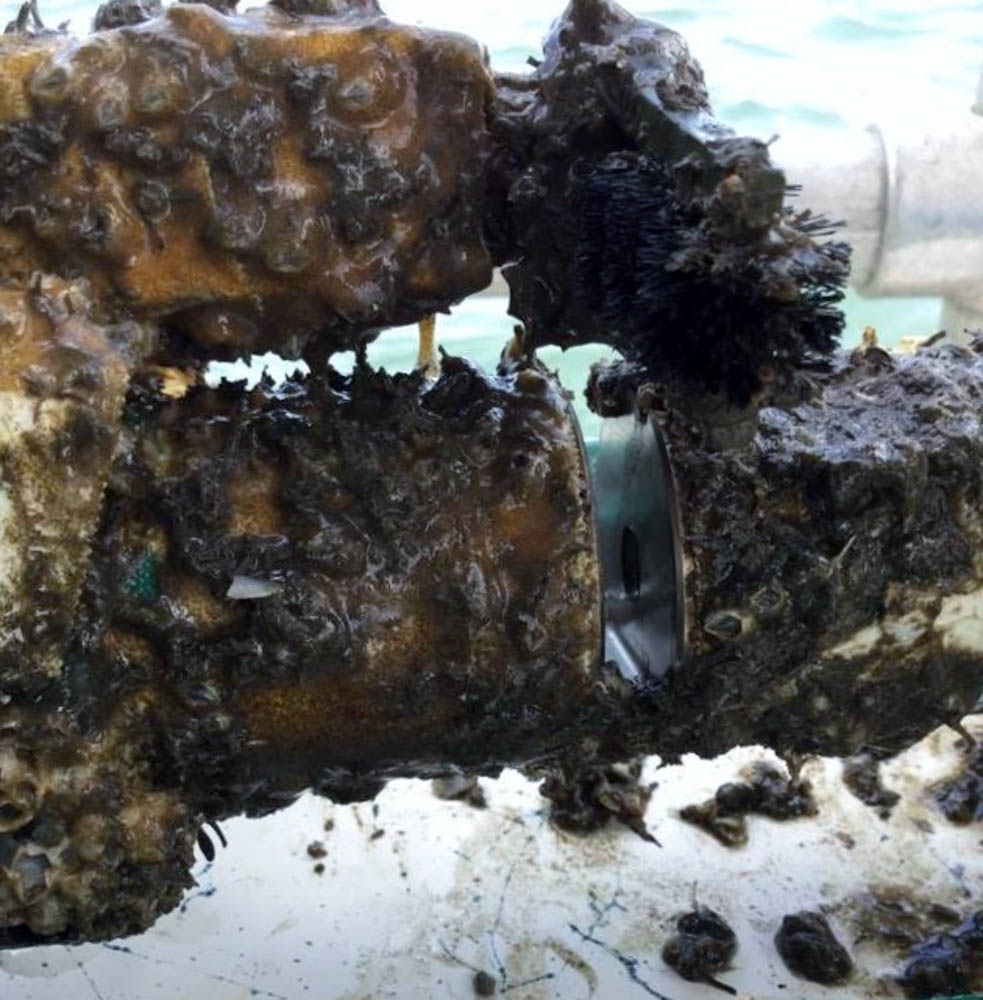
IRLON’s approach to combat biofouling is multi-tiered. LOBO instrumentation was selected for use in the IRL and St. Lucie Estuary based in part on its combination of active and passive anti-fouling capabilities. For example, the water quality monitor (WQMx) has copper cladding and a wiper that rotates over the face of the optics window before every measurement. Each instrument is wrapped in copper tape, and the LOBO cage is painted with anti-fouling paint before the instruments are attached.
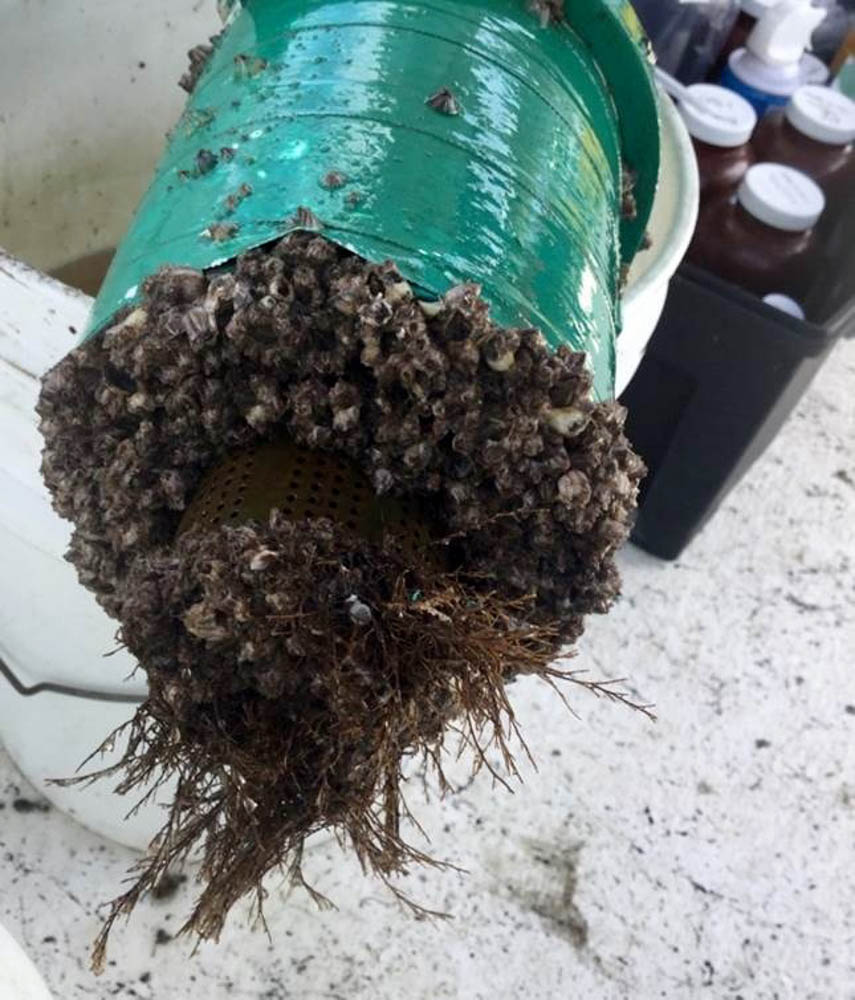
Even with all of the preventative measures, biofouling organisms still find ways to colonize the LOBO units,and that is where our field team comes into play. Led by IRLO Technical Coordinator Jon Richardson, the IRLON team visits each site every three weeks to retrieve the LOBO and perform continuing calibration verifications, both before and after cleaning has been performed. These protocols help us to determine the extent of drift that has occurred because of biofouling.
During the four-hour site visit, typically at least one of the three person-team removes biofouling organisms from the LOBO instruments and cage. So whoever draws the short straw is the designated barnacle scraper for the day, right? This is not typically the case due to the unusual IRLON phenomenon of “the zen of barnacle scraping” that allows even the most frustrated team member to achieve a level of calm! Namaste.
M. Dennis Hanisak
Research Professor & IRLO Director
FAU Harbor Branch
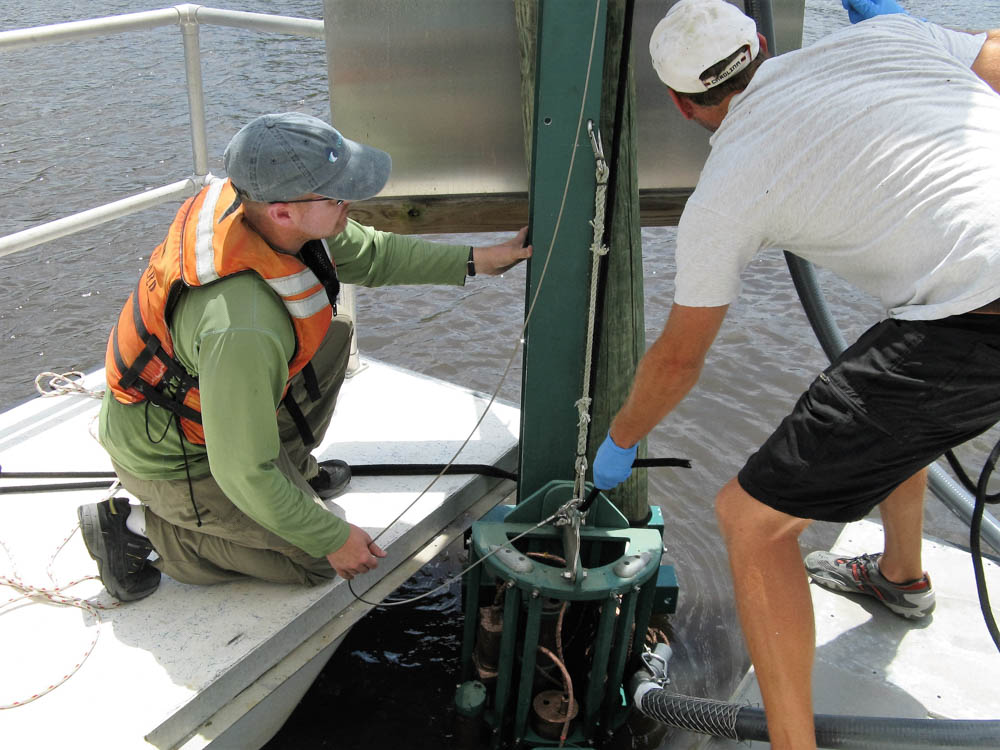
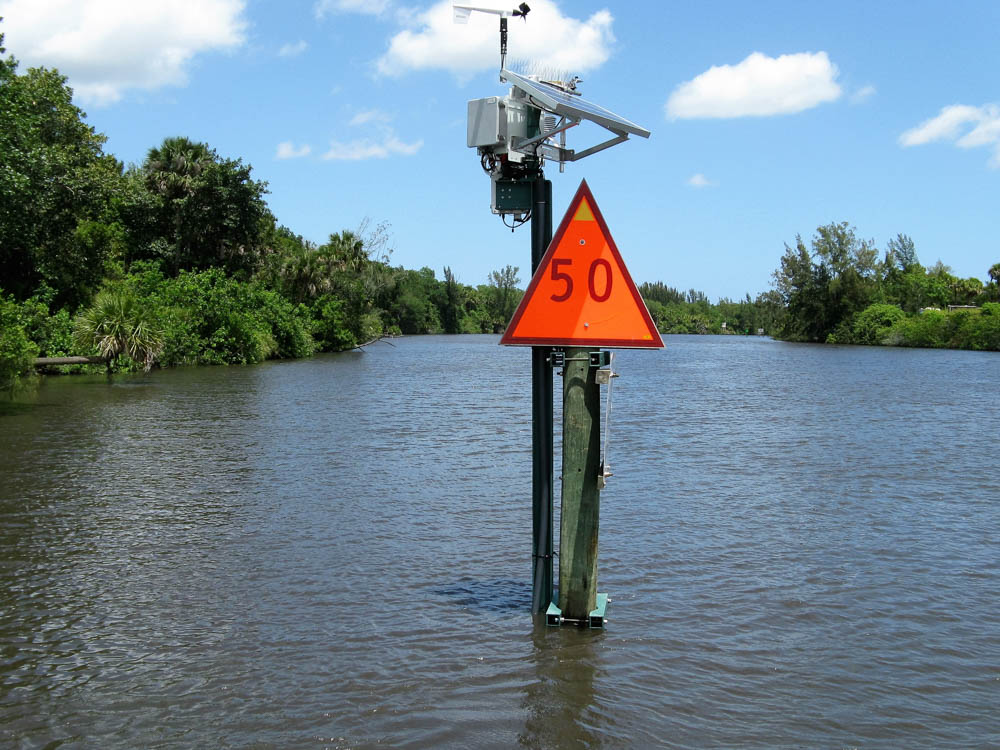
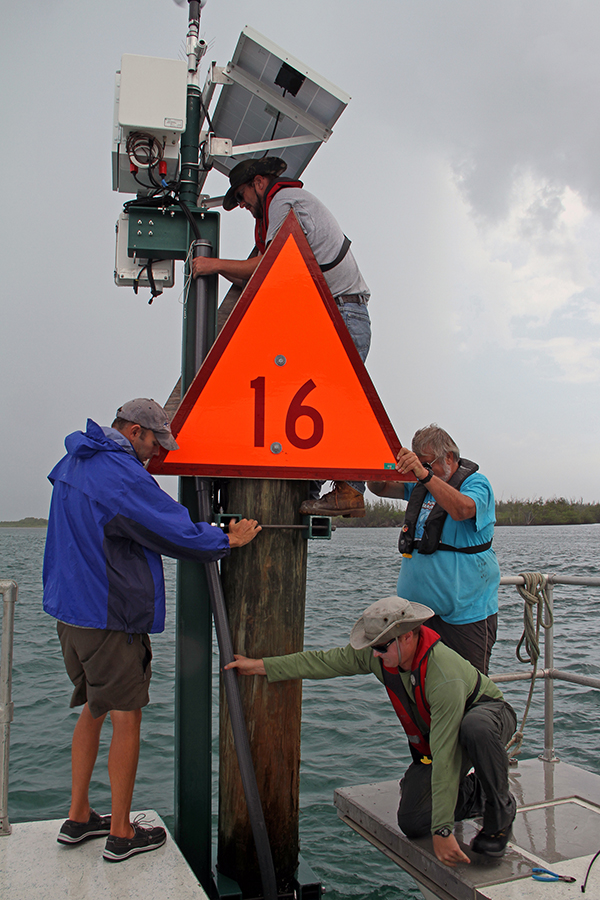
Today our team installed our tenth station in the Indian River Lagoon Observatory Network of Environmental Sensors (IRLON). This one was a long-time coming, as I first wrote the proposal for this site back in 2013 to the South Florida Water Management District’s St. Lucie River Issues Team. (http://www.sfwmd.gov/portal/page/portal/xweb%20protecting%20and%20restoring/St. Lucie) The Issues Team is a collaborative group of federal, state and local governments, and agricultural and environmental organizations. Its goal is to accelerate and implement "ready-to-go" projects that provide immediate results toward improving water quality and ecosystem functions in the St. Lucie Estuary and Indian River Lagoon. We hope this station, as well as our whole network, will contribute to that important goal.
The funding for this project became available in 2015. At that point, we knew where our other sites in the St. Lucie Estuary (SLE), funded though the Florida Department of Environmental Protection, would be. And we also had a recommendation by the IRLO Science and Technology Advisory Committee as to where our tenth site should be: in the C-44 Canal near the locks that control freshwater discharges into the South Fork of the SLE. This would allow us to determine the short- and long-term impact on the estuary of those discharges, which vary tremendously from year to year. Today we are deploying a sophisticated instrumentation package, consisting of a Land/Ocean Biogeochemical Observatory (LOBO) unit and weather sensors, to provide real-time, high-accuracy and high-resolution water quality/weather data (for details of what we will measure, see our IRLON page).
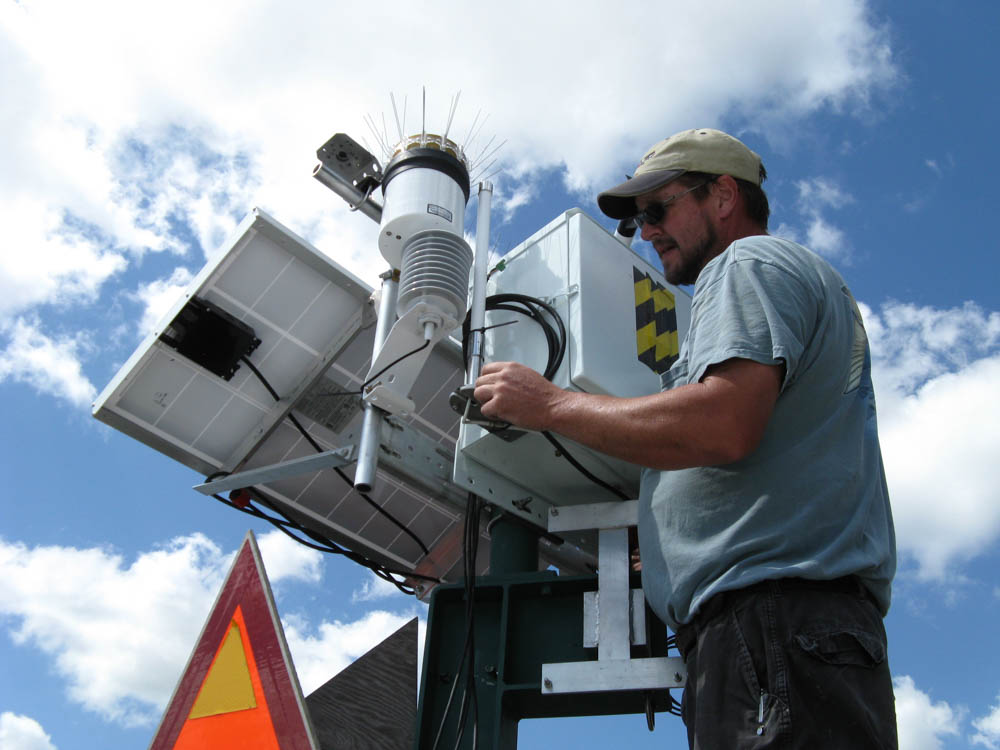
Deploying our instrumentation at a site takes much preparation. Once the order goes into the vendor, we have about four months before receipt. During that time, we select the exact location of the site and working with the Coast Guard for permission to use one of their navigation markers for our instruments. For this new site, SF-2, LOBO Manager Kristen Davis, Engineer Ben Metzger, and I did that on November 21, 2015. We carefully took various measurements that Ben would use to design our installation plan, including Coast Guard approval. We thought we were all set with our first choice of site, but the Coast Guard wisely advised us that there were some challenges there, and we quickly settled on a Plan B, Marker50, which is in sight of the lock itself.
Once the equipment is received, part of our IRLO team tests it, while others work on fabricating what is needed for its deployment. Our last test is always done in the Harbor Branch Channel, which is quite convenient. When we are totally satisfied that the instrumentation is good to go, five of us work together on the deployment, which takes several hours, including testing to make sure that the data being collected is being received by the computer server from which anyone can look at the data (to link to our data, go to http://www.irlon.org/) .
Today went very smoothly! Key reasons for that: excellent planning by the whole team, and the expertise and team work today of our engineers and fabricators (Ben and Machinists Dave Bourdette and Jeff Smith) and Jon Richardson, our IRLO Technical Coordinator, responsible for all day-to-day field ops for IRLON. I was thankful to be a small part of the highly skilled team we have, and delighted that all went well!
Moving forward here are some of the questions this new site will help us address:
- How do freshwater discharges and watershed runoff impact water quality in the IRL
and SLE?
- What is the nutrient (nitrate, phosphate) load?
- What is the impact on light attenuators (turbidity, water color, chlorophyll) on seagrass?
- What is the relationship to algal blooms?
- How does water from these freshwater discharges interact with oceanic water flowing through the inlets?
And if you want to see what this site looks like, take a look at the great video below by another talented member of our IRLO team, John Hart, shot on the maiden voyage of the MARBOT drone!
M. Dennis Hanisak
Research Professor & IRLO Director
FAU Harbor Branch
April is my favorite month of the year. One of the reasons is that it is now spring, the time of year when nature starts a new cycle. In Florida that means we are nearing the end of our dry season. The days are growing longer, the temperature is warming. The days are usually quite nice, with lots of blue skies and sunshine. On land, new growth is obvious on our oak trees. In the Indian River Lagoon (IRL), this is the time when seagrasses, organisms that I spend a lot of time working with, are most productive.
I have never been one for “spring cleaning”. But in my lab this year, we decided that it was time to spruce up our website, starting with the Indian River Lagoon Observatory (IRLO for short). IRLO is now in its fifth year. We have been quite busy … in the field, in the lab, and on our computers … developing a better way to conduct research and connect our scientific ambitions to better understand how the IRL works with the growing need to better manage this precious resource, critical to the life style we who live nearby all enjoy.
IRLO is an environmental observatory. Scientists use astronomical observatories to watch and to study the stars and planets. The goal of our observatory is to acquire and disseminate data and knowledge on the IRL critical to its ecological function and sustainable management. We have described our current research in the rest of our website. One thing we want to initiate this spring is a series of regular blogs: communications about our activities, experiences, and reflections about the IRL and our research on it – observations from our observatory, if you will.
We are launching this effort now after building a strong platform to make observations on and from the lagoon and because the need to share our thoughts is more pressing now than ever. Since 2016 began, in the northern IRL, there have been renewed outbreaks of algal blooms that first began in 2011; that these blooms are occurring in the winter, rather than spring-summer as in the past is troubling, as it may suggest that a phase shift in the system may be underway. Already there has been a massive fish kill in Brevard County. Meanwhile, to the south, Lake Okeechobee discharges similar to those that occurred in 2013 with devastating loses to seagrass beds, oyster reefs, and other resources in the St. Lucie Estuary (SLE) and nearby IRL have been underway for more than two months. Like the blooms to the north, these discharges are occurring much earlier in the year than usual due to the record “dry season” rainfalls in the Lake Okeechobee, SLE, and IRL watersheds.
We hope that our observations on these and other phenomena will be helpful to all who read them. Our research team is out on the lagoon multiple times each week. We are out there doing our work, but also have time to reflect on other things we see, too. As Yogi Berra, the legendary baseball player known for pithy and paradoxical quotes, said, “You can observe a lot by just watching”. Don’t quote me, but I am pretty sure Yogi said that during spring training! We hope you find our observations interesting and helpful.