Ocean Current Profiling

Ocean Current Profiling
Richard Peterson

About Me
Slide includes image of Richard Peterson on a boat
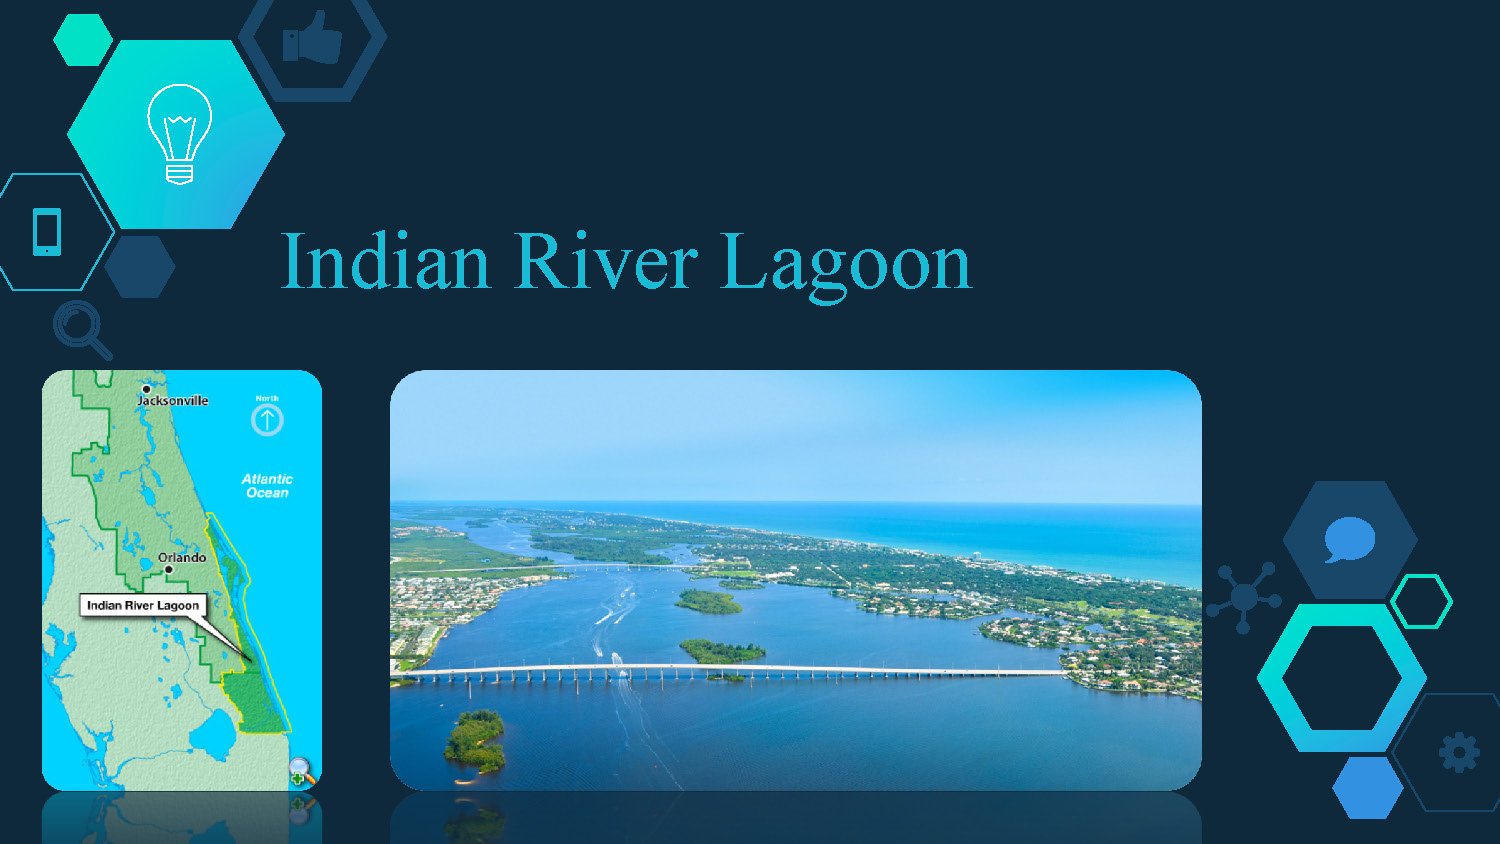
Indian River Lagoon
Slide shows a map and a photo of Indian River Lagoon
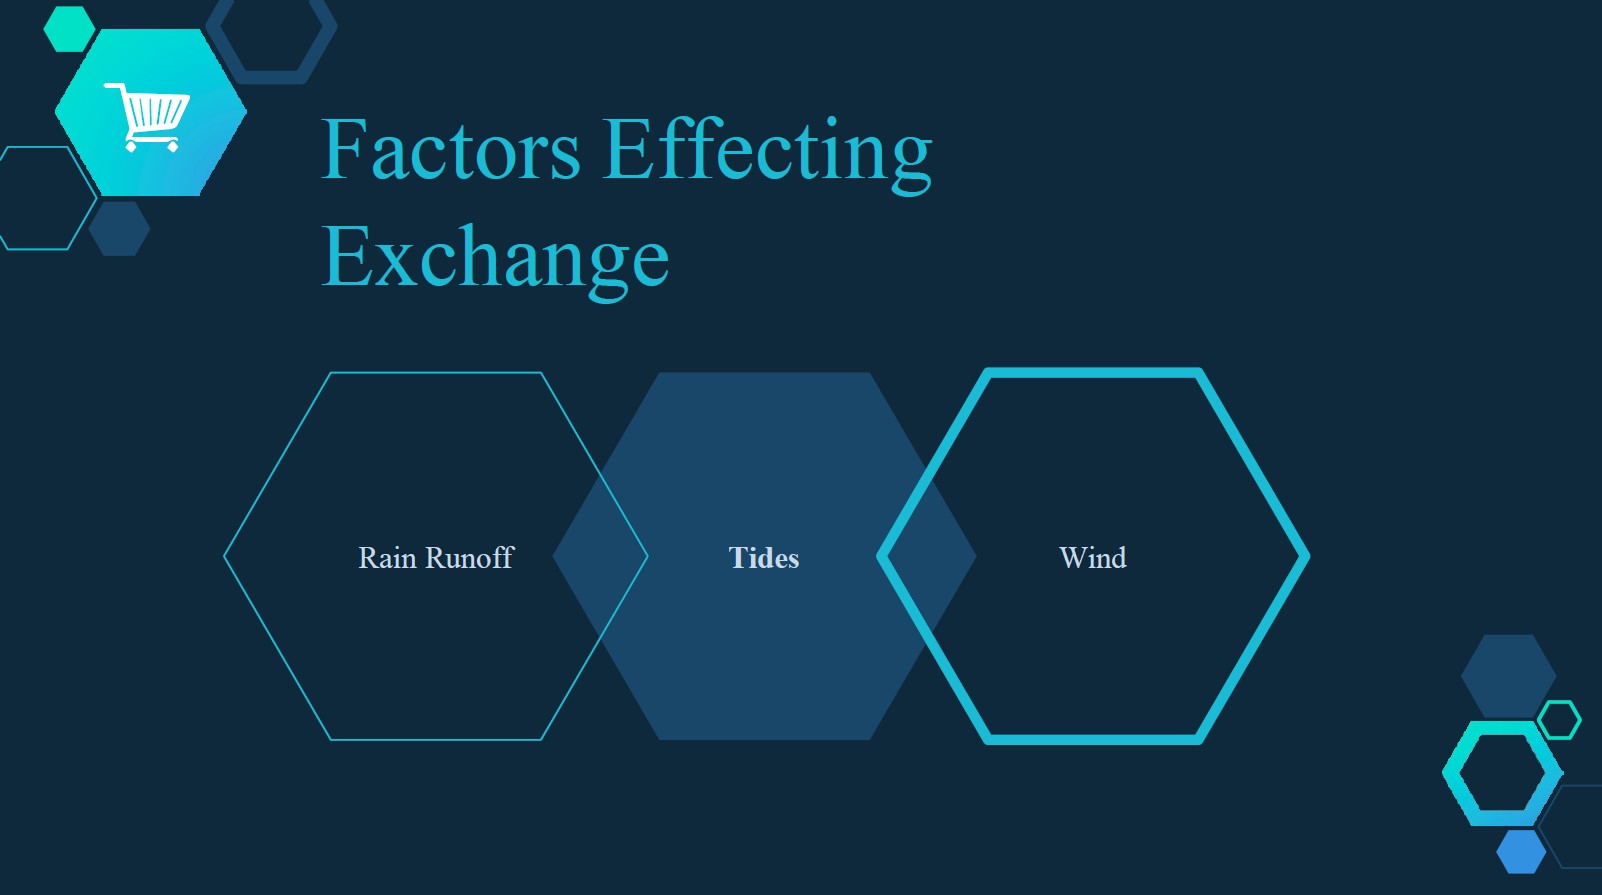
Factors Effecting Exchange
The slide shows three main factors that affect water exchange:
- Rain Runoff
- Tides
- Wind
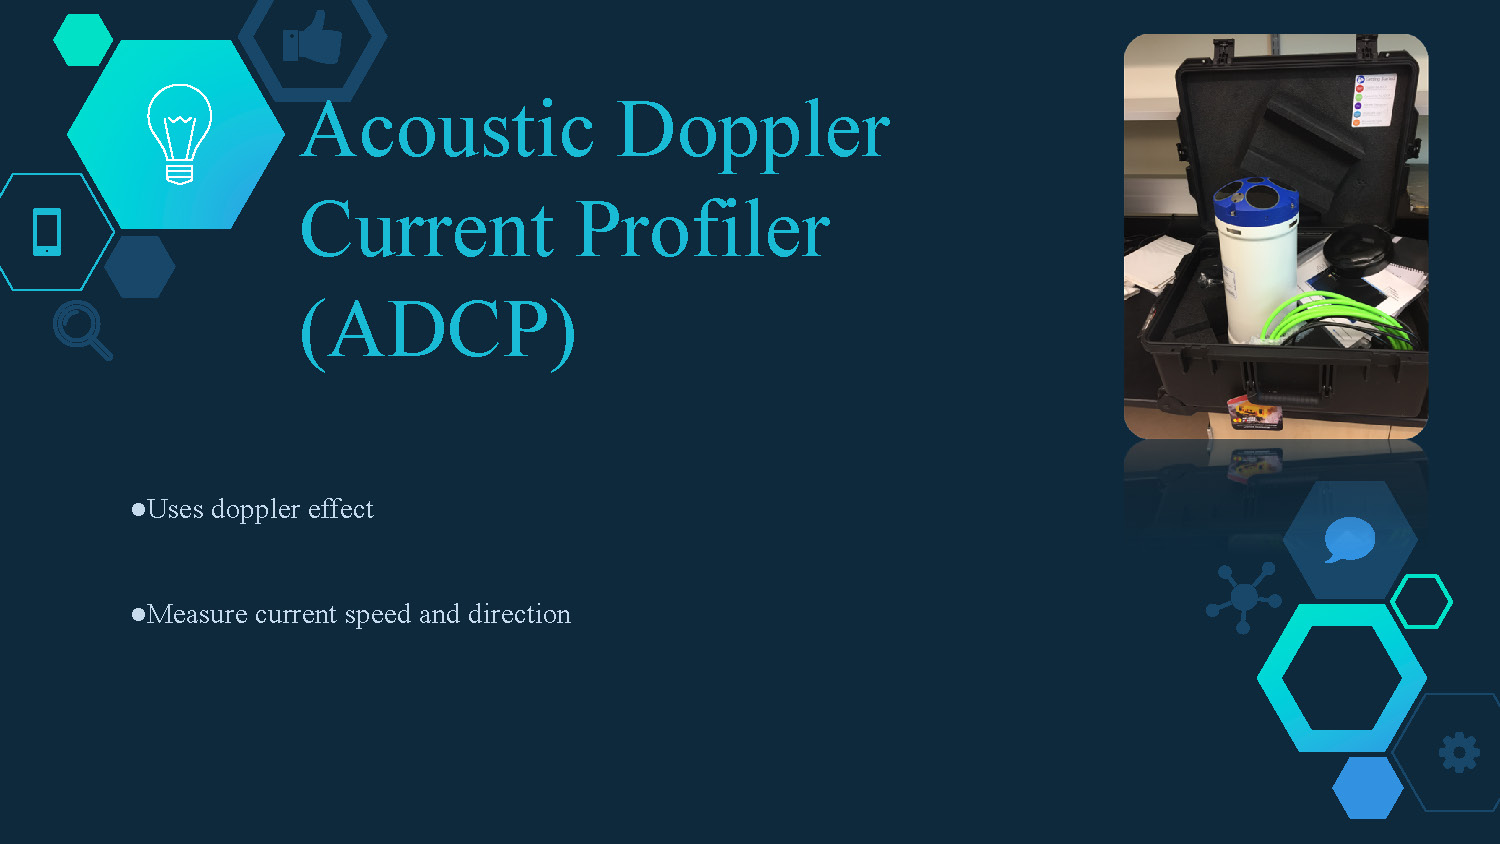
Acoustic Doppler Current Profiler (ADCP)
- Uses doppler effect
- Measure current speed and direction
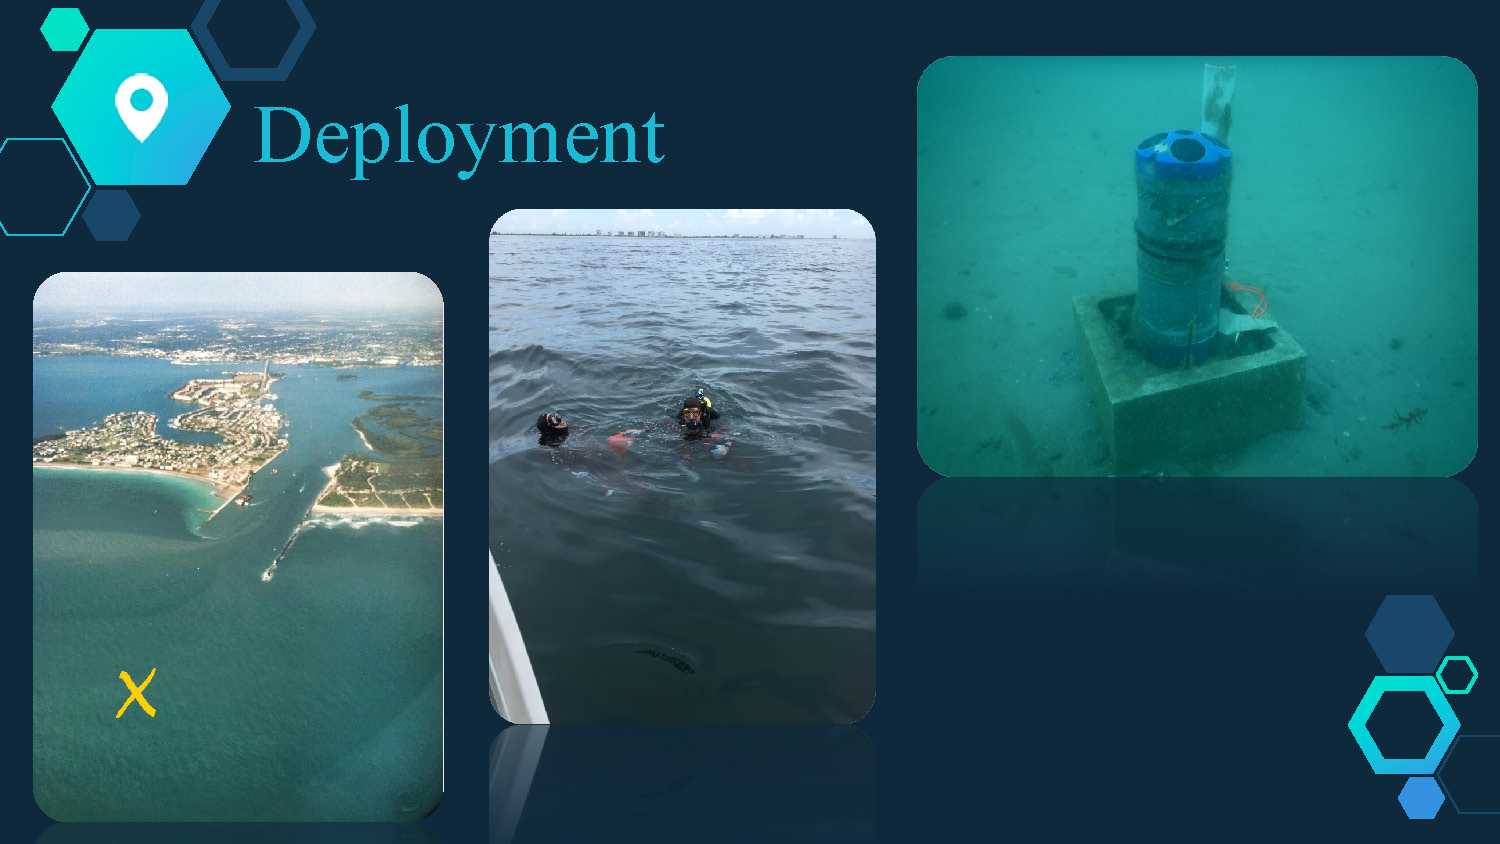
Deployment
The image shows a presentation slide with the title "Deployment" in large, light blue text. The background is a dark blue with hexagonal shapes. There are three main photographs on the slide. The first photo, on the left, is an aerial view of a coastline and a body of water. A yellow 'X' marks a spot in the water. The middle photo shows two divers partially submerged in water next to a boat. The third photo, on the right, is an underwater shot of a cylindrical object, which is blue at the top and mounted on a concrete block resting on the sandy seafloor.
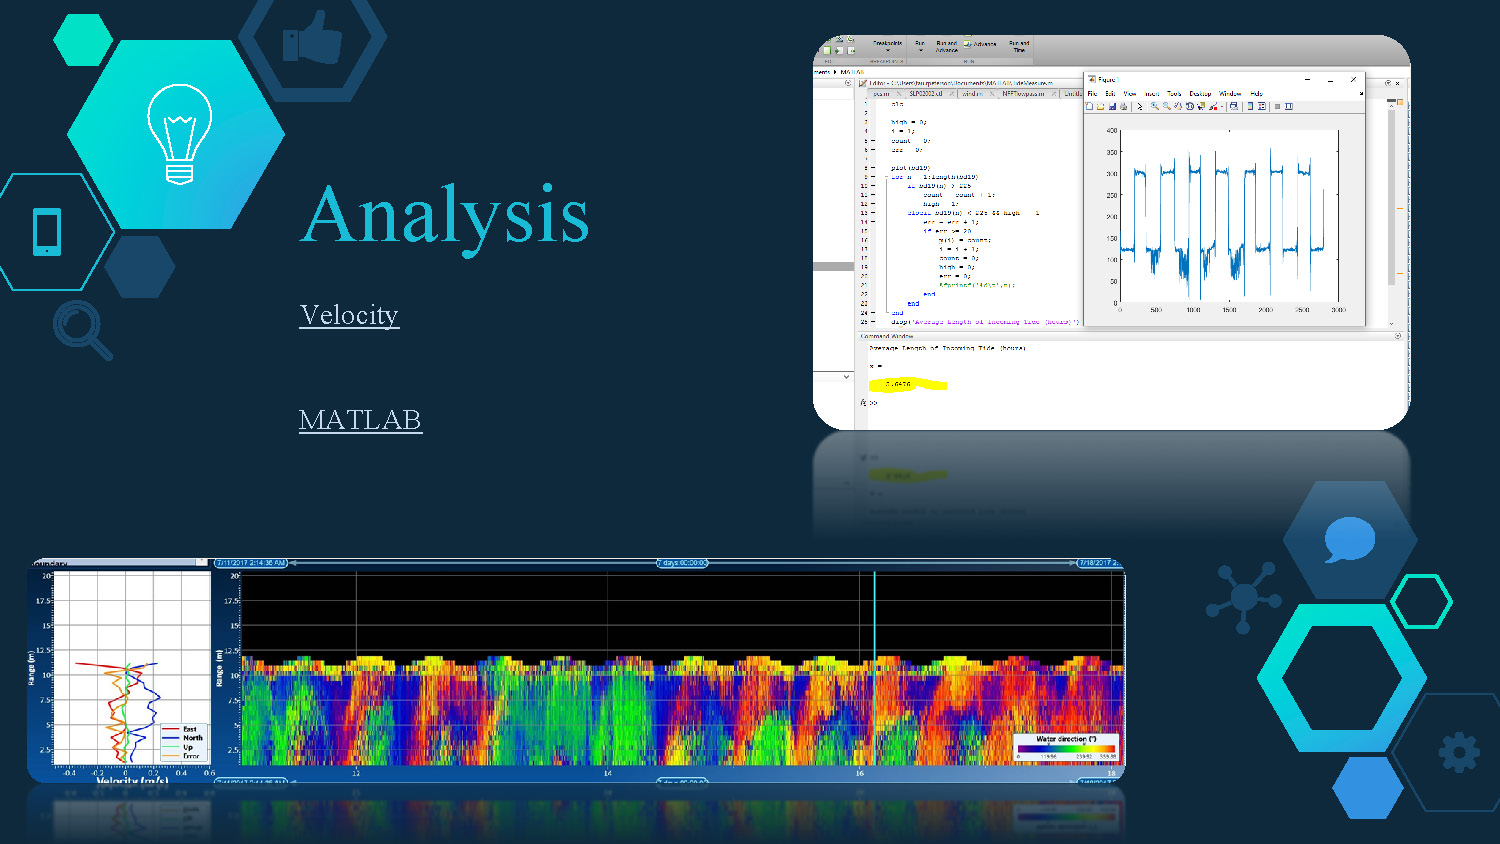
Analysis
Velocity
MATLAB
The image is a presentation slide with the title "Analysis" in large, light blue text. The background is a dark blue with hexagonal shapes. Below the title, the words "Velocity" and "MATLAB" are visible. The slide contains two main visual elements related to data. The top right portion shows a screenshot of a computer screen, displaying code in a program window and a line graph plotted over time. The bottom portion of the slide shows a data visualization with a color-coded heat map representing data over time, with an accompanying line graph on the left side.
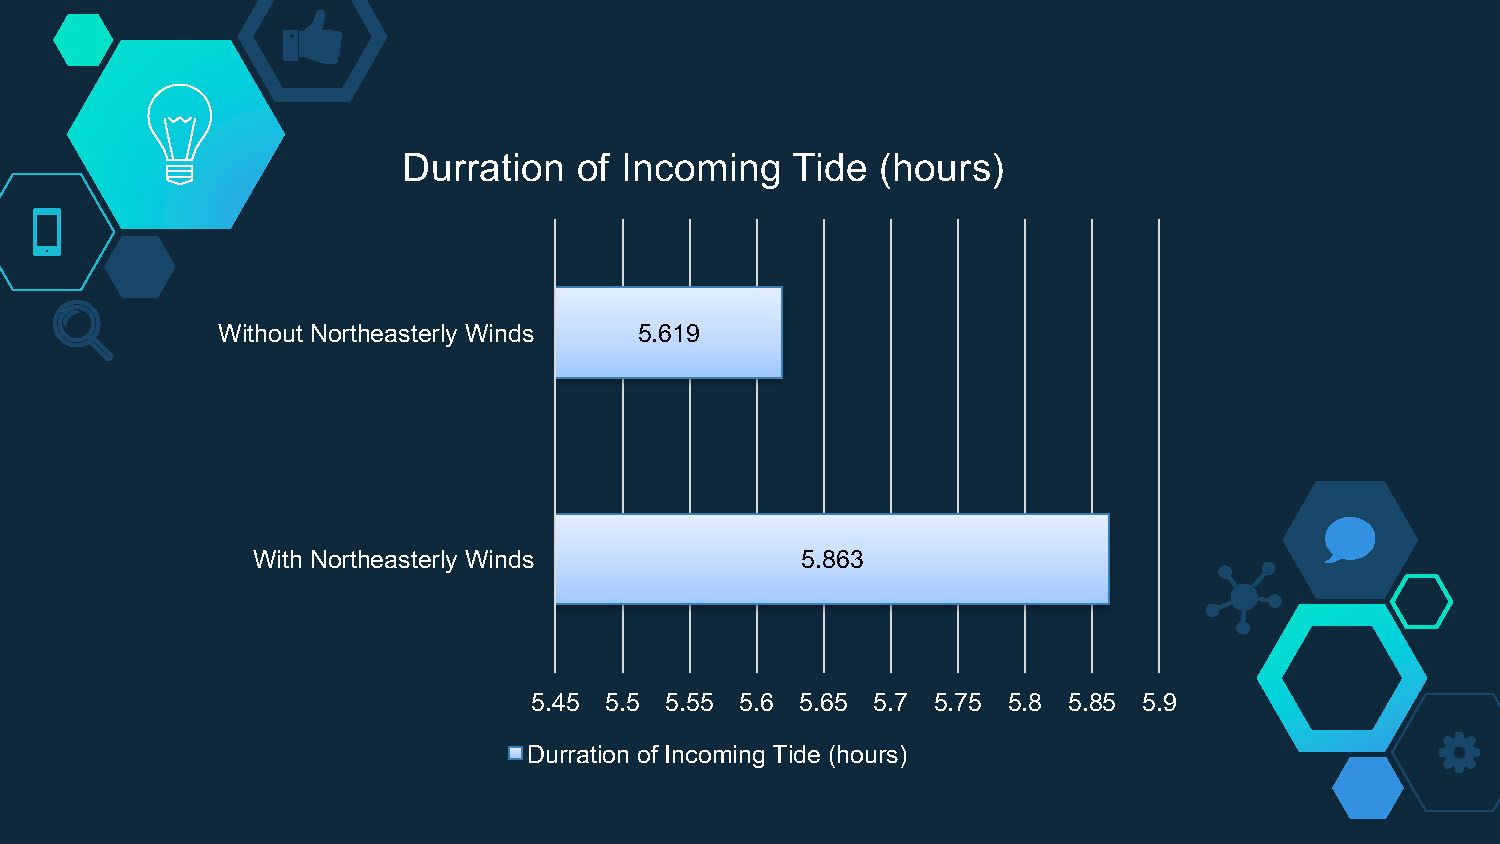
Duration of Incoming Tide (hours)
This bar chart compares the duration of incoming tide under two conditions:
- Without Northeasterly Winds: 5.619 hours
- With Northeasterly Winds: 5.863 hours
The x-axis shows duration from 5.45 to 5.9 hours, and the chart demonstrates that northeasterly winds extend the duration of incoming tide by approximately 0.244 hours.
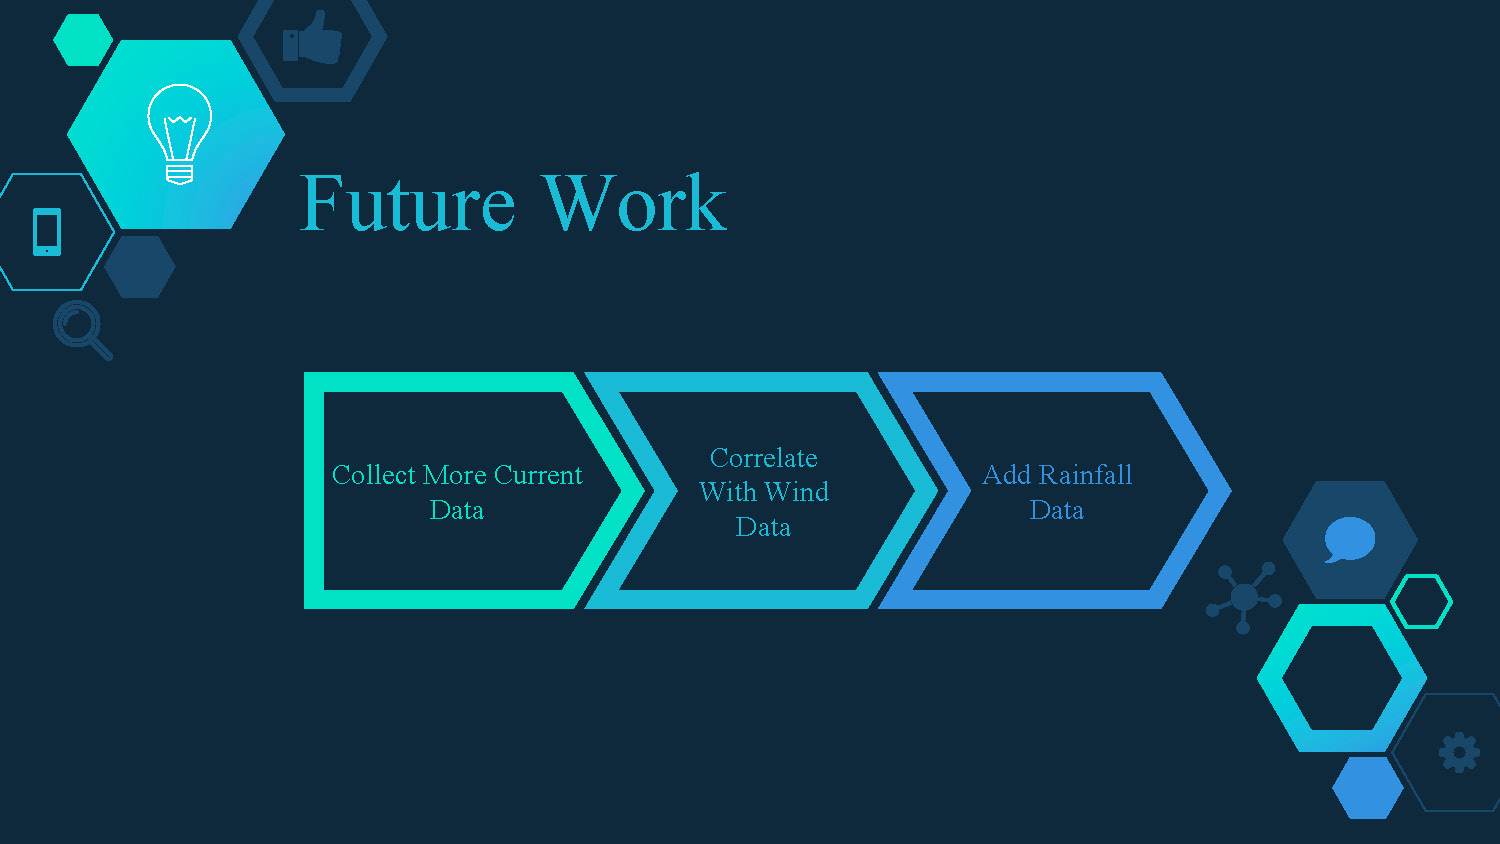
Future Work
- Collect More Current Data
- Correlate With Wind Data
- Add Rainfall Data

Thanks!

End of Presentation
Click the right arrow to return to the beginning of the slide show.
For a downloadable version of this presentation, email: I-SENSE@FAU.