Development and Testing of a Wave Powered Offshore Sensing System
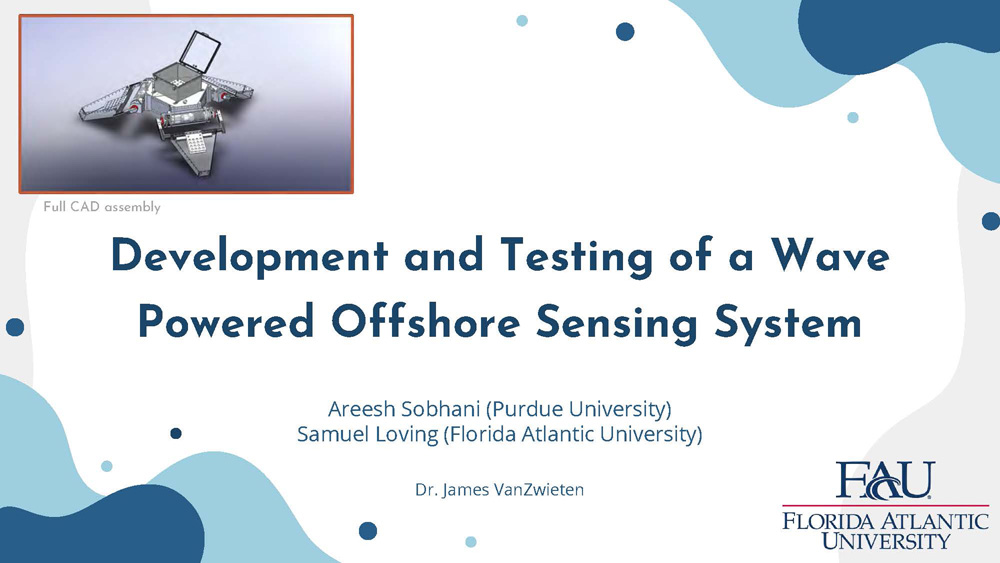
Development and Testing of a Wave Powered Offshore Sensing System
Areesh Sobhani (Purdue University)
Samuel Loving (Florida Atlantic University)
Dr. James VanZwieten
The slide shows a 3D CAD rendering of a wave energy converter system with multiple components including what appears to be a cylindrical buoy structure with internal mechanisms and wing-like appendages extending from the sides.Image caption: Full CAD assembly
80,000 TW/Year
~800,000,000,000,000 A19 10W LED Lightbulbs
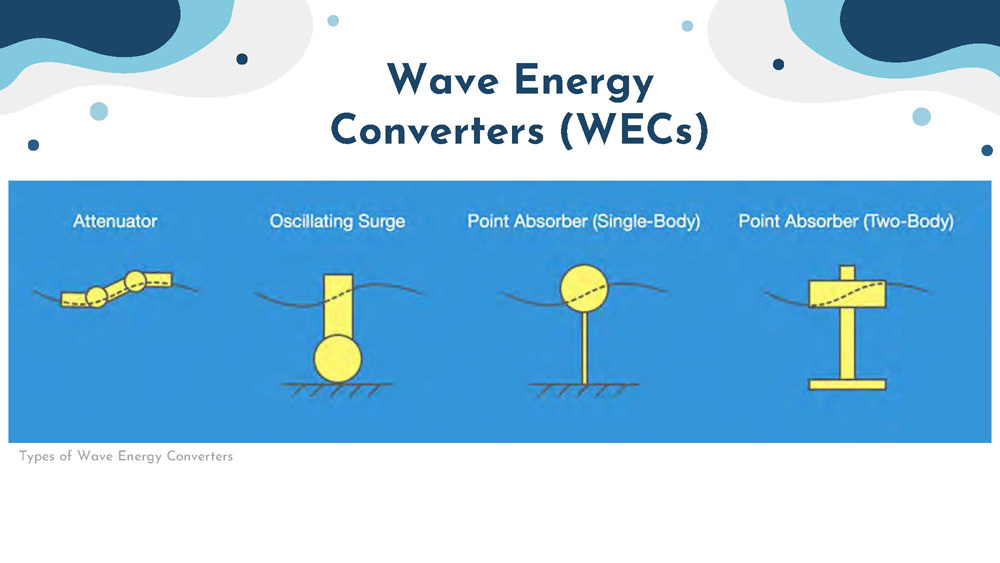
Wave Energy Converters (WECs)
Types of Wave Energy Converters
This slide displays various types of wave energy converter designs including different mechanical configurations and deployment methods. The images show different WEC technologies including oscillating water columns, point absorbers, attenuators, and overtopping devices.
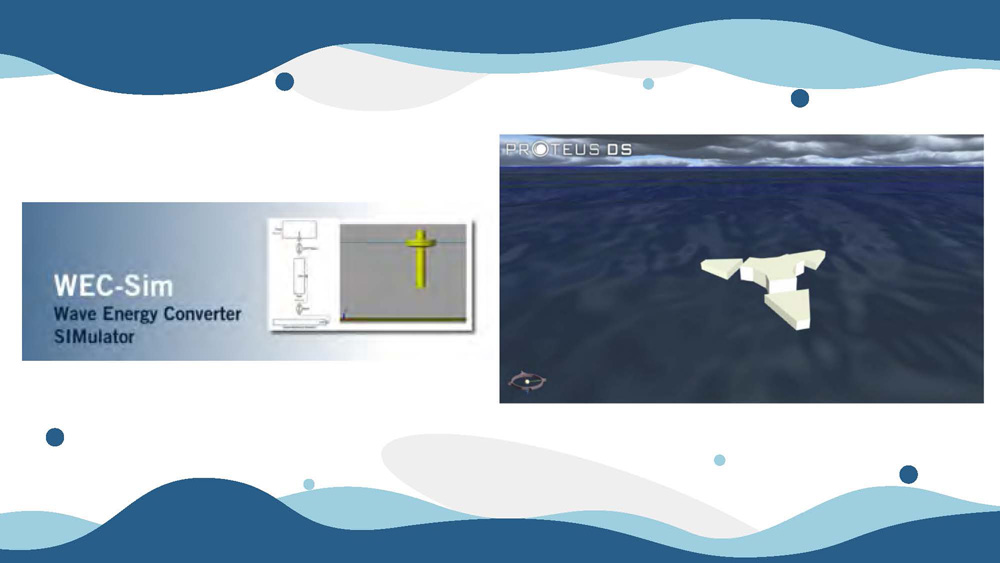
The image is divided into two sections
• The left section shows a graphic with the text “WEC-Sim Wave Energy Converter SIMulator.” It includes a small diagram of a vertical structure with a yellow horizontal element.
• The right section shows a computer-generated image labeled “PROTEUS DS” at the top, displaying a white, angular object floating on a dark blue water surface under a cloudy sky.
Knowledge and Development Gaps
Simulation Validation
Validation of Electrical and Mechanical Power Ratings, as well as optimization of the two characteristics
Performance Characterization
Wave Characterization to Record Performance in different environmental circumstances
System Repair, Maintenance, and Upgrades
Improving the testbed to record reliable data
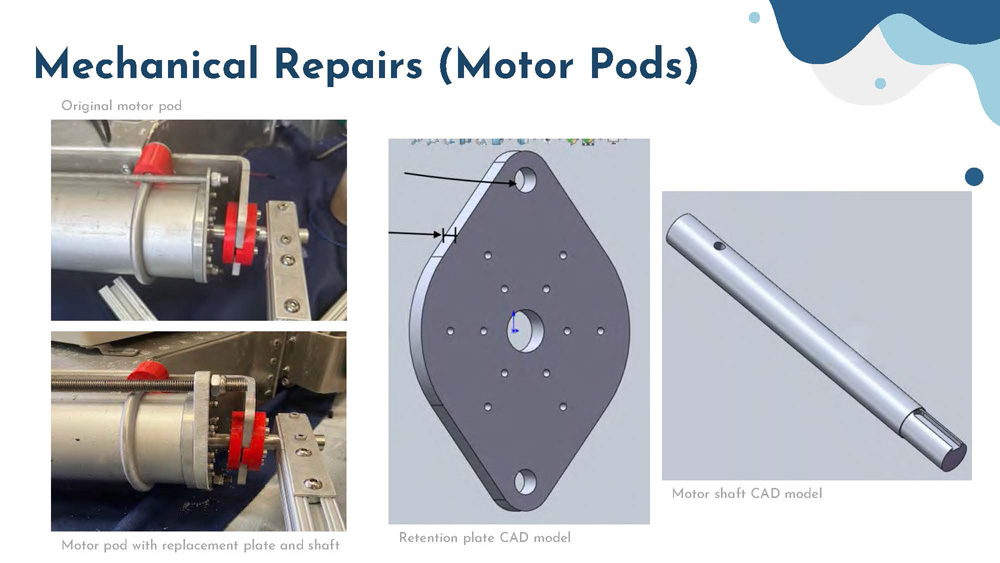
Mechanical Repairs (Motor Pods)
Original motor pod
Motor pod with replacement plate and shaft
Retention plate CAD model
Motor shaft CAD model
This slide shows detailed CAD renderings of the retention plate, motor shaft, and comparison between original and updated motor pod designs.
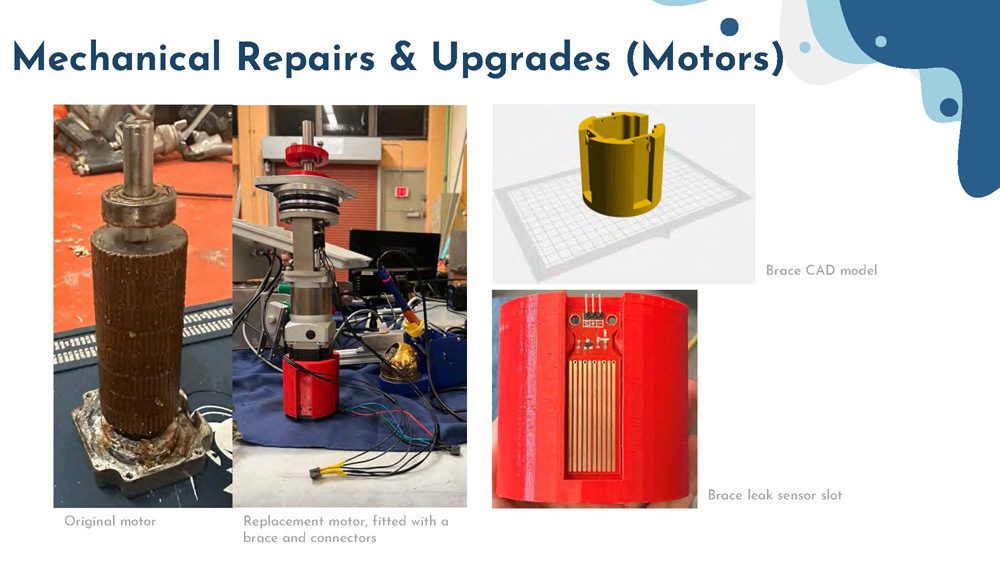
Mechanical Repairs & Upgrades (Motors)
Original motor
Replacement motor, fitted with a brace and connectors
Brace CAD model
Brace leak sensor slot
The slide displays photographs of the original motor compared to the replacement motor with additional bracing and connectors. The CAD model shows the detailed design of the brace including the leak sensor slot integration.
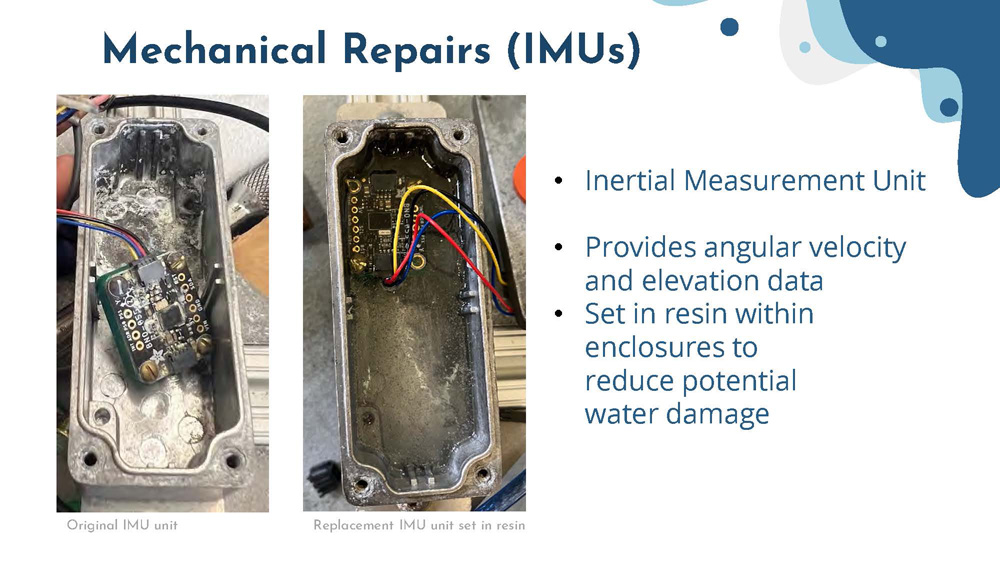
Mechanical Repairs (IMUs)
- Inertial Measurement Unit
- Provides angular velocity and elevation data
- Set in resin within enclosures to reduce potential water damage
Original IMU unit
Replacement IMU unit set in resin
This slide shows the protection improvements made to the Inertial Measurement Units, comparing the original unit to the upgraded version that has been encapsulated in resin for better water resistance. The IMUs are critical sensors that measure the motion characteristics of the wave energy converter.
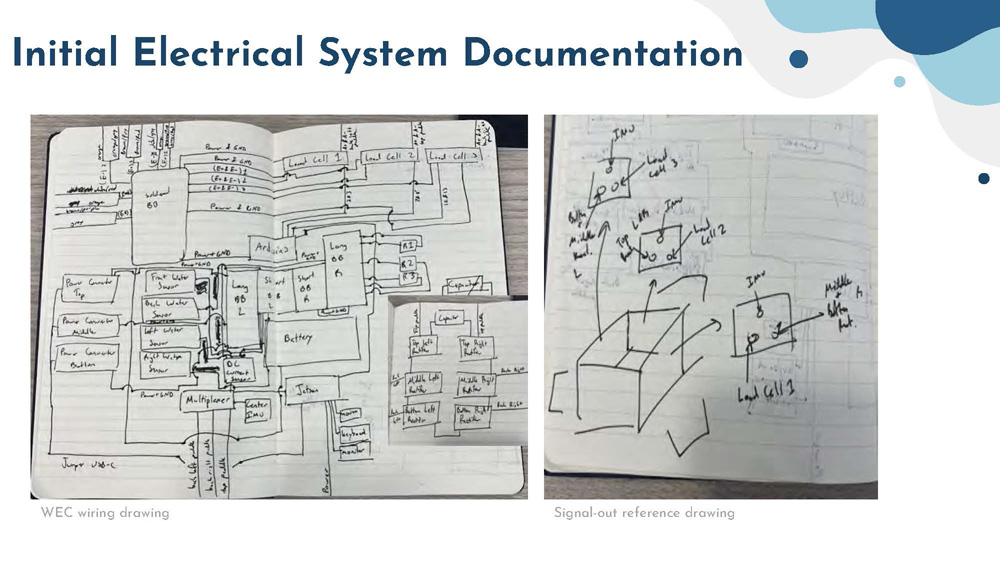
Initial Electrical System Documentation
WEC wiring drawing
Signal-out reference drawing
The slide presents technical diagrams documenting the electrical connections and signal pathways in the wave energy converter system. These engineering drawings show the interconnections between various system components and the signal output configurations.
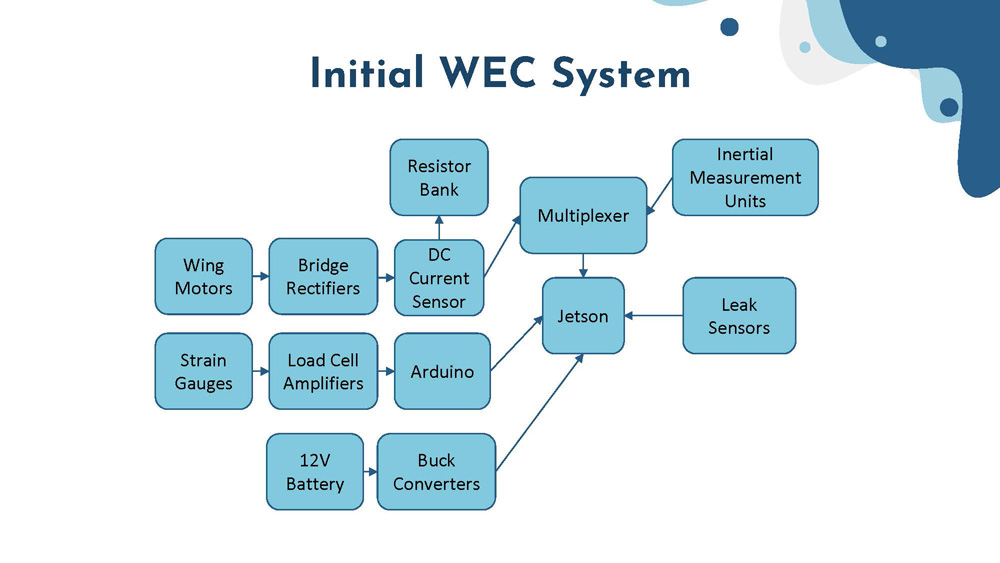
Initial WEC System
The system diagram shows interconnections between the following components:
- Jetson
- Arduino
- Load Cell Amplifiers
- Strain Gauges
- Wing Motors
- Buck Converters
- Multiplexer
- Inertial Measurement Units
- DC Current Sensor
- Resistor Bank
- Bridge Rectifiers
- 12V Battery
- Leak Sensors
This block diagram illustrates how all the major electrical and electronic components of the wave energy converter are interconnected, showing the flow of power and data throughout the system.
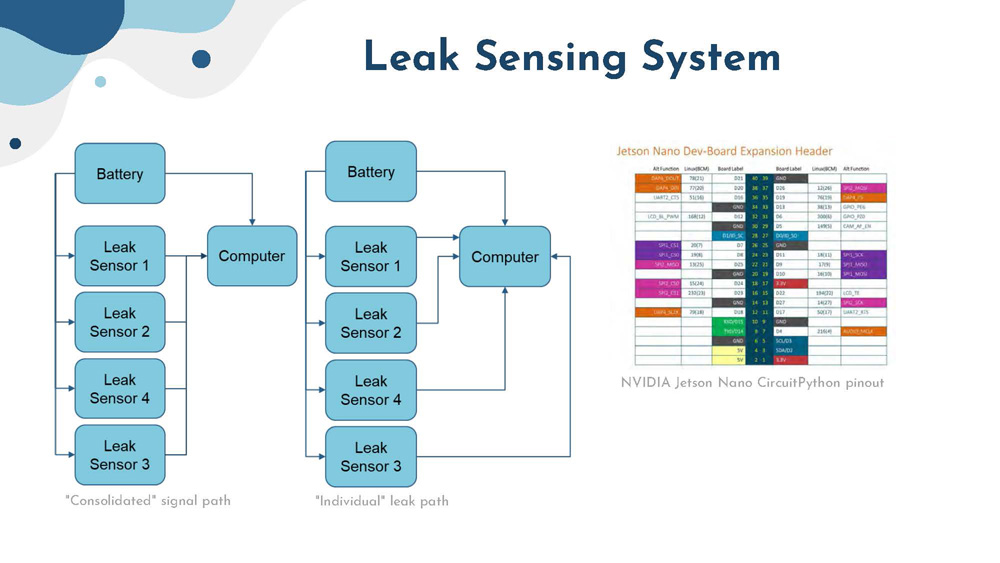
Leak Sensing System
"Consolidated" signal path
"Individual" leak path
NVIDIA Jetson Nano CircuitPython pinout
This slide details the leak detection system implementation, showing both consolidated and individual signal path configurations. The circuit diagrams demonstrate how leak sensors are connected to the NVIDIA Jetson Nano controller, with pinout information for the CircuitPython programming interface.
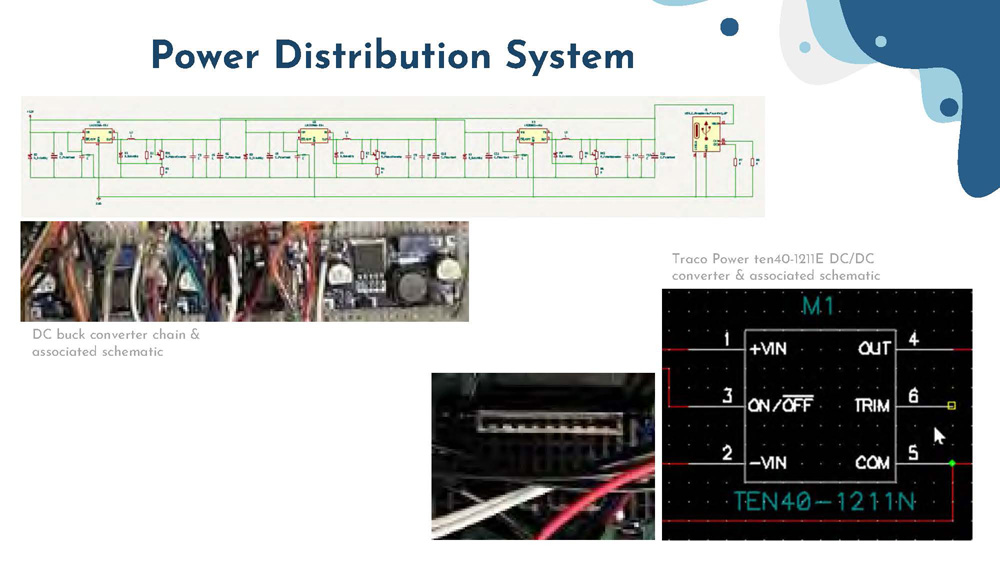
Power Distribution System
DC buck converter chain & associated schematic
Traco Power ten40-1211E DC/DC converter & associated schematic
The slide shows the power management system design, including detailed schematics of the DC buck converter chain and the Traco Power DC/DC converter.
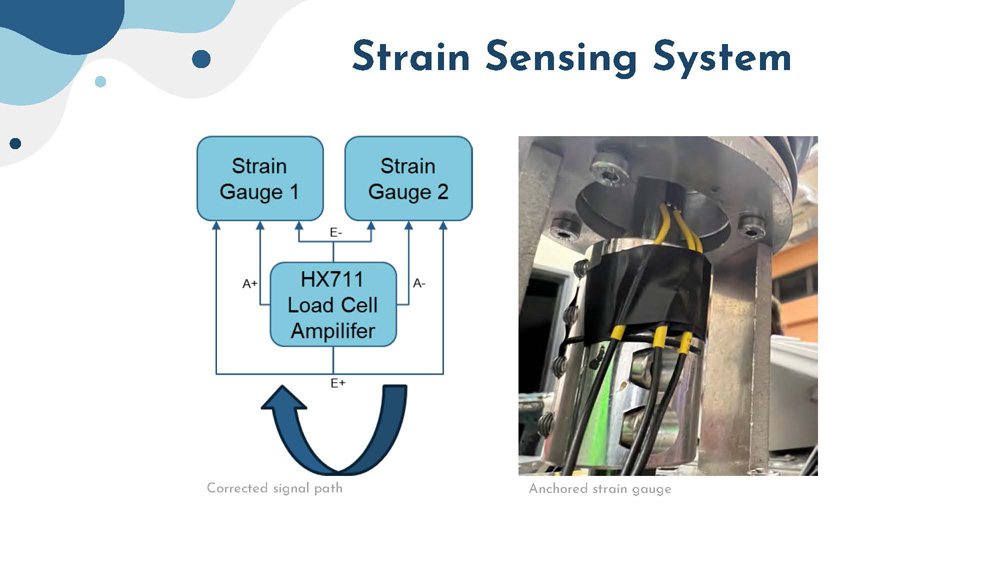
Strain Sensing System
Corrected signal path
Anchored strain gauge
This slide presents the strain measurement system, showing both the electrical signal path diagram and a photograph of the physically installed strain gauge.
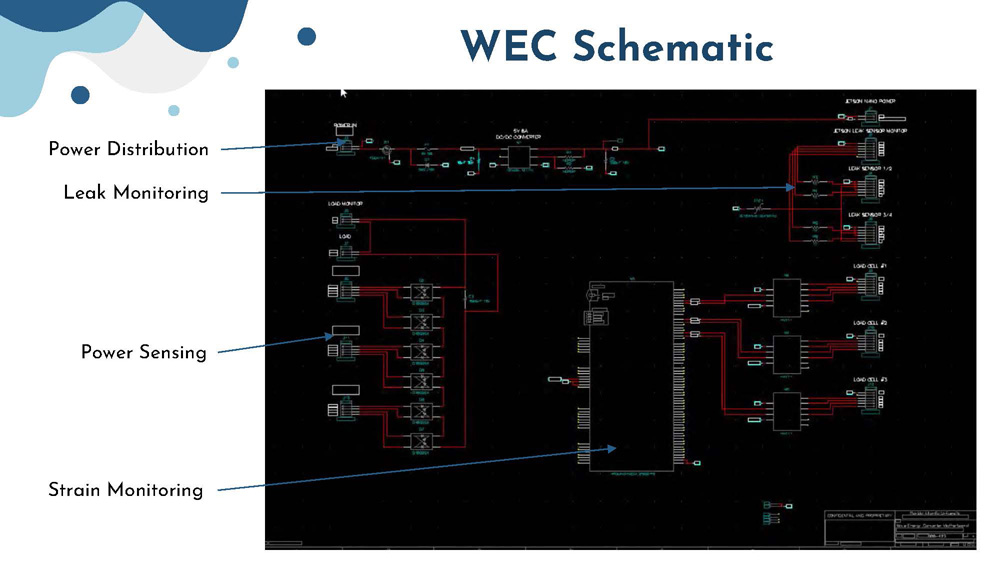
WEC Schematic
- Power Distribution
- Power Sensing
- Strain Monitoring
- Leak Monitoring
This comprehensive schematic diagram shows the complete wave energy converter system architecture, integrating all subsystems including power distribution, power sensing, strain monitoring, and leak monitoring. The diagram illustrates how these various subsystems work together in the overall WEC design.
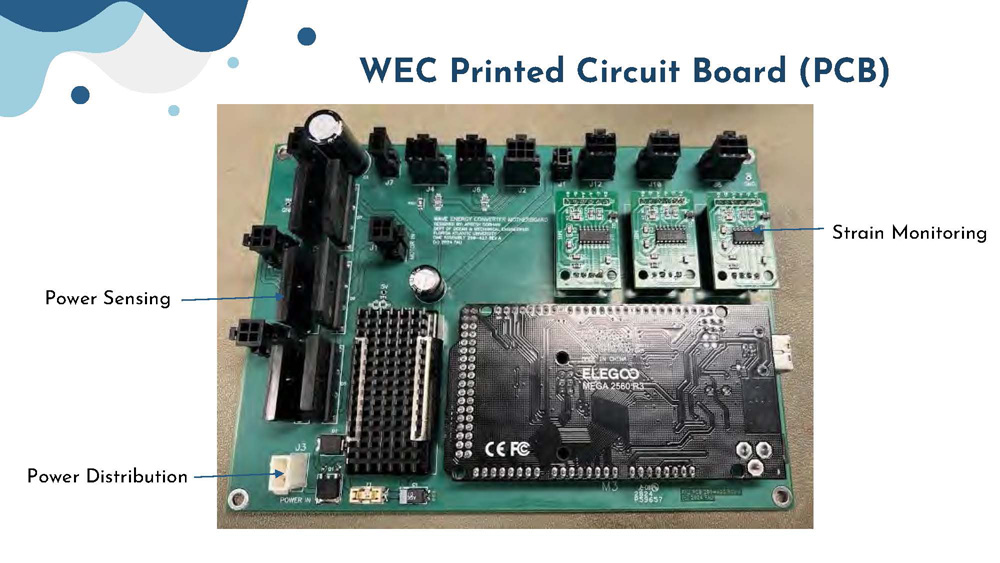
WEC Printed Circuit Board (PCB)
- Strain Monitoring
- Power Sensing
- Power Distribution
This slide shows the custom printed circuit board designed for the wave energy converter, highlighting the sections dedicated to strain monitoring, power sensing, and power distribution.
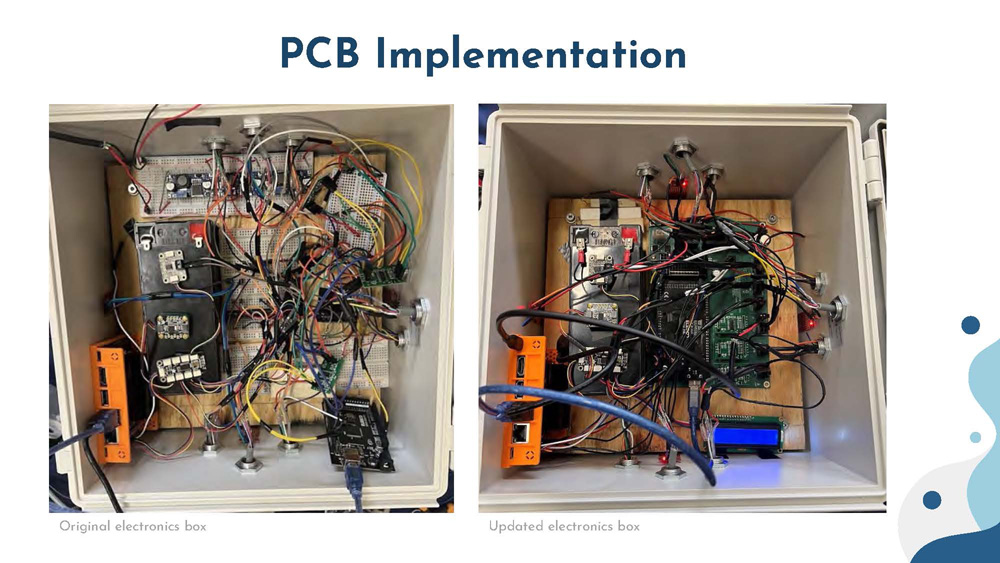
PCB Implementation
Original electronics box
Updated electronics box
The slide compares the original electronics enclosure with the updated version that houses the new PCB. The photographs show the evolution of the electronics packaging, demonstrating improvements in organization and integration of the control systems.
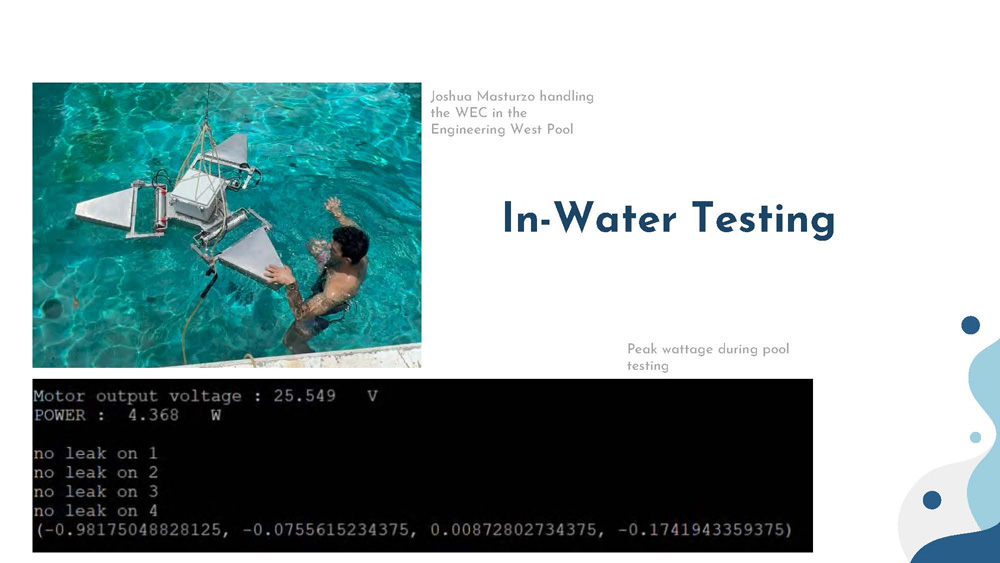
In-Water Testing
Peak wattage during pool testing
Joshua Masturzo handling the WEC in the Engineering West Pool
This slide shows a graph of peak wattage measurements during pool testing alongside a photograph of team member Joshua Masturzo working with the wave energy converter in the Engineering West Pool.
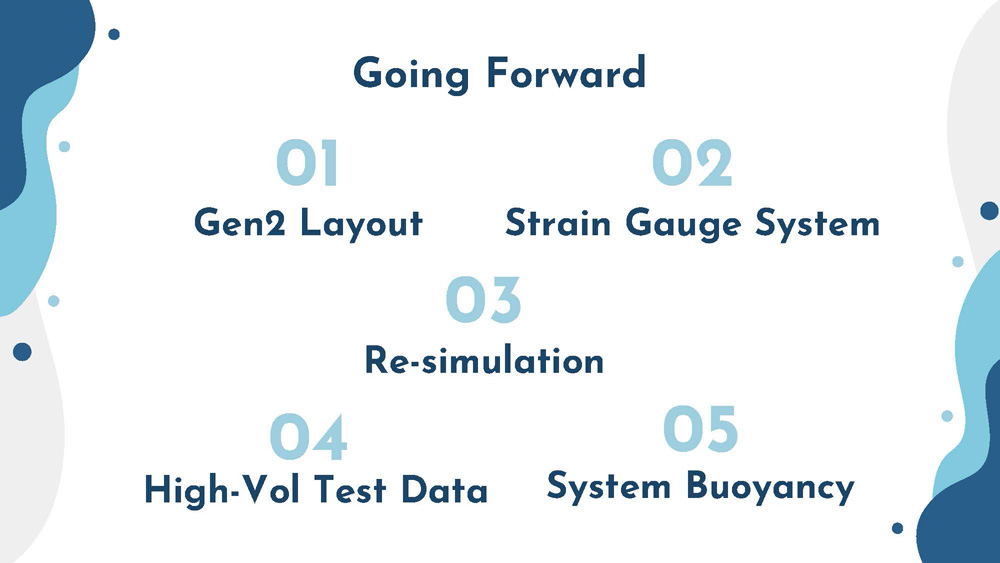
Going Forward
- 01 Gen2 Layout
- 02 Strain Gauge System
- 03 Re-simulation
- 04 High-Vol Test Data
- 05 System Buoyancy
This slide outlines the five key areas for future development of the wave energy converter system.
Acknowledgments
- Dr. James VanZwieten
- Joshua Masturzo
- James Laumeyer
- Ed Henderson
This slide recognizes the key team members and contributors who made this wave energy converter research project possible.
References
DePietro, A. R. (2022, May). Numerical Simulation and Performance Characterization of Two Wave Energy Converters.
DiversiTech. (2024). 3/4IN. X 60FT. ECONOMY ELECTRICAL TAPE 10/PK. DiversiTech. Retrieved 2024, from https://www.diversitech.com/tape-econelectape-34x60ft.
Microsoft. (n.d.). PuTTY. Microsoft Store. Retrieved July 24, 2024, from https://apps.microsoft.com/detail/xpfnzksklbp7rj?amp%3Bgl=US&hl=en-us&gl=US.
NREL. (2021). WEC Sim Header. OpenEI. OpenEI. Retrieved July 24, 2024, from https://openei.org/wiki/WEC-Sim.
NVIDIA. (n.d.). Getting Started with Jetson Nano 2GB Developer Kit. NVIDIA Developer. Retrieved July 24, 2024, from https://developer.nvidia.com/embedded/learn/get-started-jetson-nano-2gb-devkit.
Oubit. (n.d.). Step Motor Stepper 57 Steps 3.0Nm Large Torsion Low Noise High Speed for Equipment, Closed Loop Stepper Motor for CNC Mill Lathe Router. Amazon. Retrieved July 24, 2024, from https://www.amazon.com/Stepper-Torsion-Equipment-Closed-Router/dp/B0B5QFMMQ8.
Plate, T. (2022). New Tool Helps Researchers Make the Most of Wave Power. NREL. NREL. Retrieved 24AD. Wave power. (n.d.). Wikipedia. Retrieved July 24, 2024, from https://en.wikipedia.org/wiki/Wave_power.

End of Presentation
Click the right arrow to return to the beginning of the slide show.
For a downloadable version of this presentation, email: I-SENSE@FAU.