Radio propagation digital twin to evaluate pedestrian localization in smart streetscapes
Radio propagation digital twin to evaluate pedestrian localization in smart streetscapes
REU Scholar: Alyssa Falcon
Advisor: Dr. Georgios Sklivanitis
Lehman College, City University of New York
About
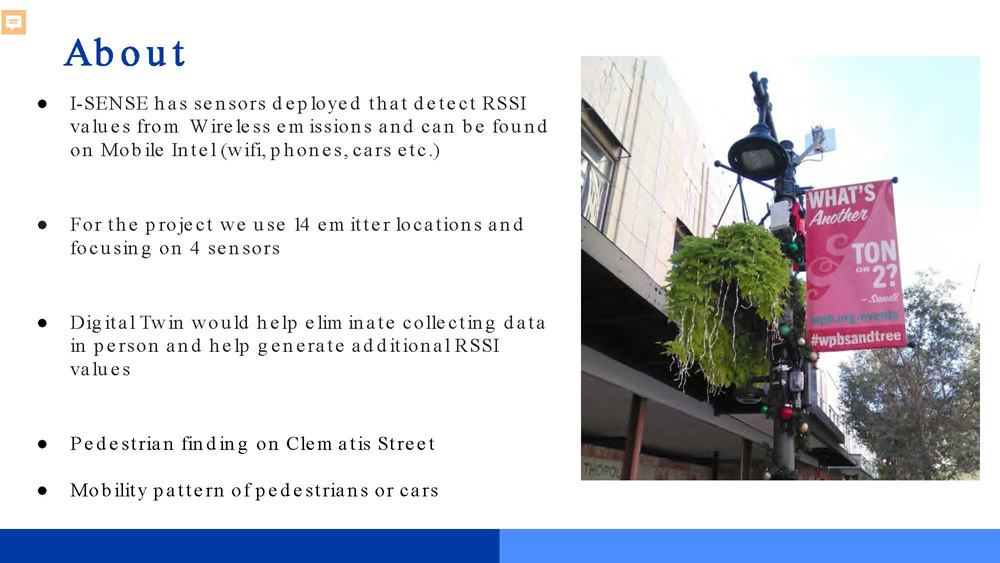
• I-SENSE has sensors deployed that detect RSSI values from Wireless emissions and can be found on Mobile Intel (wifi, phones, cars etc.)
• For the project we use 14 emitter locations and focusing on 4 sensors
• Digital Twin would help eliminate collecting data in person and help generate additional RSSI values
• Pedestrian finding on Clematis Street
• Mobility pattern of pedestrians or cars
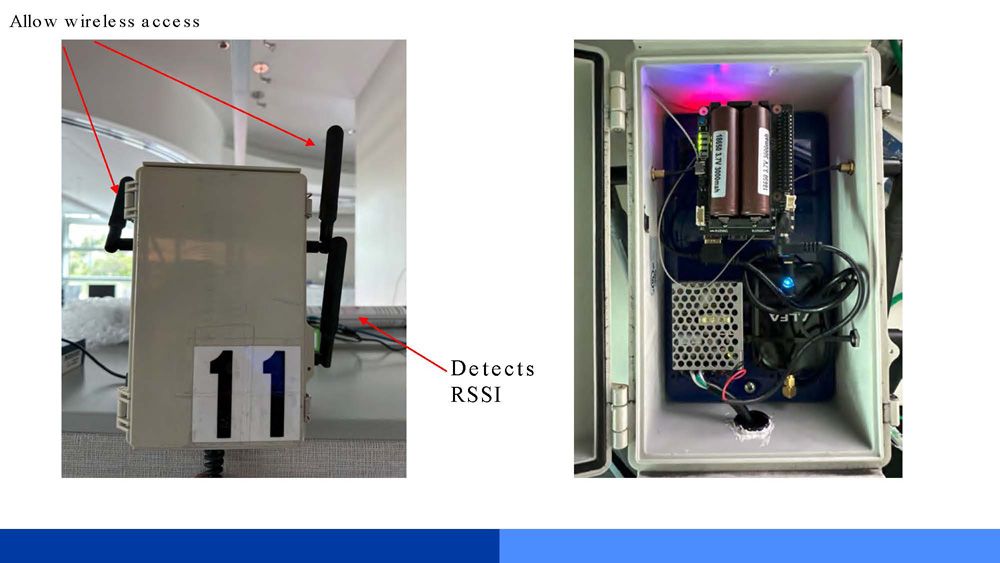
Left side: A rectangular box with two antennas attached. A label with the number "11" is on the front. Red arrows point to the antennas with text labels "Allow wireless access" and "Detects RSSI."
Right side: The inside of the box is shown. It contains components including cylindrical batteries, circuit boards, wiring, a metal grid-like component, and a device labeled "VELA." A red light and a blue light are visible on the components.
Tools Used
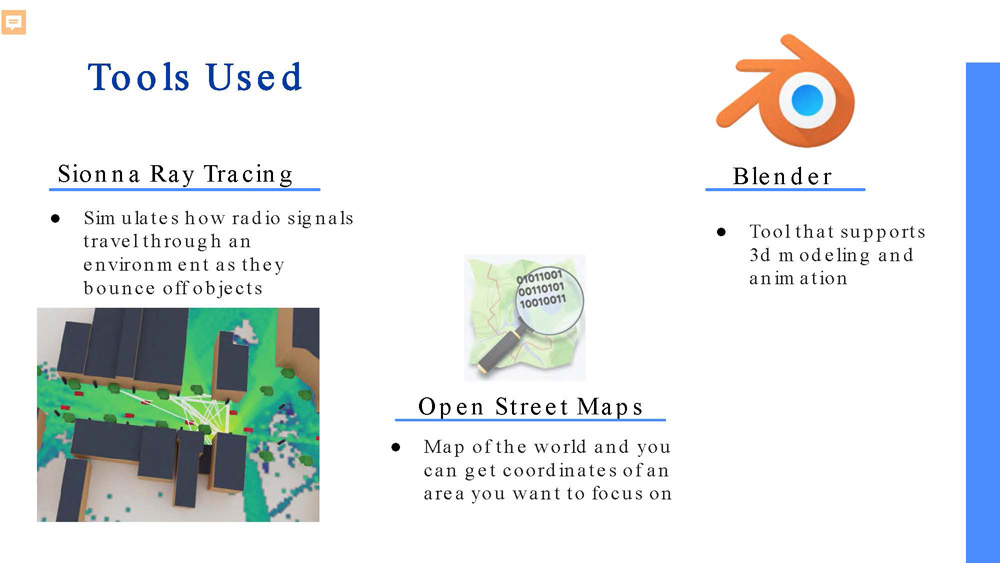
Sionna Ray Tracing
Simulates how radio signals travel through an environment as they bounce off objects
Blender
Tool that supports 3d modeling and animation
Open Street Maps
Map of the world and you can get coordinates of an area you want to focus on
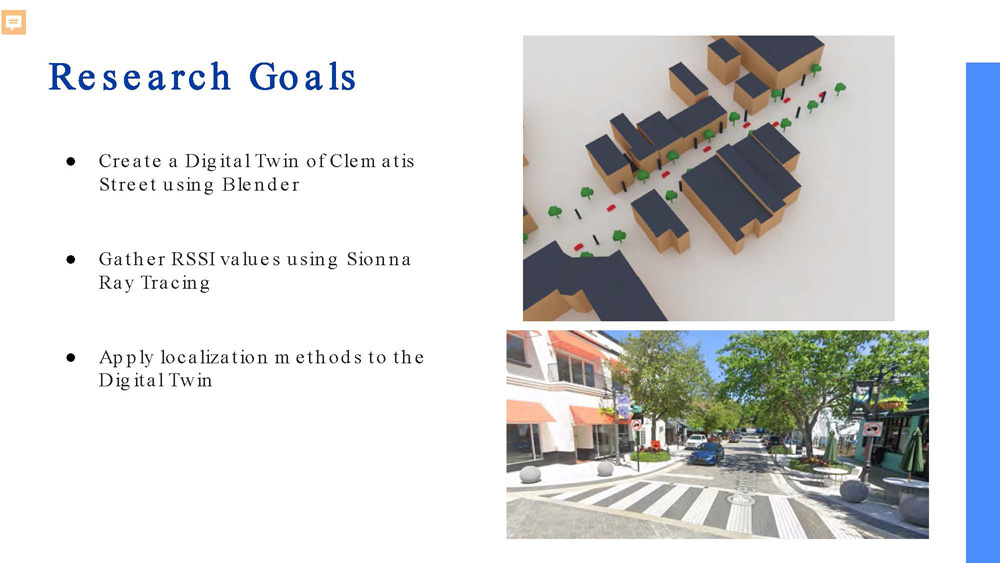
Research Goals
Create a Digital Twin of Clematis Street using Blender
Gather RSSI values using Sionna Ray Tracing
Apply localization methods to the Digital Twin
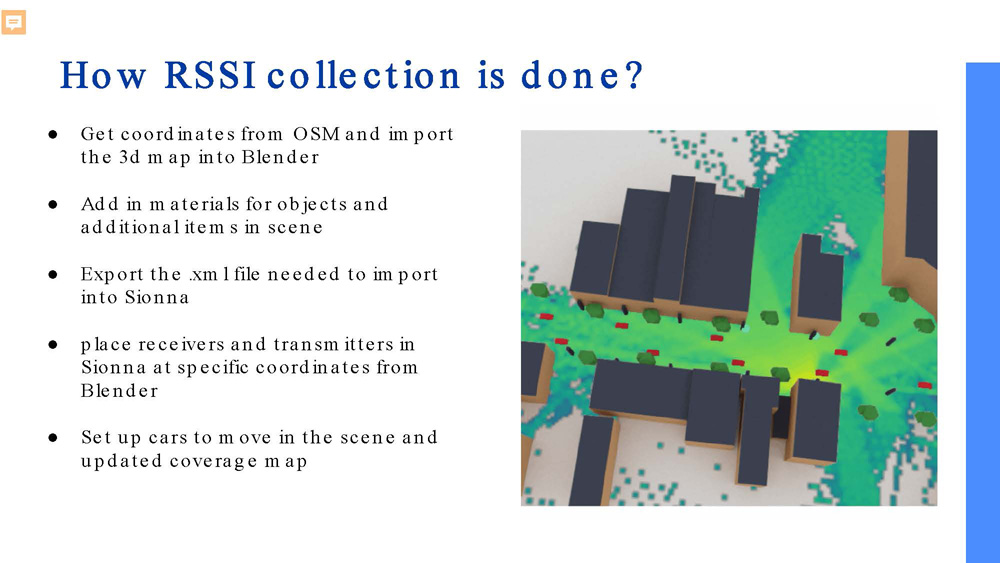
How RSSI collection is done?
Get coordinates from OSM and import the 3d map into Blender
Add in materials for objects and additional items in scene
Export the .xml file needed to import into Sionna
place receivers and transmitters in Sionna at specific coordinates from Blender
Set up cars to move in the scene and updated coverage map
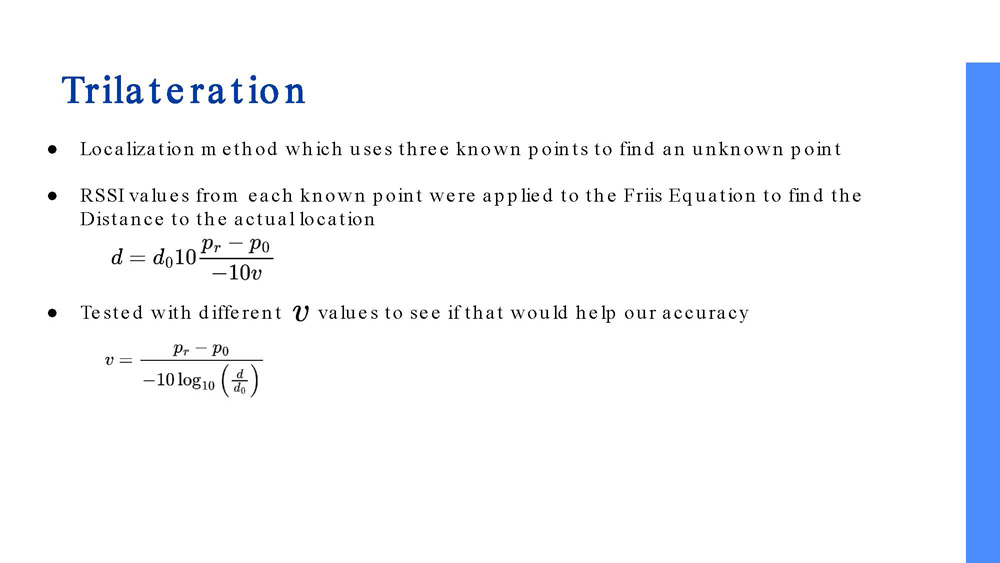
Trilateration
Localization method which uses three known points to find an unknown point
RSSI values from each known point were applied to the Friis Equation to find the Distance to the actual location
Tested with different values to see if that would help our accuracy
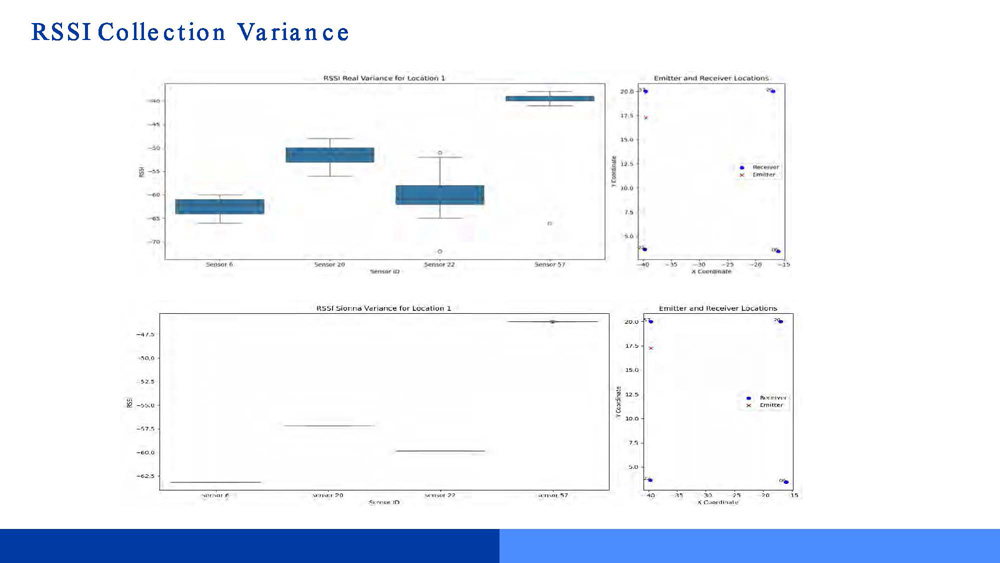
RSSI Collection Variance
This slide shows comparative charts displaying RSSI values. The left section is labeled "Real Data" and the right section is labeled "Digital Twin Data". The charts appear to show signal strength measurements over different positions or time periods, allowing for comparison between actual collected data and simulated digital twin data. The visual comparison demonstrates the variance patterns between real-world measurements and digital simulation results.
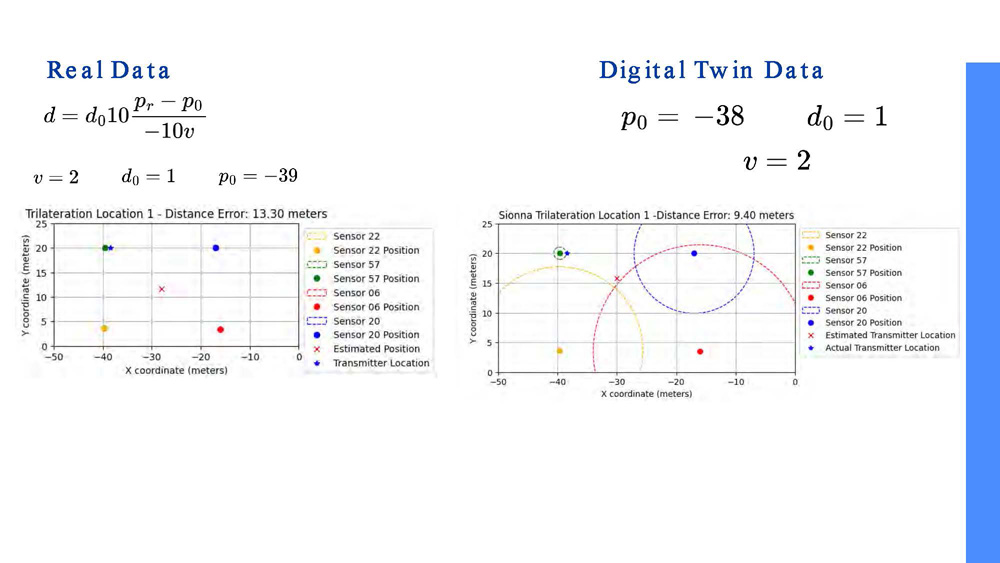
Left section titled "Real Data": Contains a mathematical formula and parameter values
Below, a graph is shown with X and Y axes labeled in meters. It has colored markers and a legend with entries: Sensor 22, Sensor 22 Position, Sensor 57, Sensor 57 Position, Sensor 06, Sensor 06 Position, Sensor 20, Sensor 20 Position, Estimated Position, and Transmitter Location.
The graph title is "Trilateration Location 1 - Distance Error: 13.30 meters."
Right section titled "Digital Twin Data": Contains a mathematical formula and parameter values
Below, another graph is shown with X and Y axes labeled in meters. It has similar markers and a legend with the same sensor labels plus "Estimated Transmitter Location" and "Actual Transmitter Location."
The graph title is "Sionna Trilateration Location 1 - Distance Error: 9.40meters."
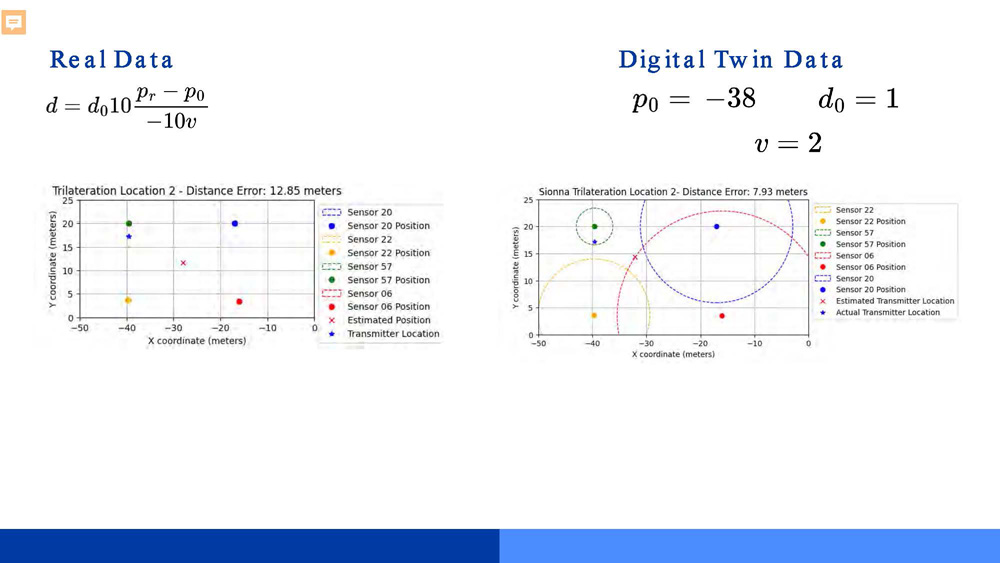
Left section titled "Real Data": Contains a mathematical formula and parameter values
Below, a graph is shown with X and Y axes labeled in meters. It has colored markers and a legend with entries: Sensor 20, Sensor 20 Position,Sensor 22, Sensor 22 Position, Sensor 57, Sensor 57 Position, Sensor 06, Sensor 06 Position, Estimated Position, and Transmitter Location.
The graph title is "Trilateration Location 2 - Distance Error: 12.85 meters."
Right section titled "Digital Twin Data": Contains a mathematical formula and parameter values
Below, another graph is shown with X and Y axes labeled in meters. It has similar markers and a legend with the sensor labels Sensor 22, Sensor 22 Position, Sensor 57, Sensor 57 Position, Sensor 06, Sensor 06 Position, Estimated Transmitter Location and Actual Transmitter Location.
The graph title is "Sionna Trilateration Location 2 - Distance Error: 7.93meters."
Estimation Comparison
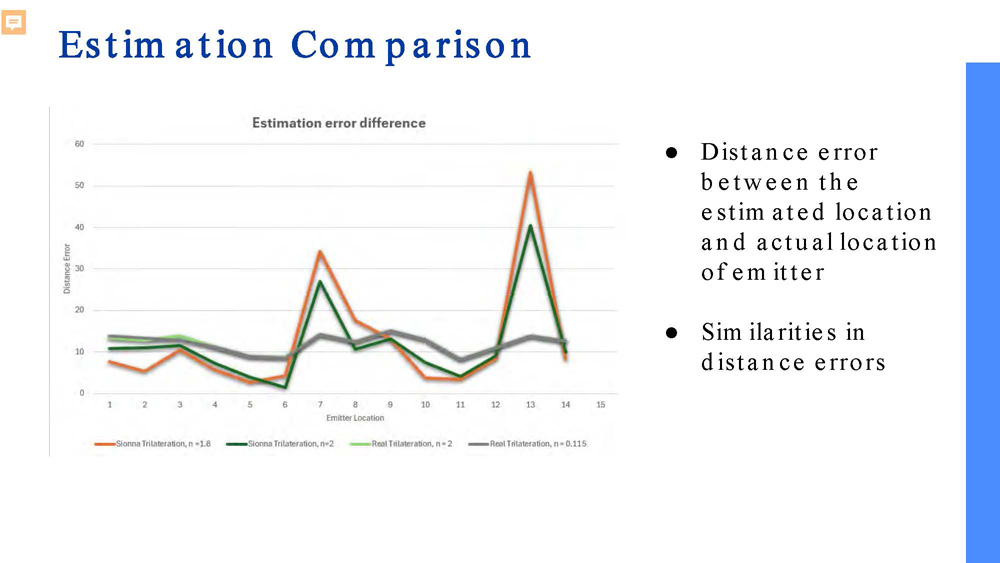
• Distance error between the estimated location and actual location of emitter
• Similarities in distance errors
The slide includes visual graph showing the comparison of estimation accuracy between different methods or datasets, demonstrating the performance of the localization system.
Conclusion
• Digital Twin helps with the what if situations since it allows you to control the environment
• Tool that provides efficiency, ability to make informed decisions, and an easy to implement simulation
• Future work to be added on to this Digital Twin can be implementing a fingerprinting localization method
Acknowledgment
Mobile Intel
Dr. Georgios Sklivanitis
Jose Baca
References
NVIDIA Labs. (n.d.). Sionna ray tracing API. Retrieved June 2024, from https://nvlabs.github.io/sionna/api/rt.html#
R. Bembenik and K. Falcman, "BLE indoor positioning system using RSSI-based trilateration," Warsaw University of Technology, Institute of Computer Science, Warsaw, Poland, Apr. 2020. [Online]. Available: https://isyou.info/jowua/papers/jowua-v11n3-3.pdf
R. R. Hastari, M. Yuliana, and P. Kristalina, "Students trajectory pattern finding scheme based on RSSI geolocation as a part of smart campus," in 2021 International Electronics Symposium (IES), Surabaya, Indonesia, 2021, pp. 337-342, doi: 10.1109/IES53407.2021.9594045

End of Presentation
Click the right arrow to return to the beginning of the slide show.
For a downloadable version of this presentation, email: I-SENSE@FAU.