Hyper-local Mirror World Through the Integration of Lidar Data and Digital Twin Modeling

Hyper-local Mirror World Through the Integration of Lidar Data and Digital Twin Modeling
Anton Rajko, REU Student
College of Engineering and Computer Science, FAU
Asif Chowdhury, REU Student
College of Engineering and Computer Science, Lehman College
Research Mentor: Dr. Jinwoo Jang
Associate Professor. Department of Civil, Environmental and Geomatics Engineering, FAU
Faculty Fellow. Institute for Sensing and Embedded Networks Systems Engineering
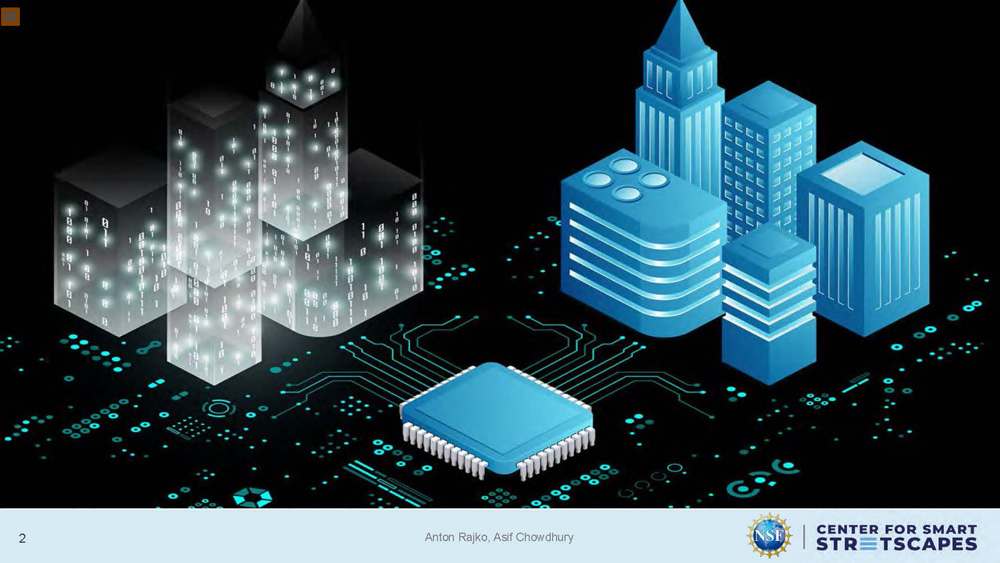
The image shows two groups of stylized buildings. On the left, semi-transparent dark structures with glowing binary numbers (0s and 1s) are displayed. On the right, solid blue buildings with varying shapes and designs are shown. In the center foreground, there is a large computer chip connected to circuit-like lines extending across the background.
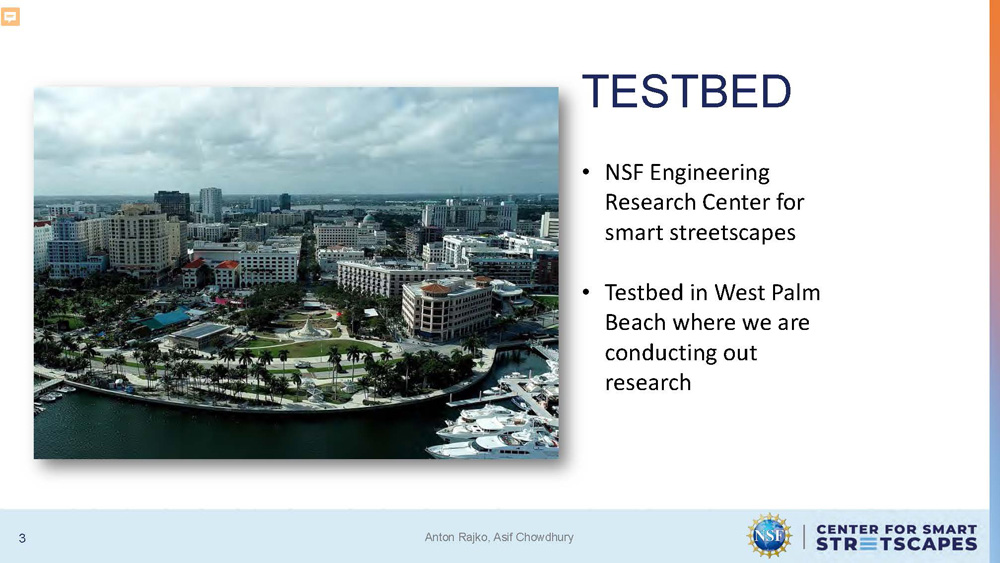
TESTBED
• NSF Engineering Research Center for smart streetscapes
• Testbed in West Palm Beach where we are conducting out research
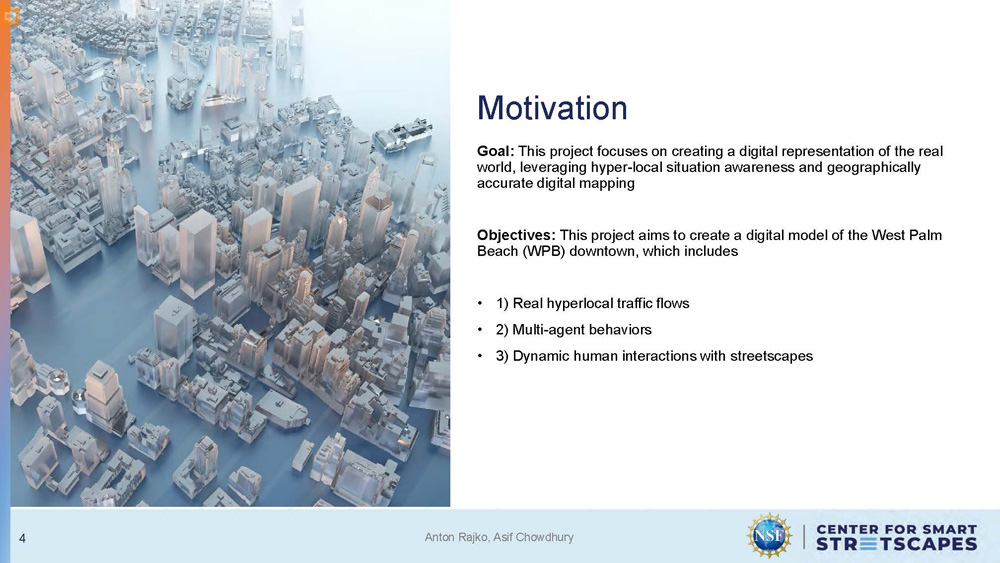
Motivation
Goal: This project focuses on creating a digital representation of the real world, leveraging hyper-local situation awareness and geographically accurate digital mapping
Objectives: This project aims to create a digital model of the West Palm Beach (WPB) downtown, which includes
1) Real hyperlocal traffic flows
2) Multi-agent behaviors
3) Dynamic human interactions with streetscapes
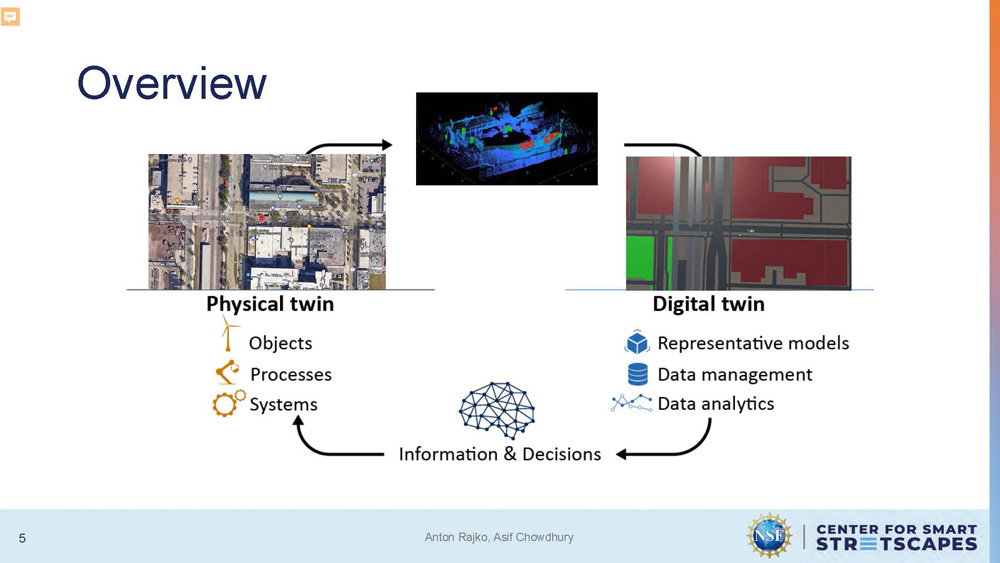
Overview
The diagram illustrates a flow between "Physical twin" on the left and "Digital twin" on the right, connected by arrows that meet at a central node labeled "Information & Decisions."
The "Physical twin" side includes three bullet points:
- Objects
- Processes
- Systems
The "Digital twin" side includes four bullet points:
- Representative models
- Data management
- Data analytics
Above the "Physical twin" text, there are two images. The left image is an aerial view of a city intersection. The right image is a 3D point cloud model of a building interior.
Above the "Digital twin" text, there are also two images. The left is a 3D point cloud of a street scene, while the right is a rendered 3D model of the same scene, showing buildings and roads.
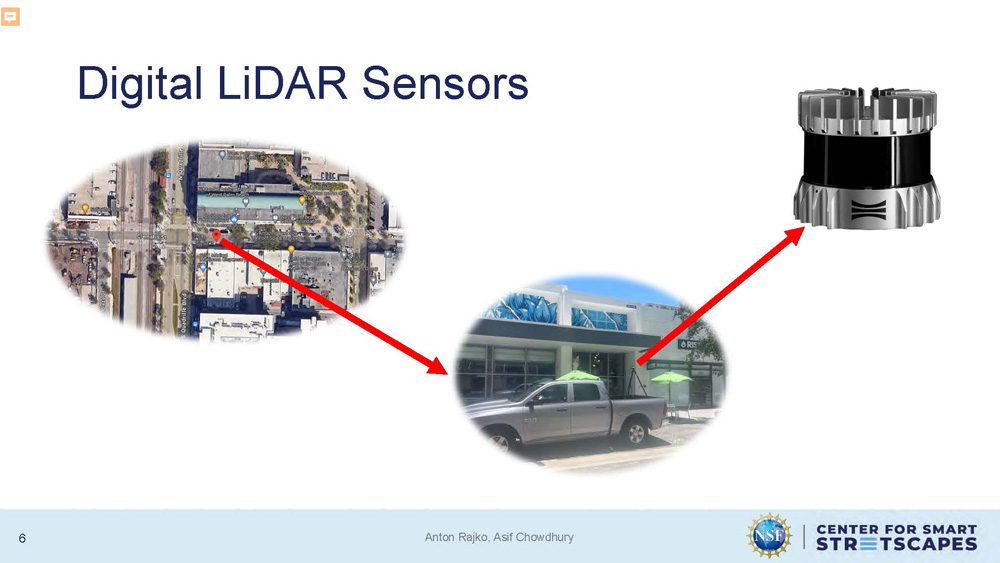
Digital LiDAR Sensors
The image features a diagram showing a sensor and two images, connected by red arrows.
The top right of the slide shows a cylindrical, metallic sensor. A red arrow points from the sensor down to an aerial image of a city intersection on the left. Another red arrow extends from the first one and points to a ground-level image of a street with a car and a building on the right.
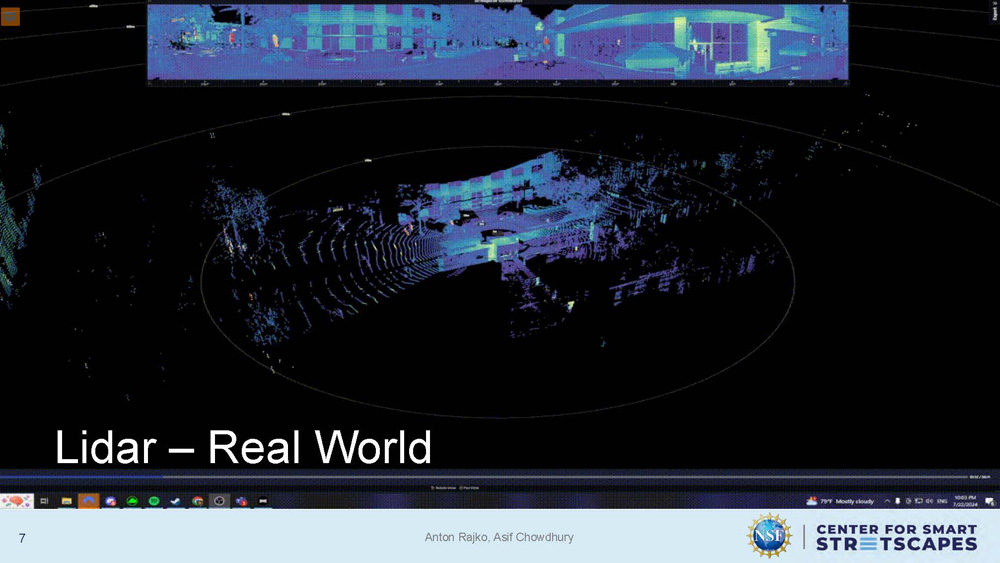
Lidar - Real World
The image shows a LiDAR scan view with blue, purple, and green points forming shapes resembling buildings, trees, and vehicles on a black background. Circular scan lines extend outward from the center. A rectangular inset at the top shows a panoramic view with similar point cloud coloring.
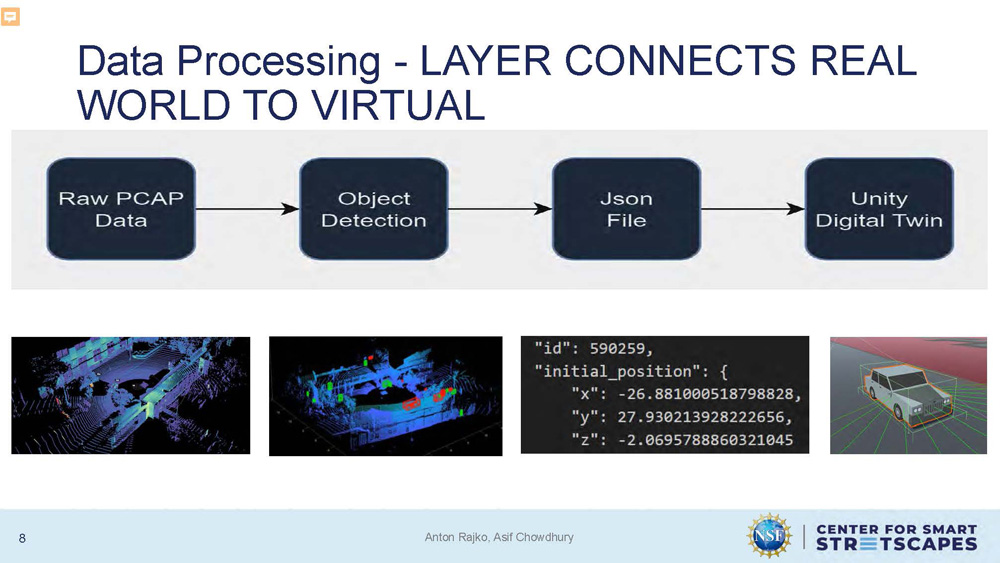
Data Processing - LAYER CONNECTS REAL WORLD TO VIRTUAL
1) Raw PCAP Data
2)
Object Detection
3)
Json File
4)
Unity Digital Twin
Below this flow chart are four corresponding images.
- The first image on the left is a colorful point cloud of what appears to be a street scene.
- The second image is a similar point cloud, but with some objects highlighted in red.
- The third element is a text block displaying code in JavaScript Object Notation (JSON) format. The text includes an "id" and "initial_position" with "x," "y," and "z" coordinates.
- The final image on the right shows a 3D model of a car in a digital environment, corresponding to the "Unity Digital Twin" step.
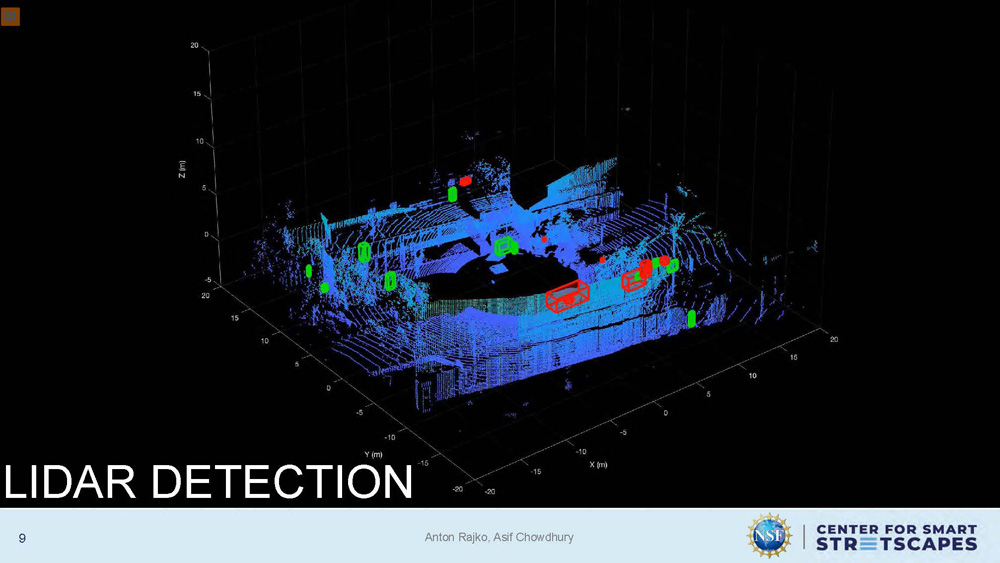
LIDAR DETECTION
TThe image displays a 3D LiDAR point cloud with blue points forming structures, trees, and ground surfaces. Several objects are highlighted with rectangular outlines in red and green. Axis lines labeled X, Y, and Z are visible along the edges.
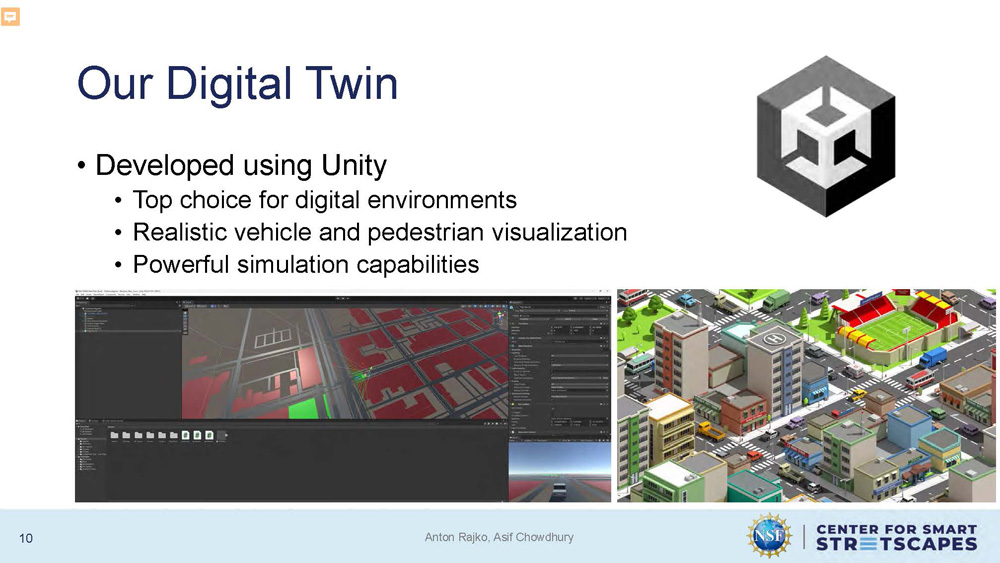
Our Digital Twin
Developed using Unity
• Top choice for digital environments
•Realistic vehicle and pedestrian visualization
•Powerful simulation capabilities
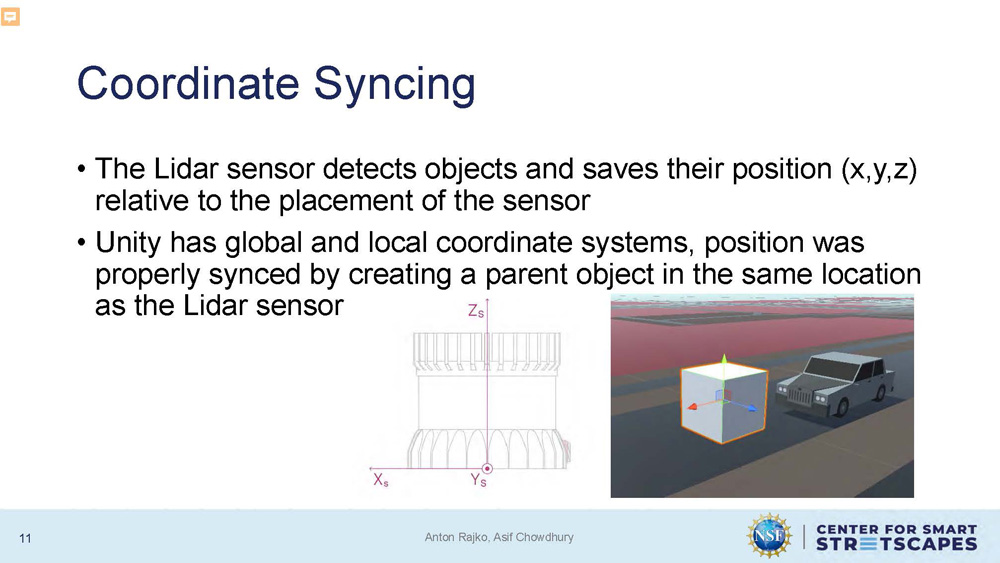
Coordinate Syncing
The Lidar sensor detects objects and saves their position (x,y,z) relative to the placement of the sensor
Unity has global and local coordinate systems, position was properly synced by creating a parent object in the same location as the Lidar sensor
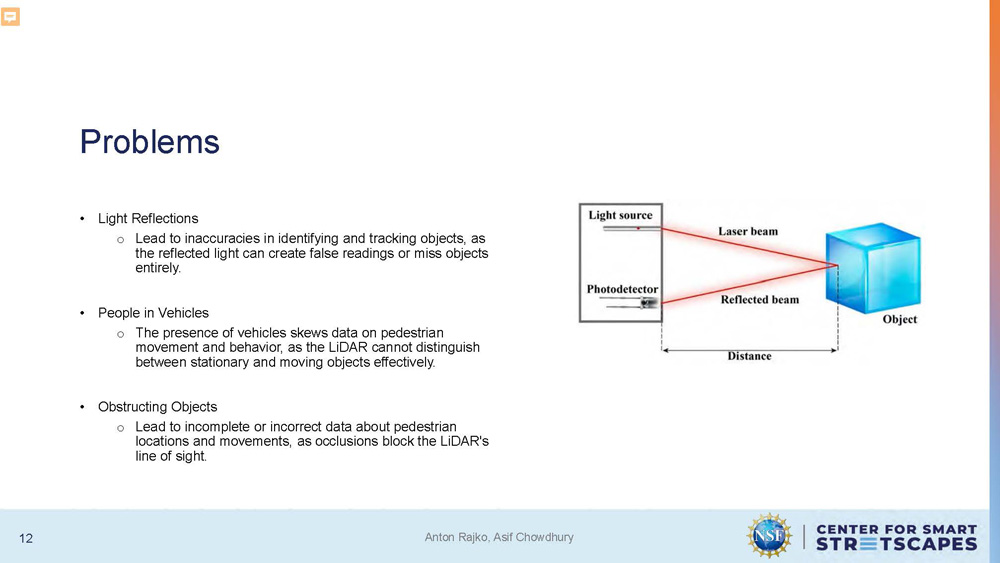
Problems
Light Reflections
Lead to inaccuracies in identifying and tracking objects, as the reflected light can create false readings or miss objects entirely.
People in Vehicles
The presence of vehicles skews data on pedestrian movement and behavior, as the LiDAR cannot distinguish between stationary and moving objects effectively.
Obstructing Objects
Lead to incomplete or incorrect data about pedestrian locations and movements, as occlusions block the LiDAR's line of sight.

Video placeholder slide
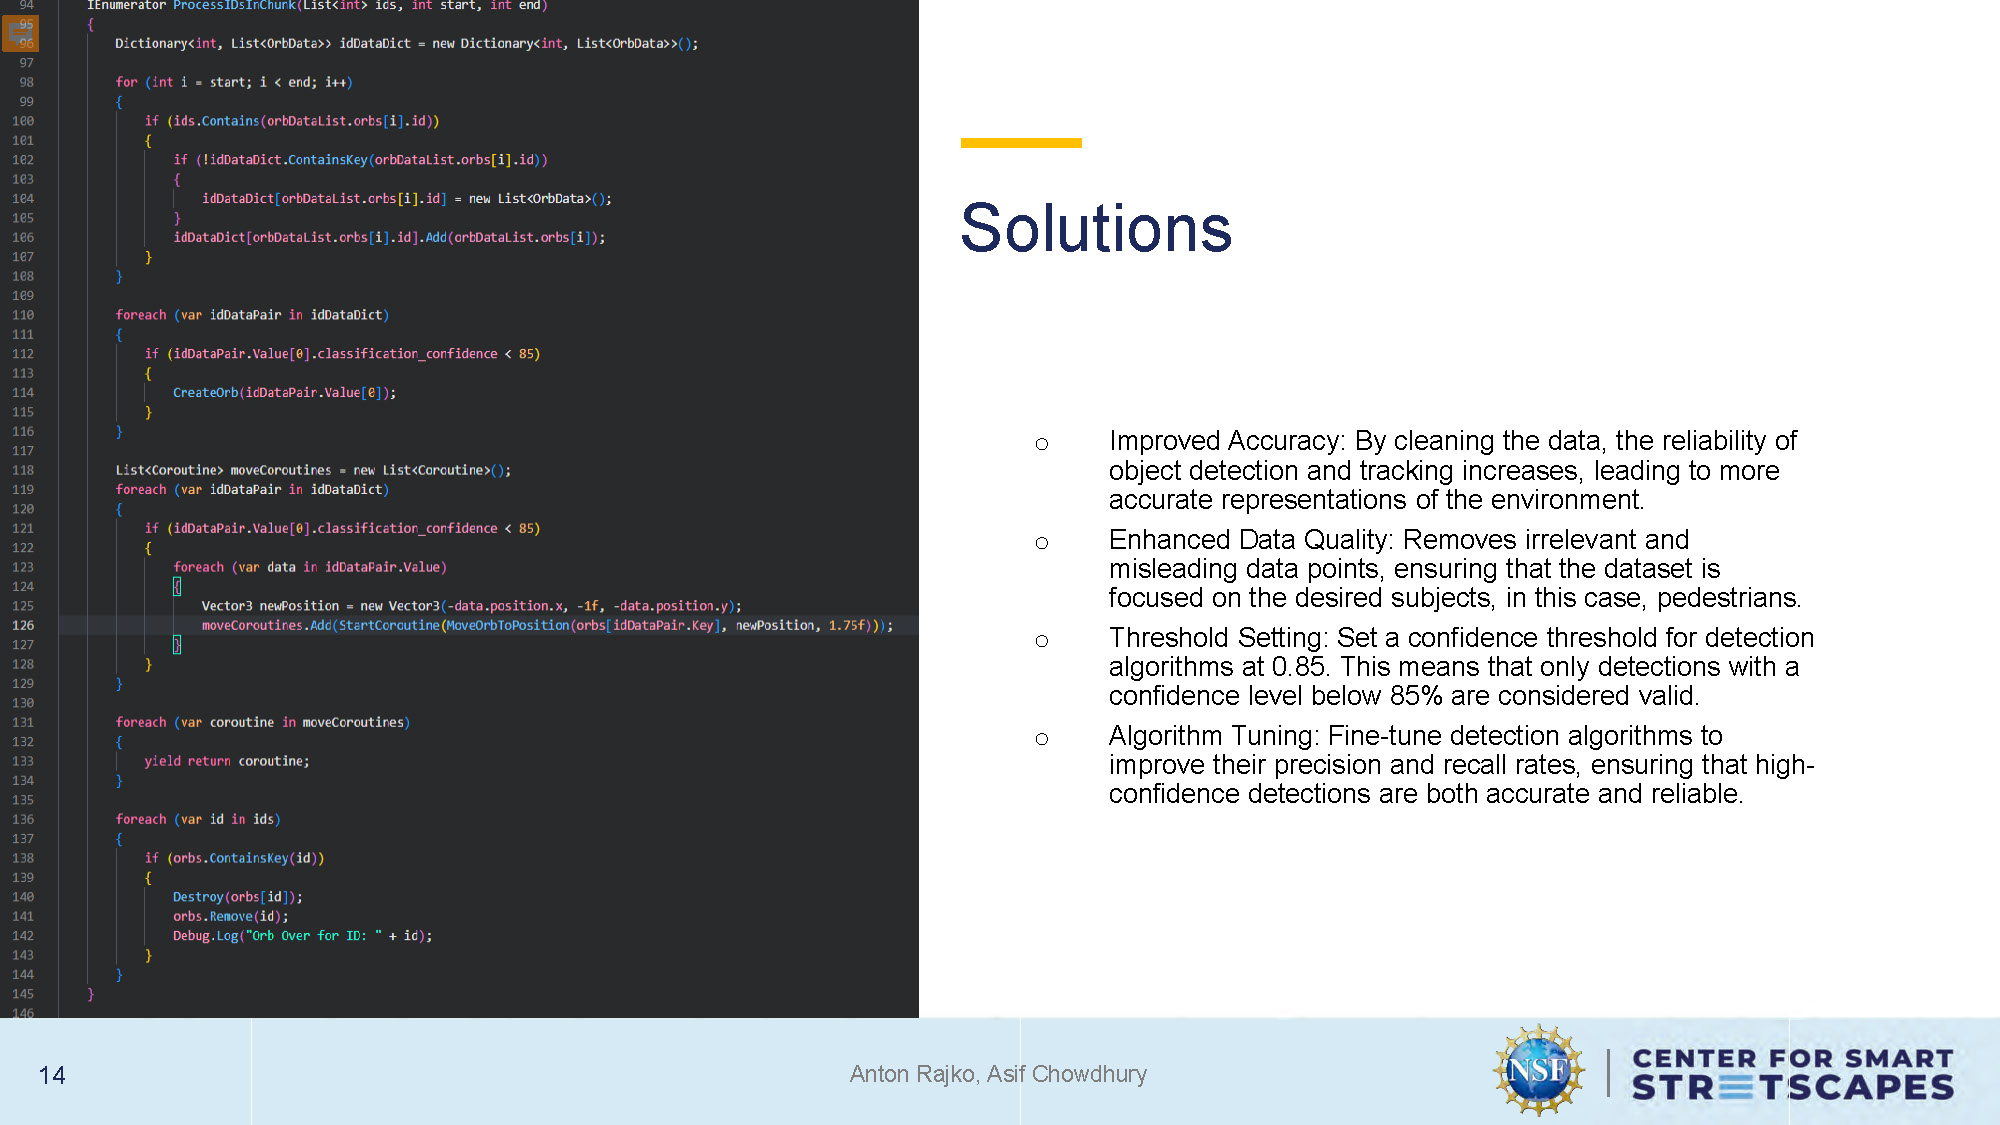
Solutions
Improved Accuracy: By cleaning the data, the reliability of object detection and tracking increases, leading to more accurate representations of the environment.
Enhanced Data Quality: Removes irrelevant and misleading data points, ensuring that the dataset is focused on the desired subjects, in this case, pedestrians.
Threshold Setting: Set a confidence threshold for detection algorithms at 0.85. This means that only detections with a confidence level below 85% are considered valid.
Algorithm Tuning: Fine-tune detection algorithms to improve their precision and recall rates, ensuring that high-confidence detections are both accurate and reliable.
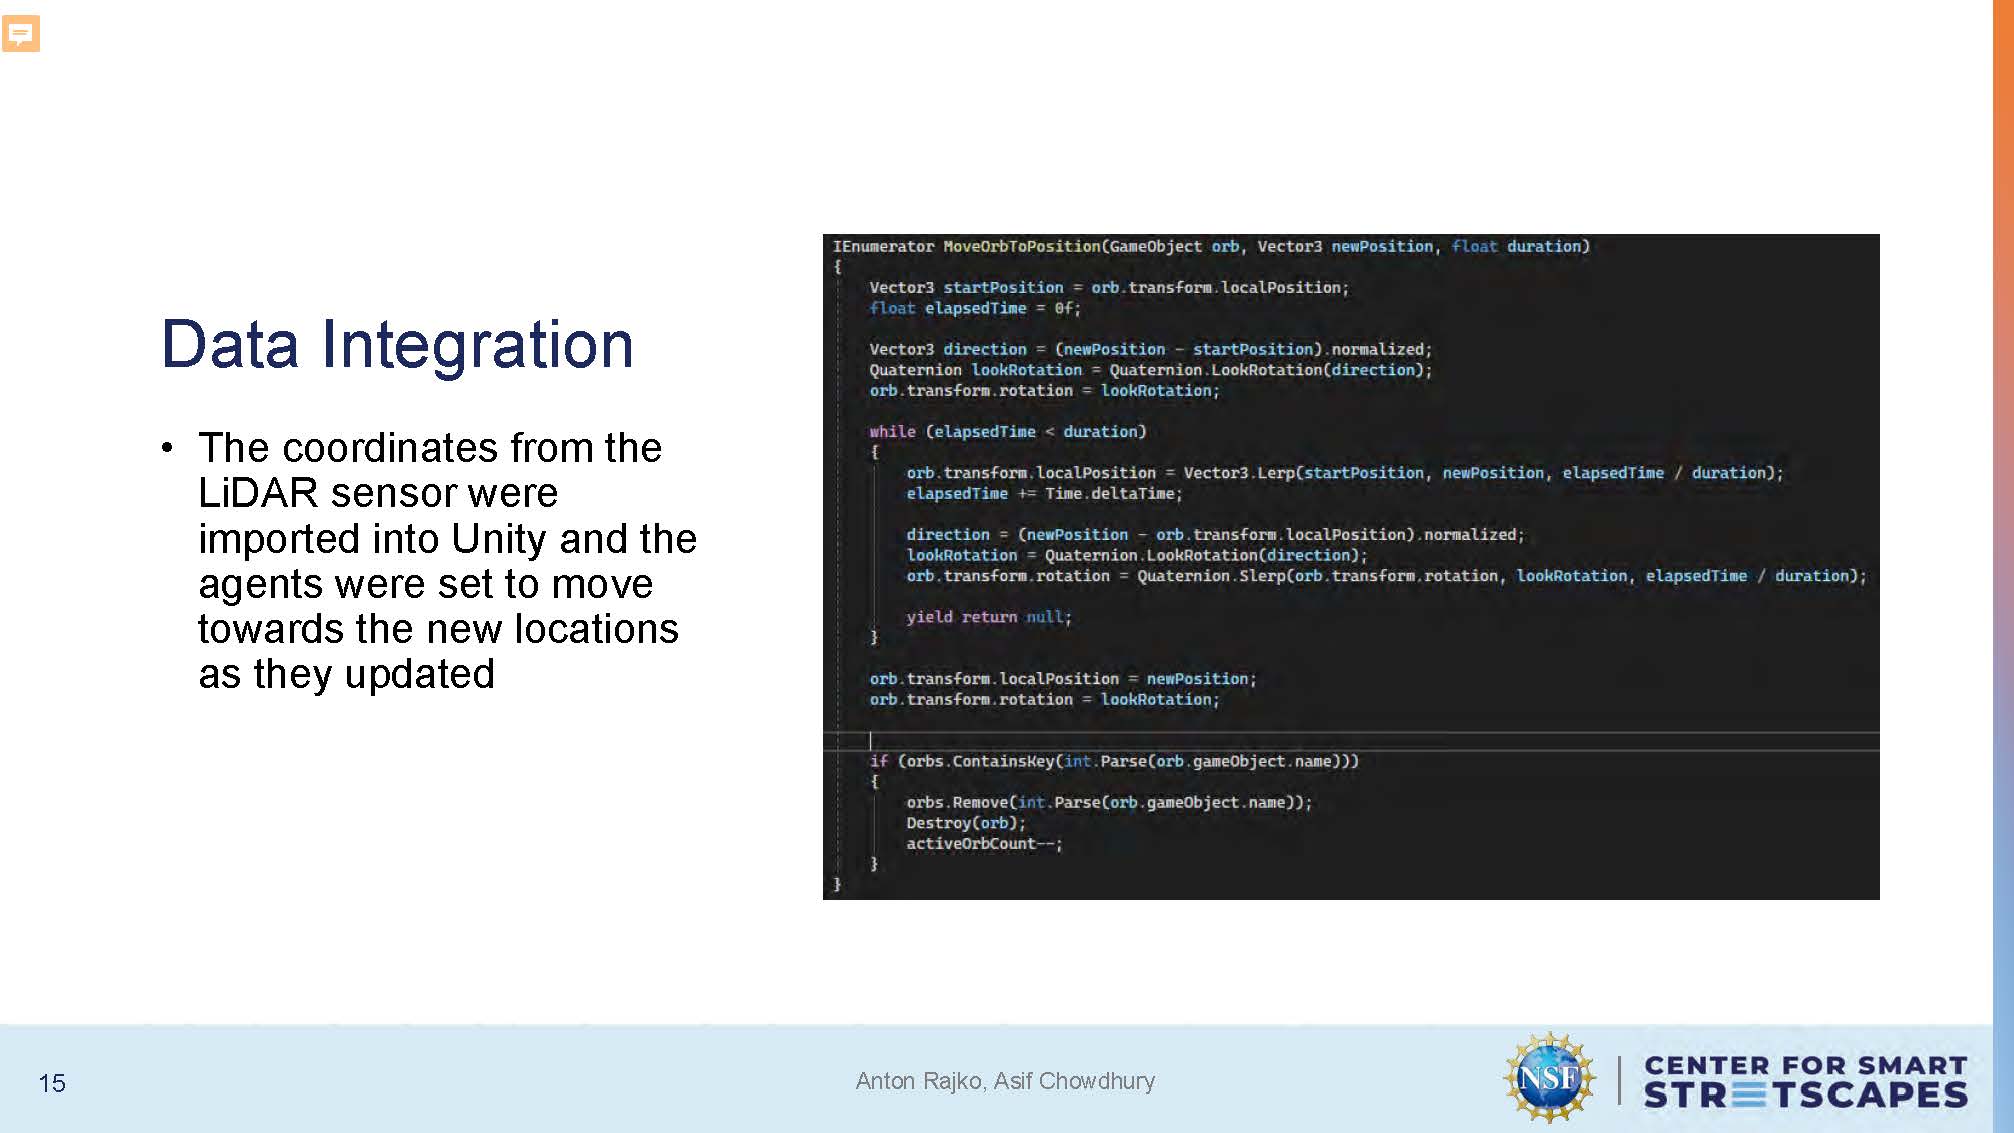
Data Integration
The coordinates from the LiDAR sensor were imported into Unity and the agents were set to move towards the new locations as they updated

Video placeholder slide
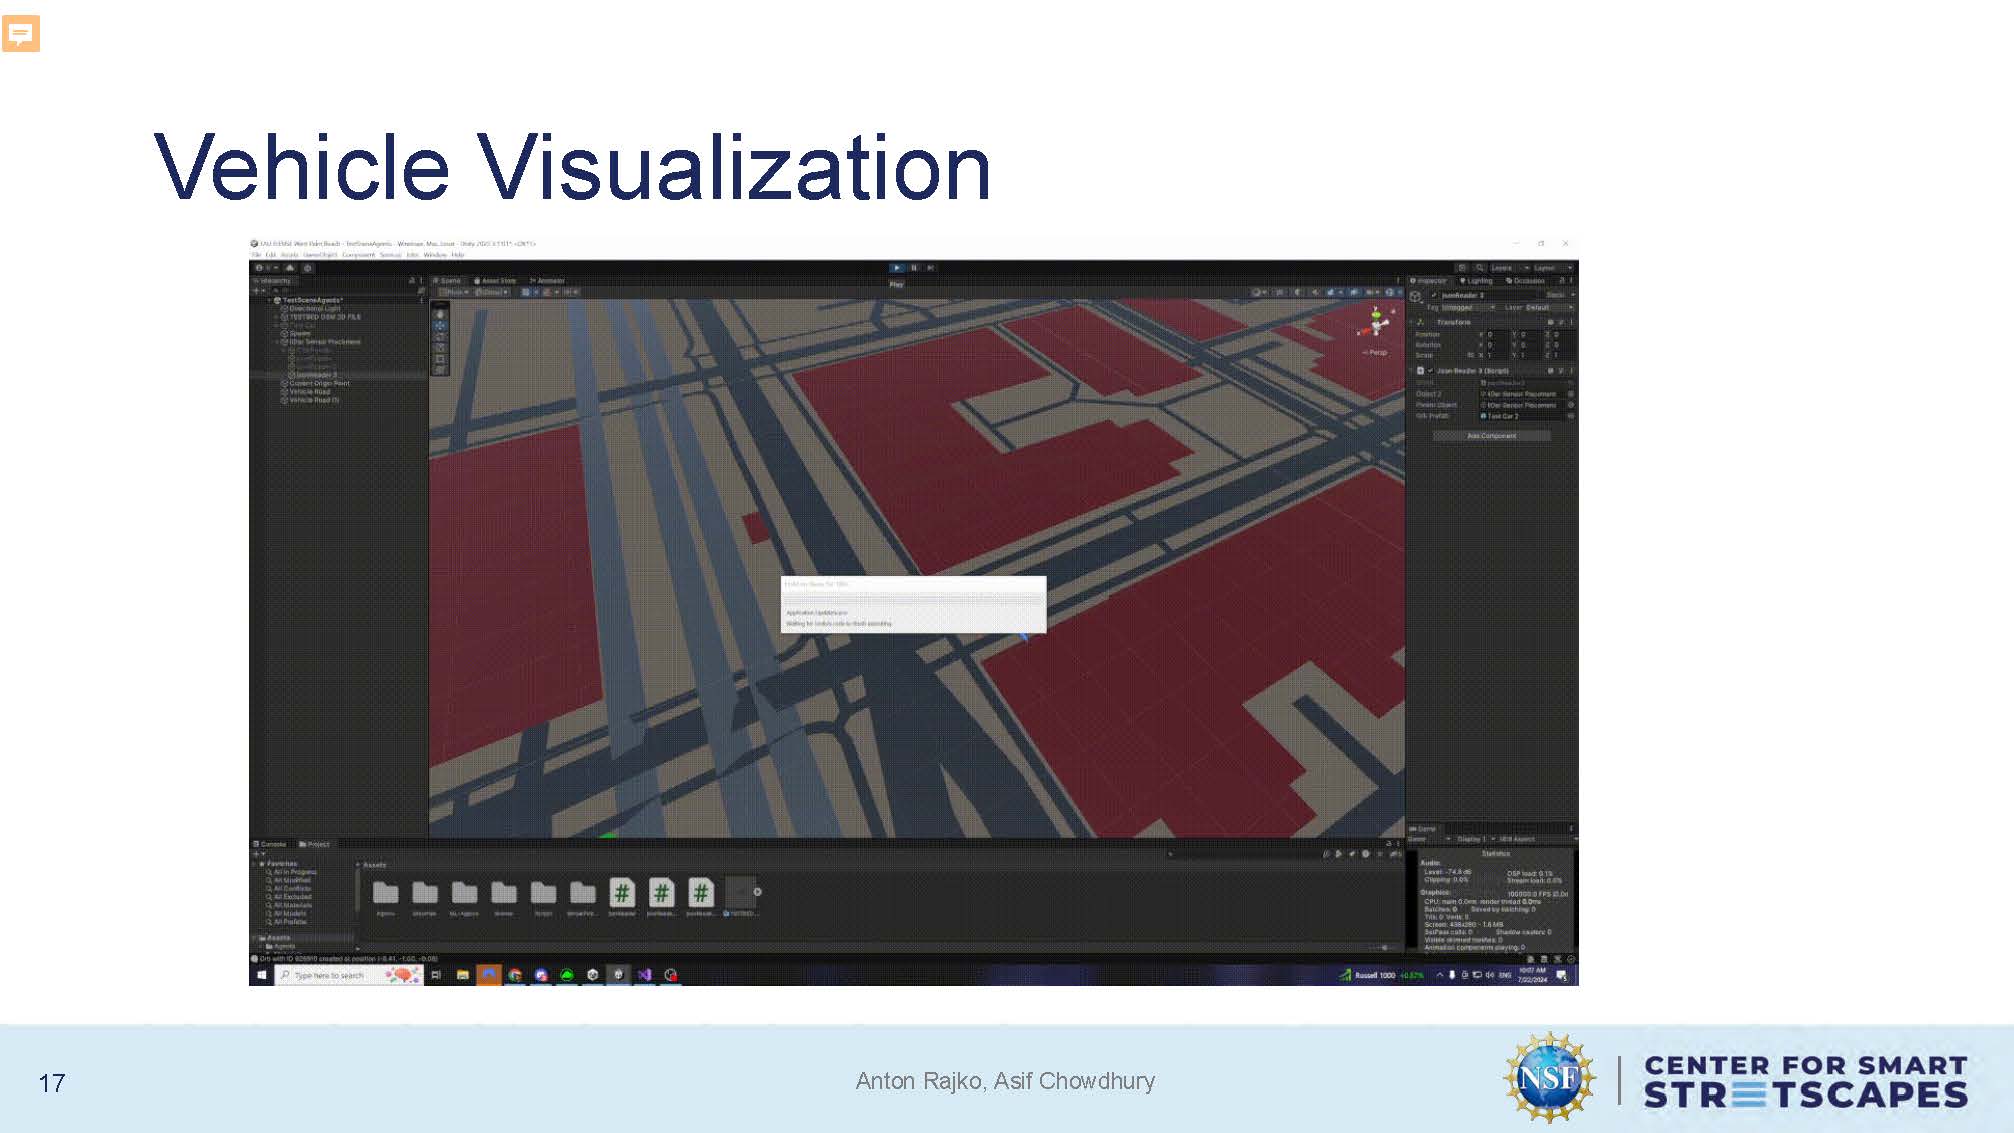
Vehicle Visualization
The slide shows the Unity digital twin environment with realistic vehicle visualization, displaying cars and urban infrastructure in the simulated streetscape.
Future Work
Machine Learning Agents trained on LiDar data
Integrate work with West Palm Beach twin
Conclusion
This project demonstrated the potential of combining advanced sensing technologies with immersive simulations to enhance urban planning, traffic management, and smart city applications
Acknowledgment
This work was fully supported by the U.S. National Science Foundation (EEC- 2133516)

Questions & Feedback

End of Presentation
Click the right arrow to return to the beginning of the slide show.
For a downloadable version of this presentation, email: I-SENSE@FAU.