Alzheimer's Disease Detection via Machine Learning

Scholar: Ethan Zhu
Mentor: Dr. Behnaz Ghoraani & Marjan Nassajpour Esfahani
Program: FAU Summer I-SENSE 2024
Health and Behavior: Next-Gen Health Monitoring Empowered by Python Programming and Deep Learning Applications
Table of Contents
Introduction and Objectives
Data Preprocessing and Visualization
Feature Extraction and ML Classification
Findings / Conclusion
Existing Challenges
EEG signals are highly non-linear and non-stationary, making them noisy and challenging to analyze.
Limited availability of public data sets restricts the ability to develop and validate models
lack of standardized international protocols, complicating consistent data collection and analysis
Extracting significant features from EEG data is difficult
Objectives
- Develop new algorithms to break down data for analysis
- Use existing algorithms to classify patients using data
- Validate existing methods for classifying patients
- Visualization of decomposed data signals and features
Introduce new data processing/analyzing techniques while using existing machine learning methods for sorting and classification
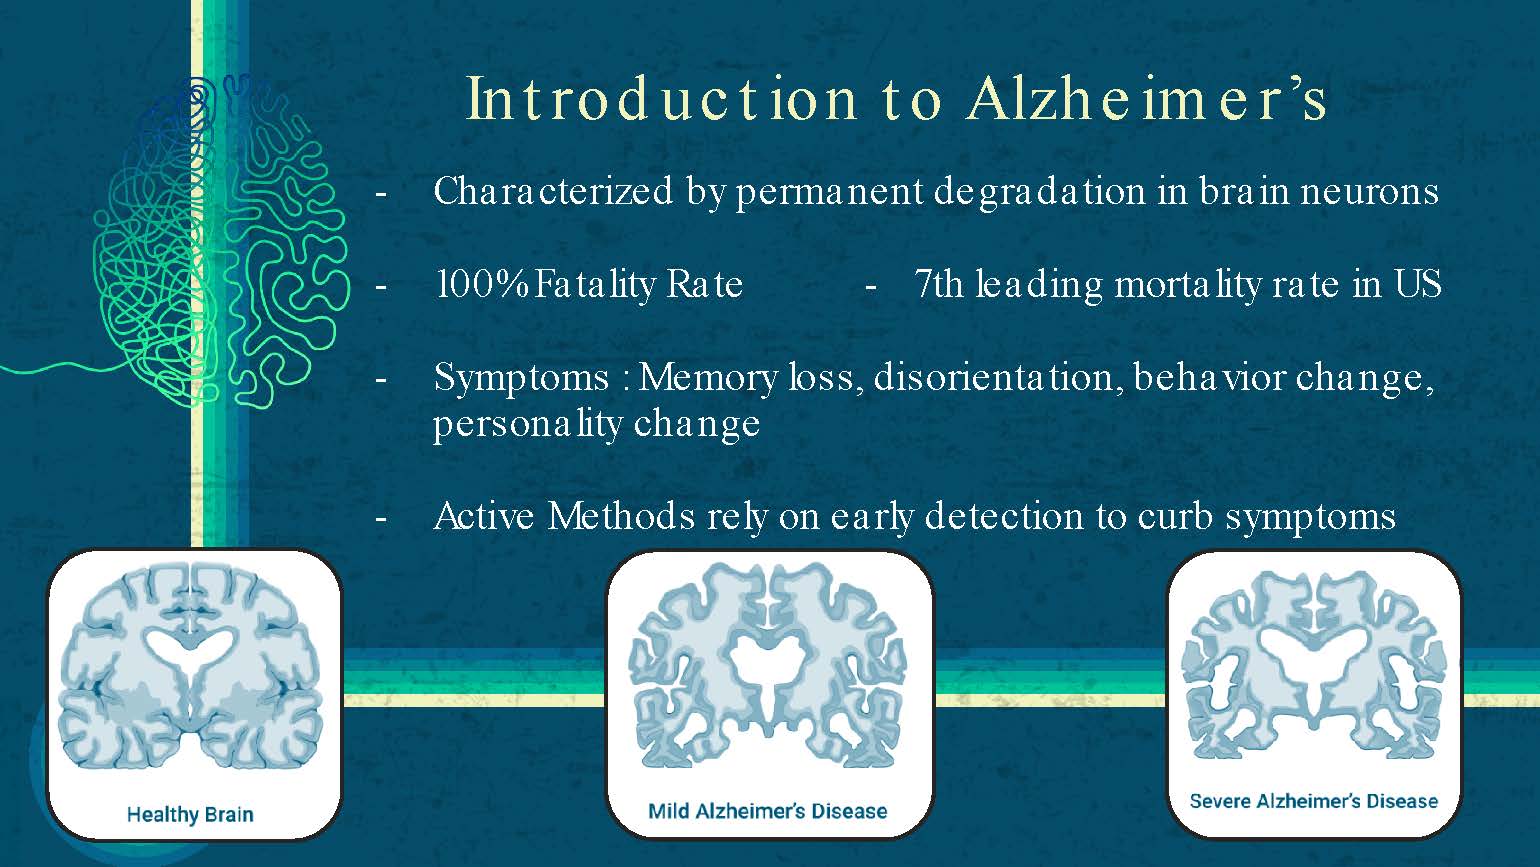
Introduction to Alzheimer's
Characterized by permanent degradation in brain neurons
100% Fatality Rate - 7th leading mortality rate in US
Symptoms: Memory loss, disorientation, behavior change, personality change
Active Methods rely on early detection to curb symptoms
Table of Contents
Introduction and Objectives
Data Preprocessing and Visualization
Feature Extraction and ML Classification
Findings / Conclusion
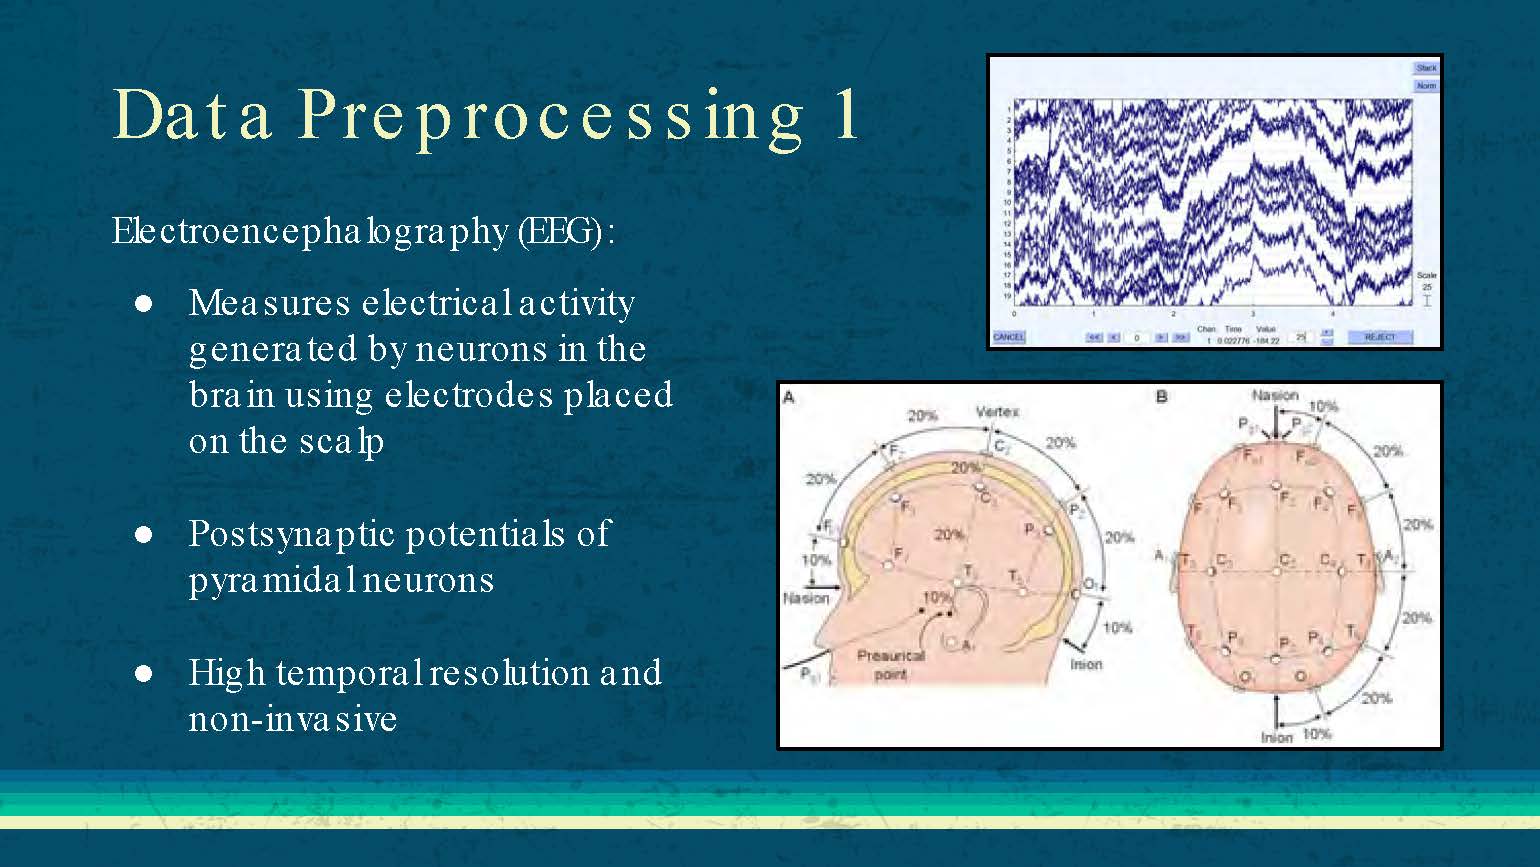
Data Preprocessing 1
Electroencephalography (EEG):
Measures electrical activity generated by neurons in the brain using electrodes placed on the scalp
Postsynaptic potentials of pyramidal neurons
High temporal resolution and non-invasive
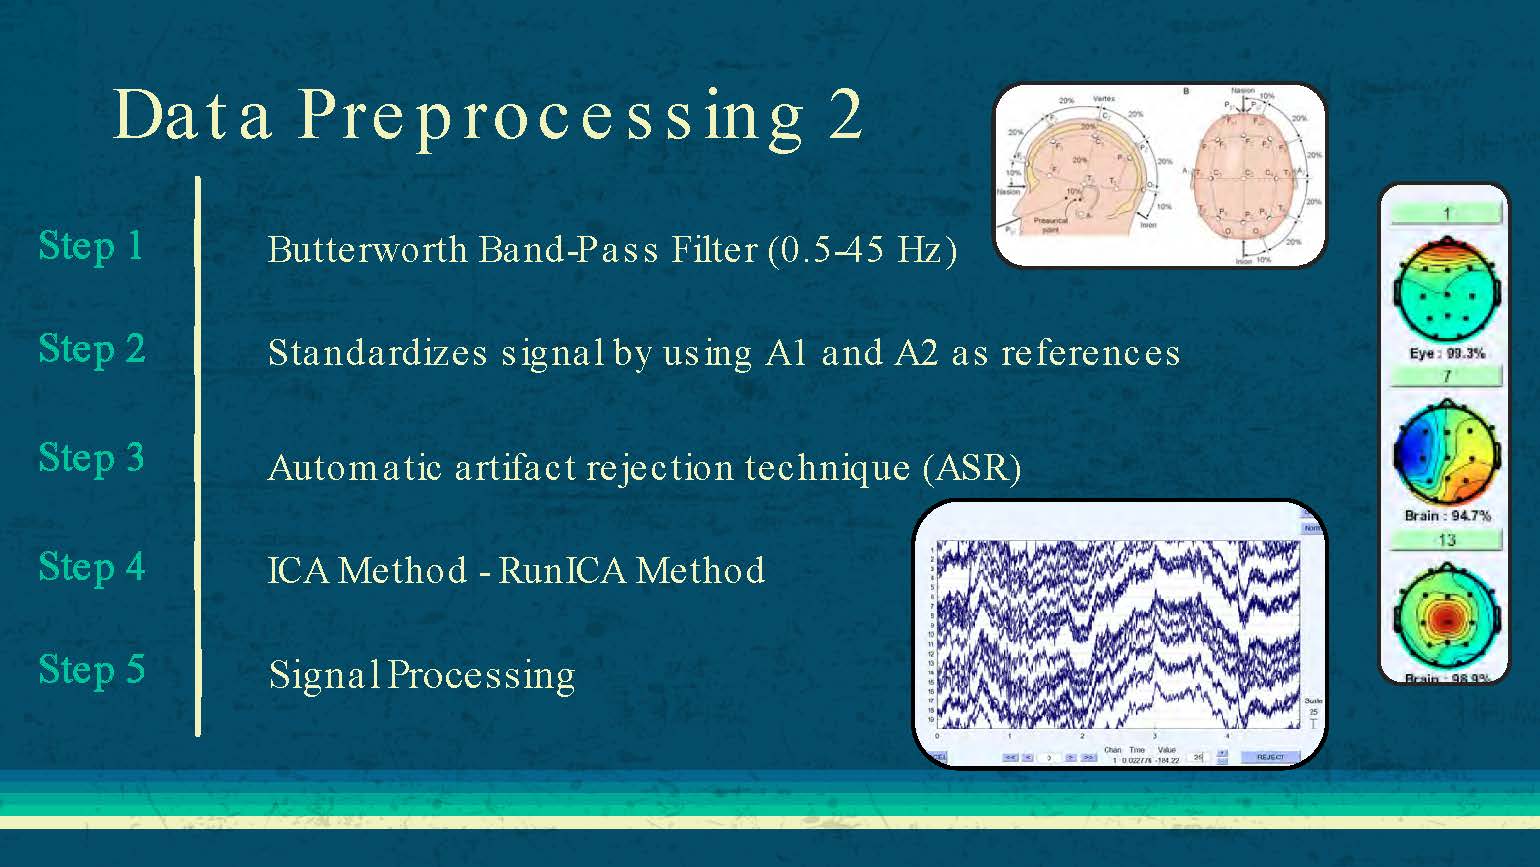
Data Preprocessing 2
Step 1: Butterworth Band-Pass Filter (0.5-45 Hz)
Step 2: Standardizes signal by using A1 and A2 as references
Step 3: Automatic artifact rejection technique (ASR)
Step 4: ICA Method - RunICA Method
Step 5: Signal Processing
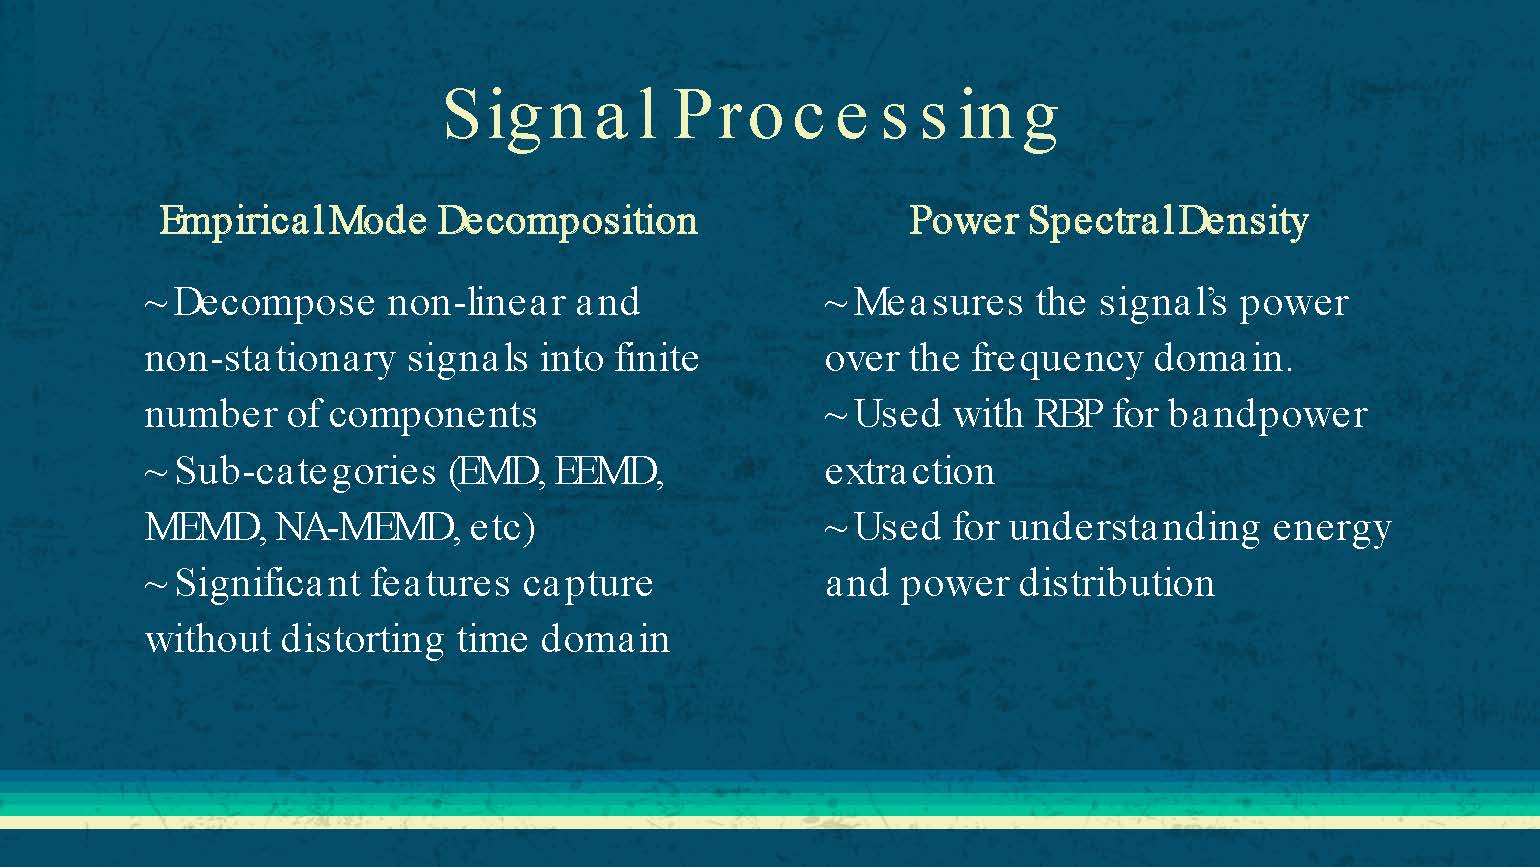
Signal Processing
Empirical Mode Decomposition
Decompose non-linear and non-stationary signals into finite number of components
Sub-categories (EMD, EEMD, MEMD, NA-MEMD, etc)
Significant features capture without distorting time domain
Power Spectral Density
Measures the signal's power over the frequency domain.
Used with RBP for bandpower extraction
Used for understanding energy and power distribution
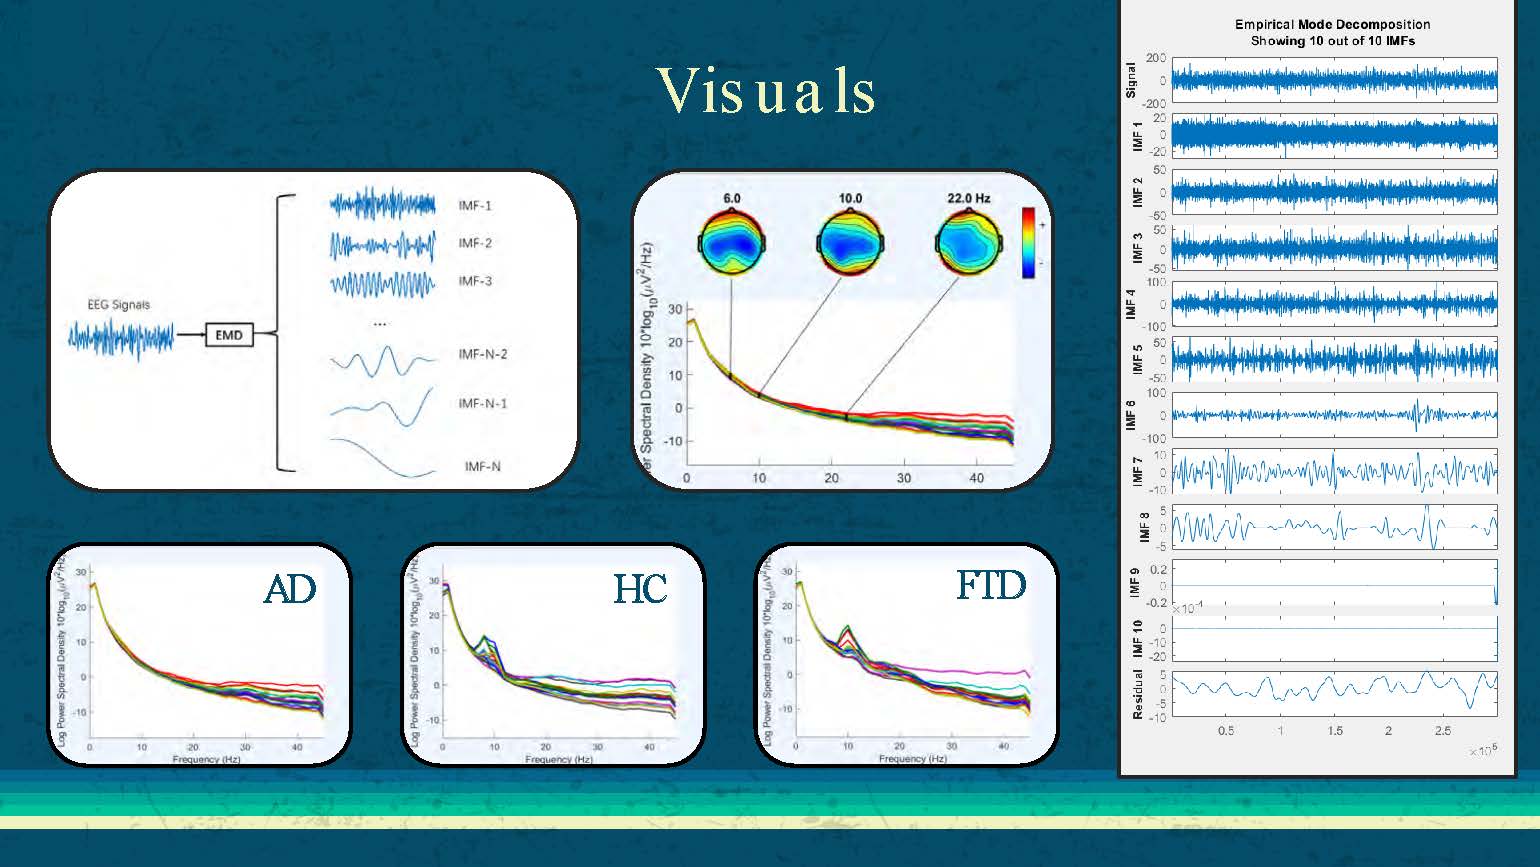
Visuals
The slide displays EEG signal visualizations for three groups: AD (Alzheimer's Disease), HC (Healthy Controls), and FTD (Frontotemporal Dementia). The visualizations show different patterns of brain activity across these conditions, demonstrating the distinguishable characteristics that can be used for classification purposes.
Table of Contents
Introduction and Objectives
Data Preprocessing and Visualization
Feature Extraction and ML Classification
Findings / Conclusion
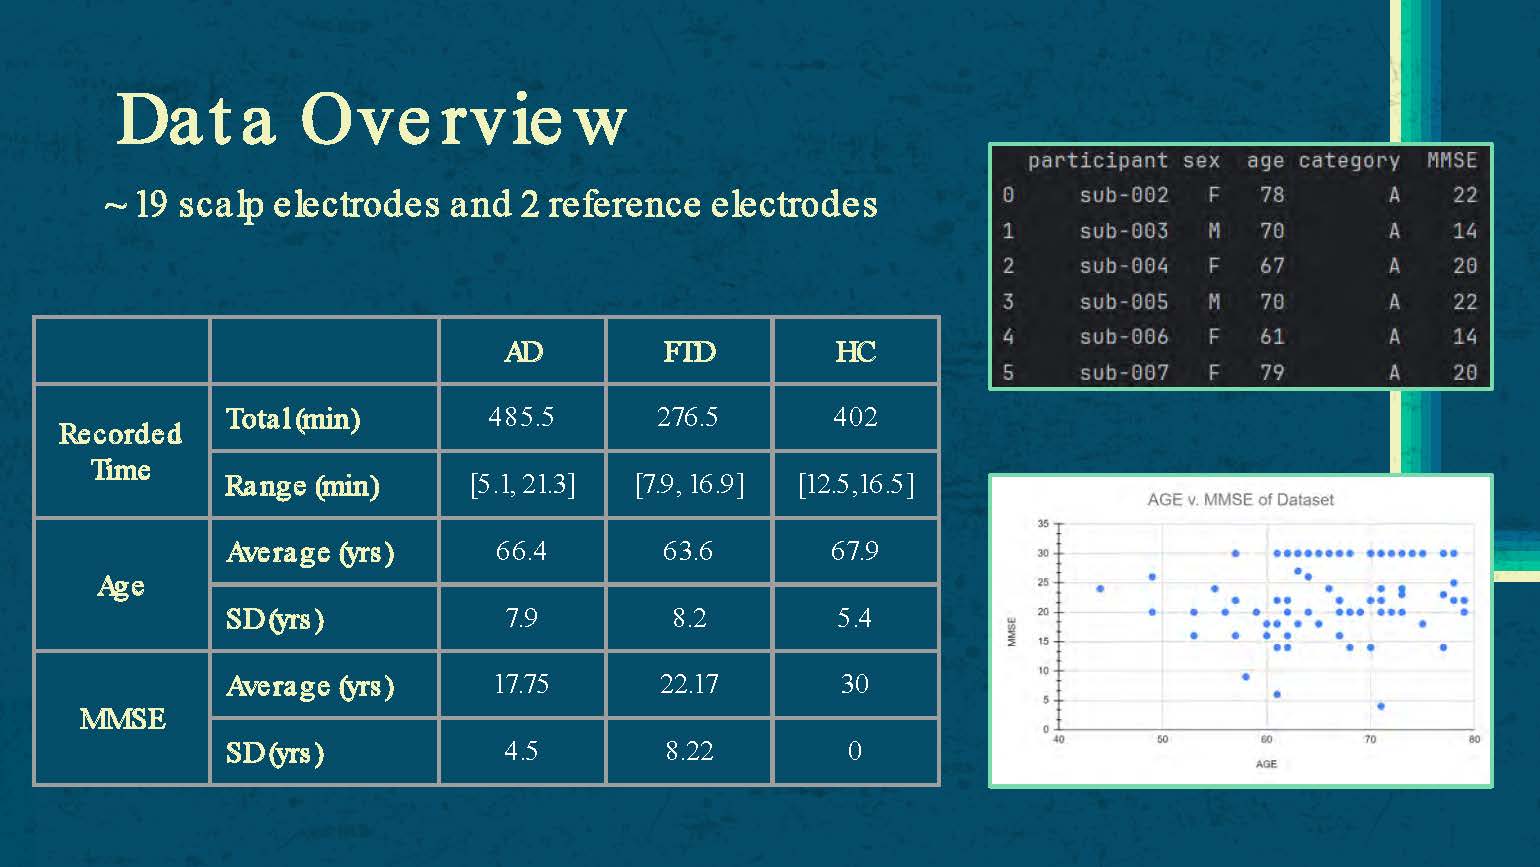
Data Overview
19 scalp electrodes and 2 reference electrodes
| AD | FTD | HC | |
|---|---|---|---|
| Recorded Time | |||
| Total (min) | 485.5 | 276.5 | 402 |
| Range (min) | [5.1, 21.3] | [7.9, 16.9] | [12.5,16.5] |
| Age | |||
| Average (yrs) | 66.4 | 63.6 | 67.9 |
| SD (yrs) | 7.9 | 8.2 | 5.4 |
| MMSE | |||
| Average (yrs) | 17.75 | 22.17 | 30 |
| SD (yrs) | 4.5 | 8.22 | 0 |
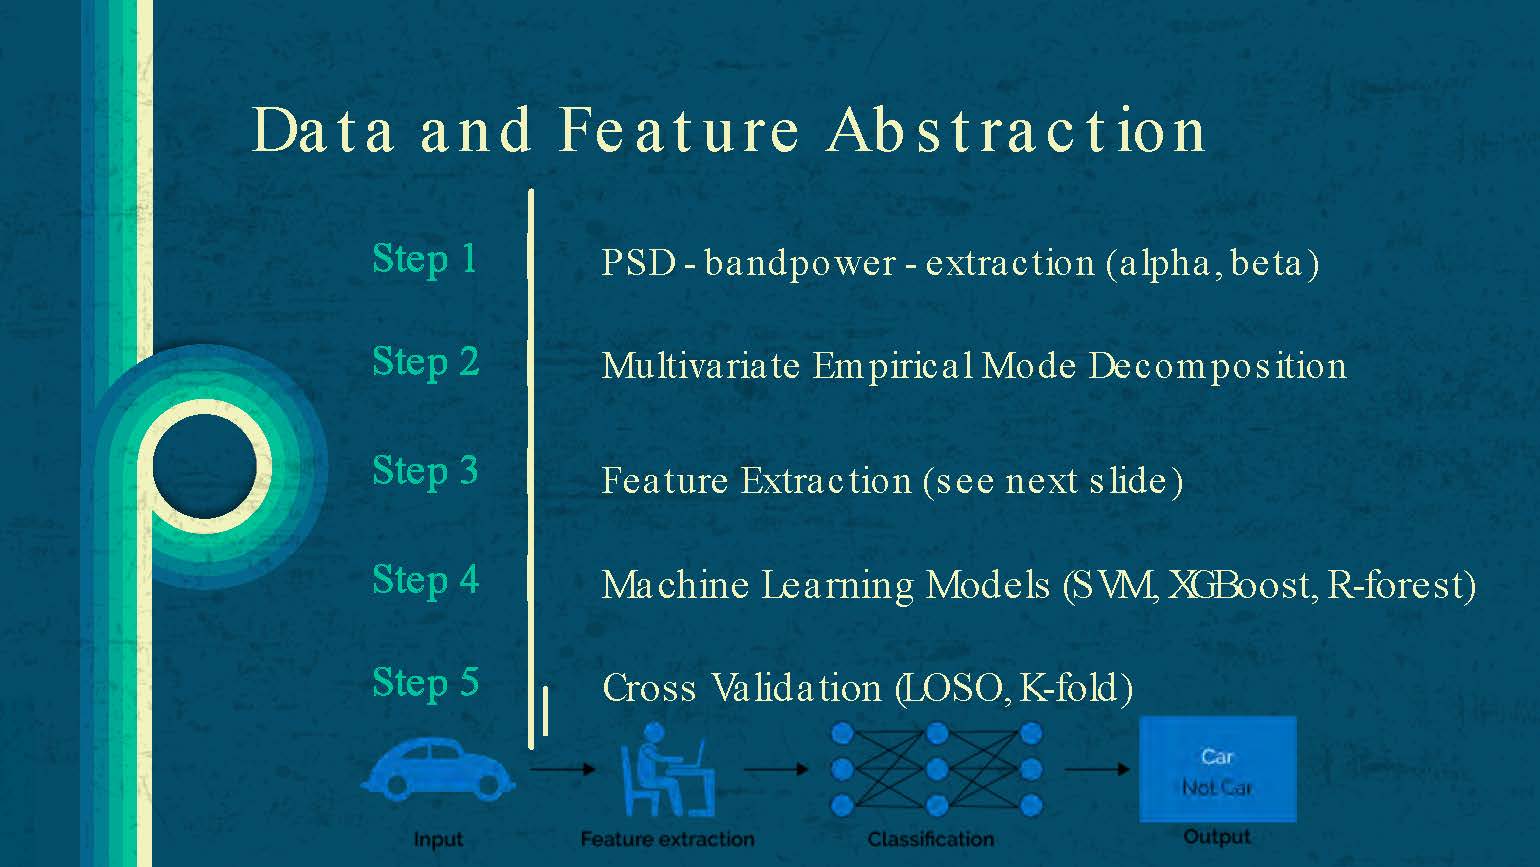
Data and Feature Abstraction
Step 1: PSD - bandpower - extraction (alpha, beta)
Step 2: Multivariate Empirical Mode Decomposition
Step 3: Feature Extraction (see next slide)
Step 4: Machine Learning Models (SVM, XGBoost, R-forest)
Step 5: Cross Validation (LOSO, K-fold)
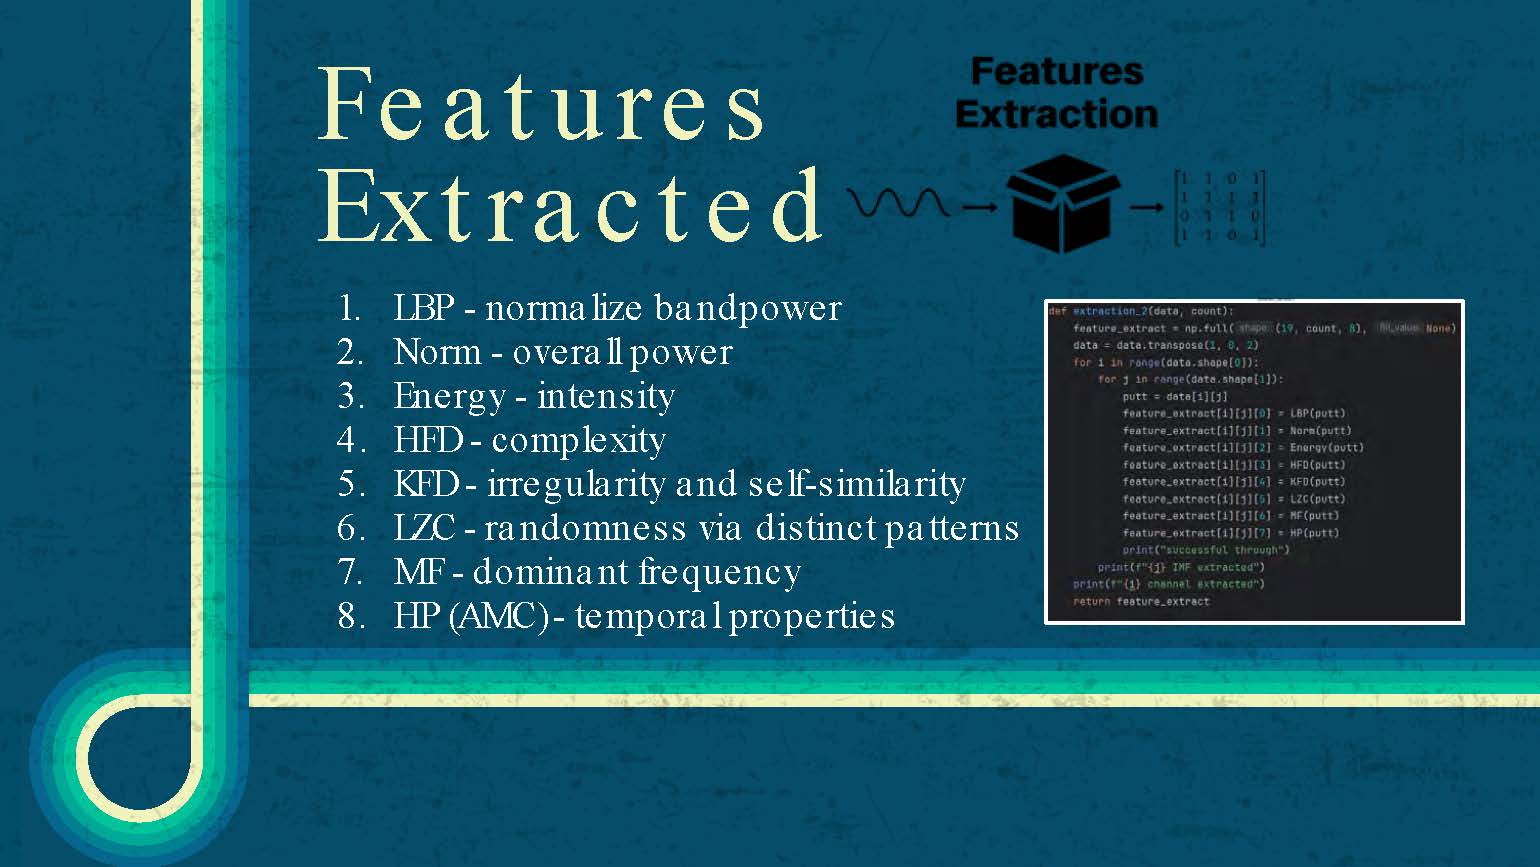
Features Extracted
- LBP - normalize bandpower
- Norm - overall power
- Energy - intensity
- HFD - complexity
- KFD - irregularity and self-similarity
- LZC - randomness via distinct patterns
- MF - dominant frequency
- HP (AMC) - temporal properties
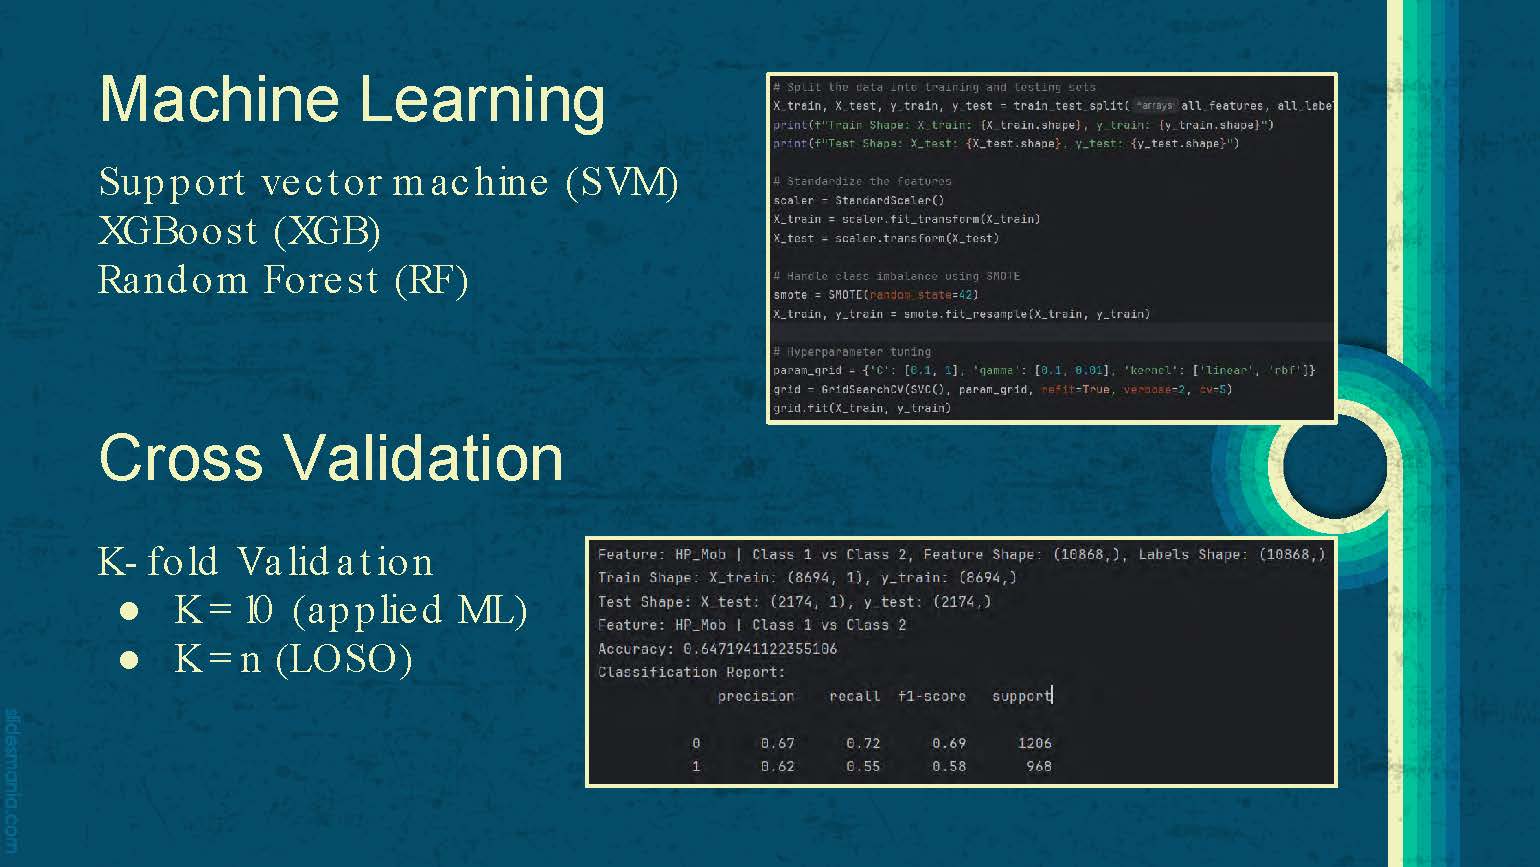
Cross Validation
K-fold Validation
K = 10 (applied ML)
K = n (LOSO)
Machine Learning
Support vector machine (SVM)
XGBoost (XGB)
Random Forest (RF)
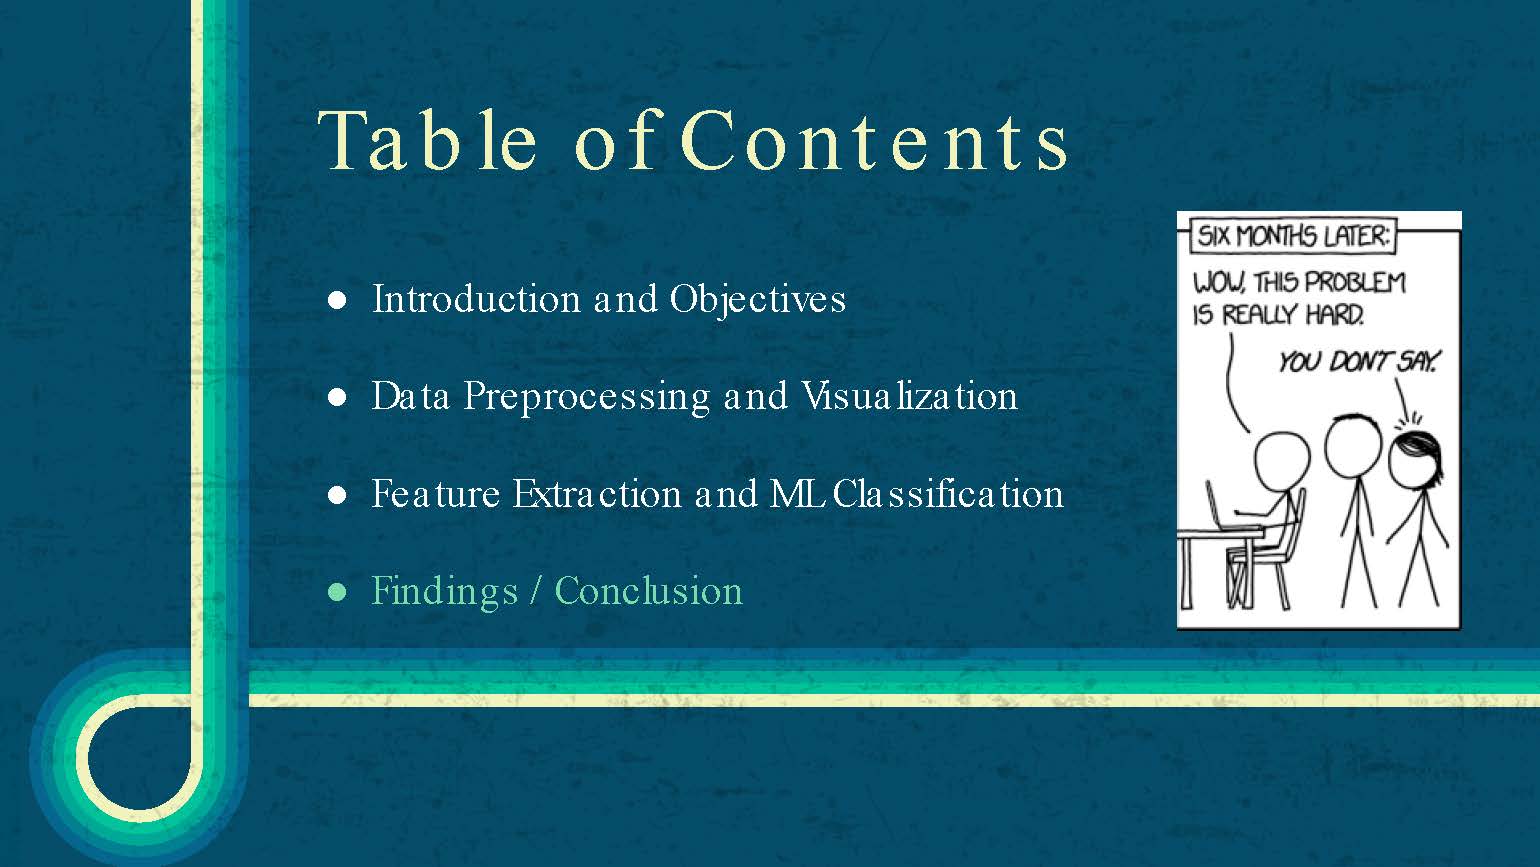
Table of Contents
Introduction and Objectives
Data Preprocessing and Visualization
Feature Extraction and ML Classification
Findings / Conclusion
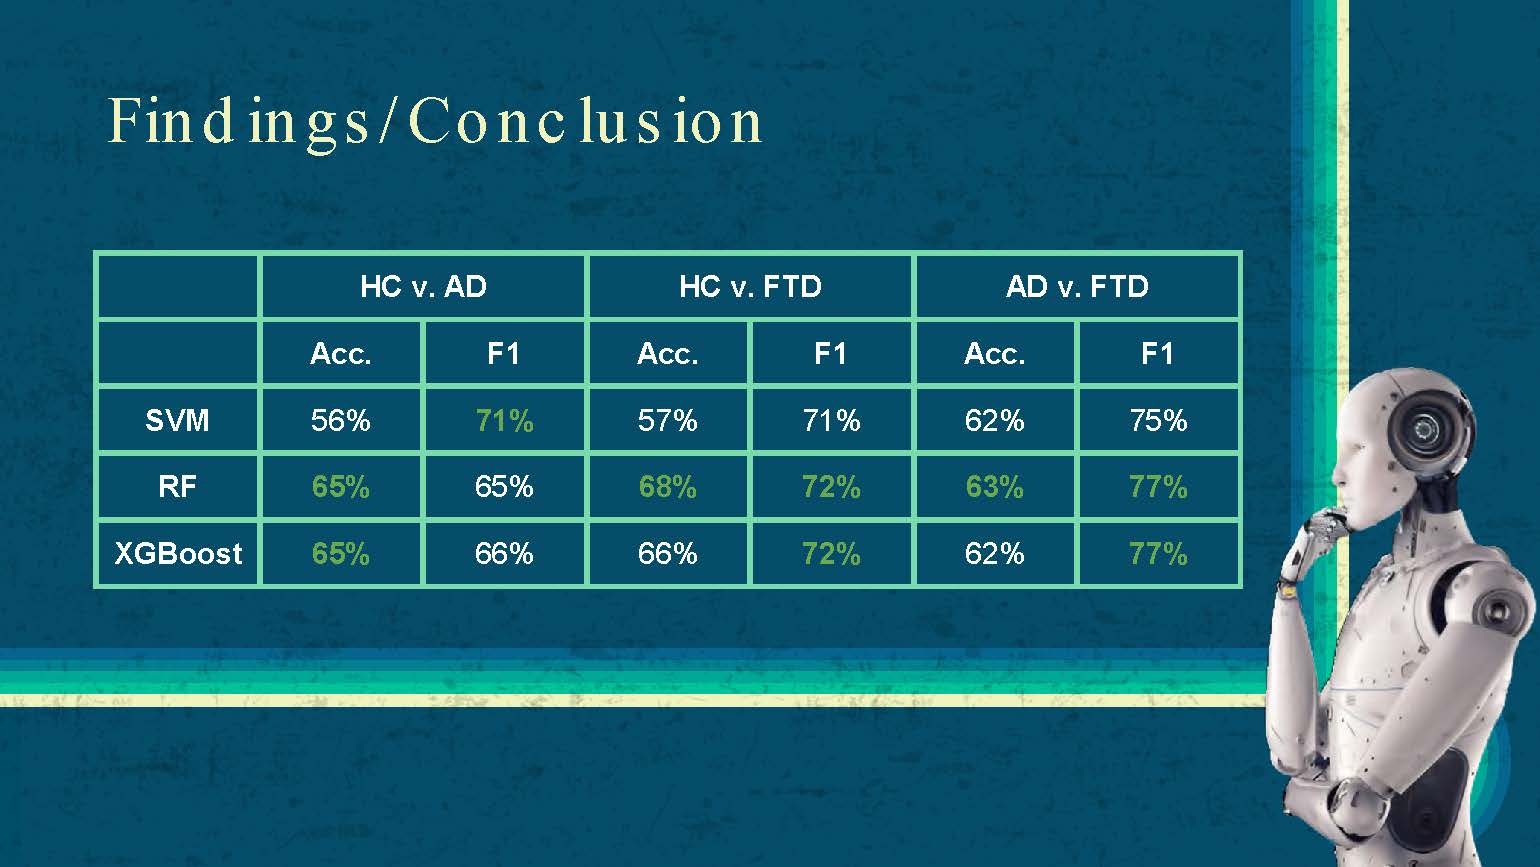
Findings / Conclusion
| HC v. AD | HC v. FTD | AD v. FTD | ||||
|---|---|---|---|---|---|---|
| Acc. | F1 | Acc. | F1 | Acc. | F1 | |
| SVM | 56% | 71% | 57% | 71% | 62% | 75% |
| RF | 65% | 65% | 68% | 72% | 63% | 77% |
| XGBoost | 65% | 66% | 66% | 72% | 62% | 77% |
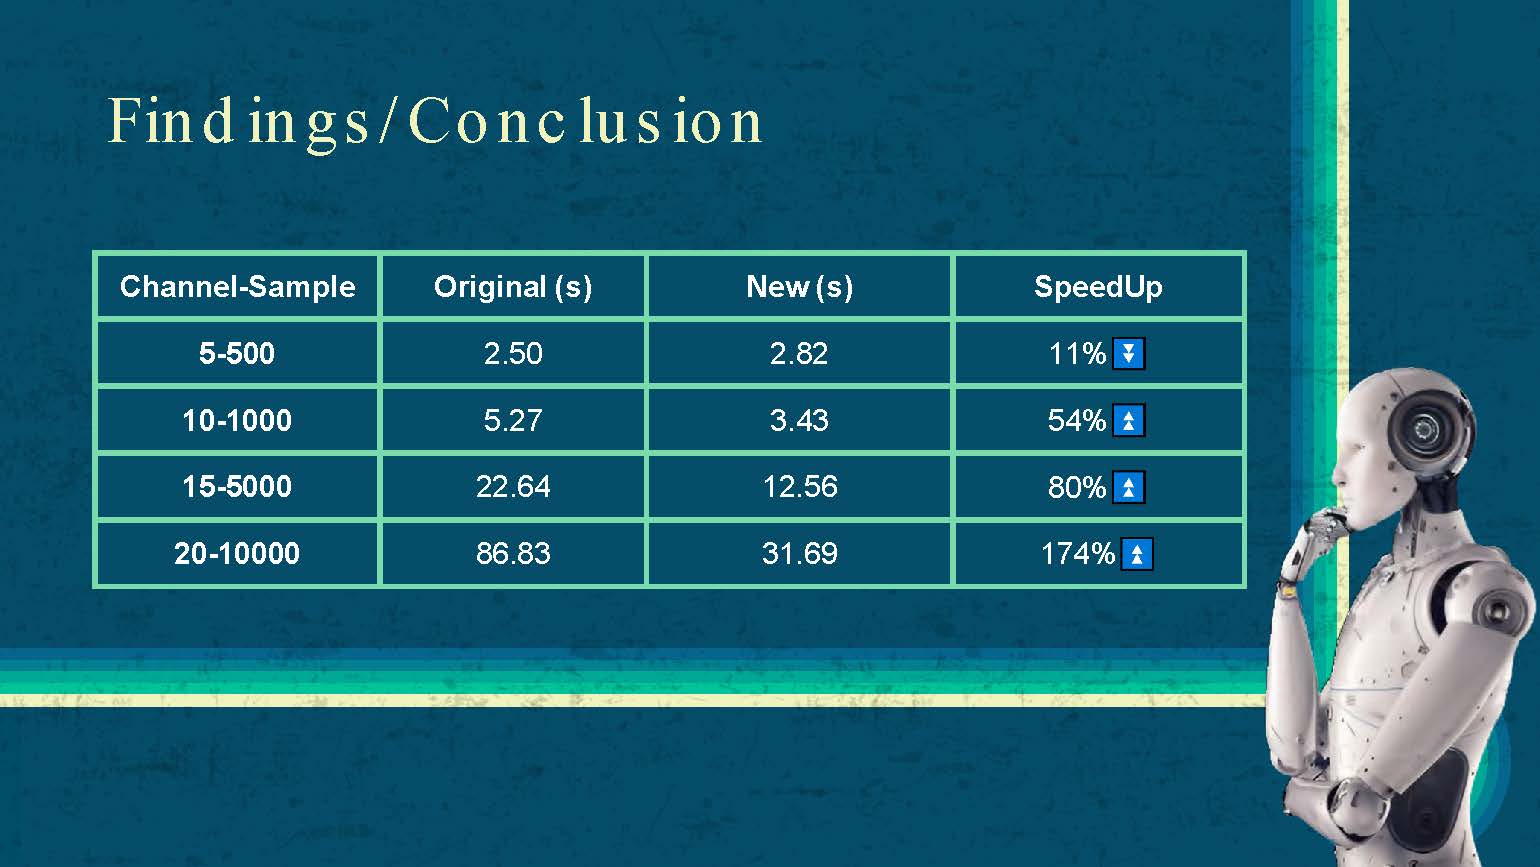
Findings / Conclusion
| Channel-Sample | Original (s) | New (s) | SpeedUp |
|---|---|---|---|
| 5-500 | 2.50 | 2.82 | -11% |
| 10-1000 | 5.27 | 3.43 | 54% |
| 15-5000 | 22.64 | 12.56 | 80% |
| 20-10000 | 86.83 | 31.69 | 174% |
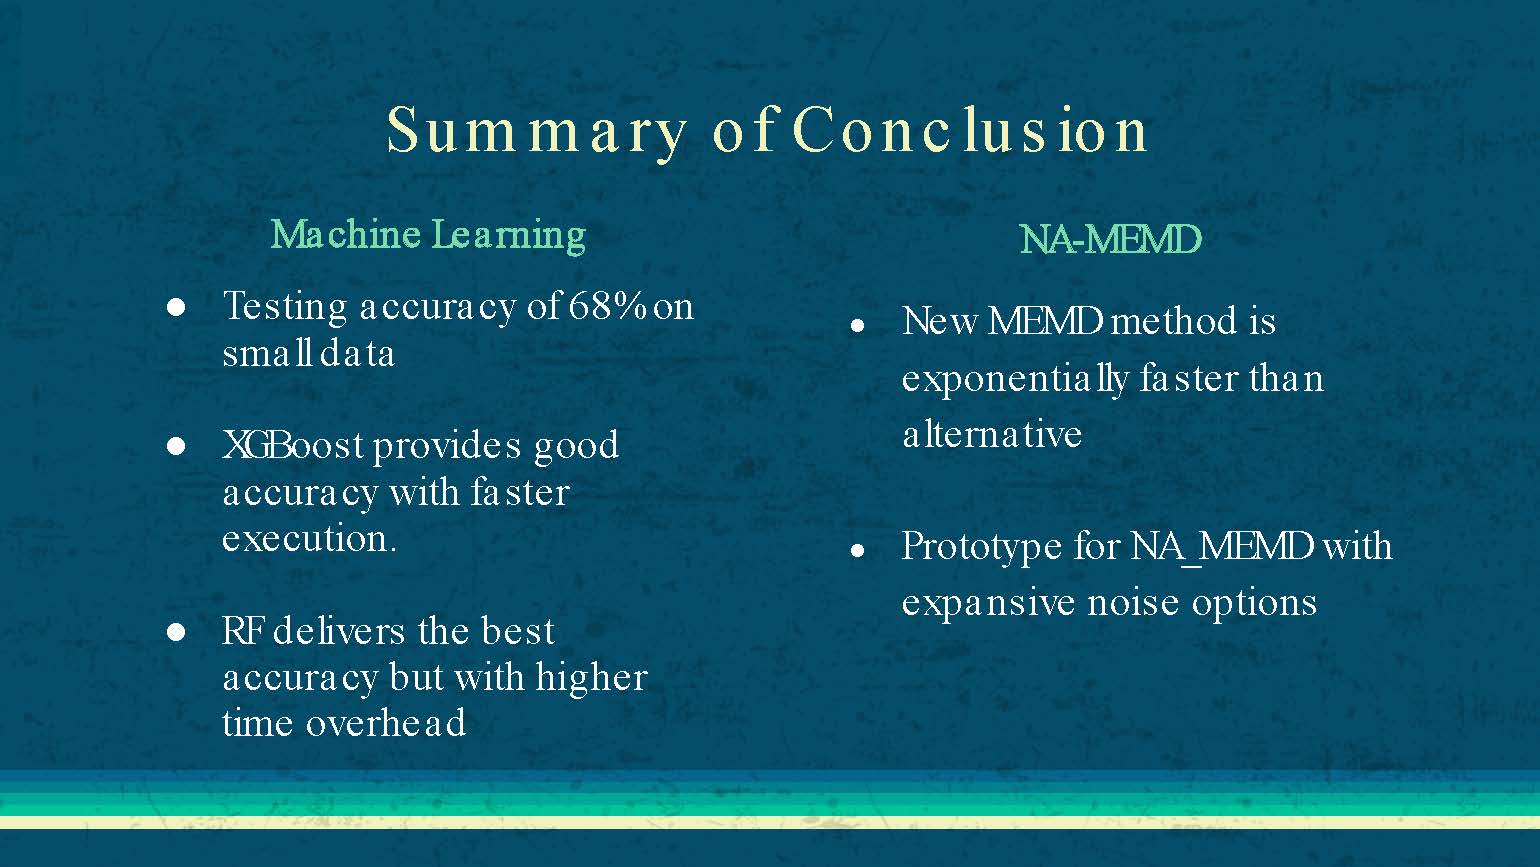
Summary of Conclusion
Machine Learning
Testing accuracy of 68% on small data
XGBoost provides good accuracy with faster execution.
RF delivers the best accuracy but with higher time overhead
NA-MEMD
New MEMD method is exponentially faster than alternative
Prototype for NA_MEMD with expansive noise options
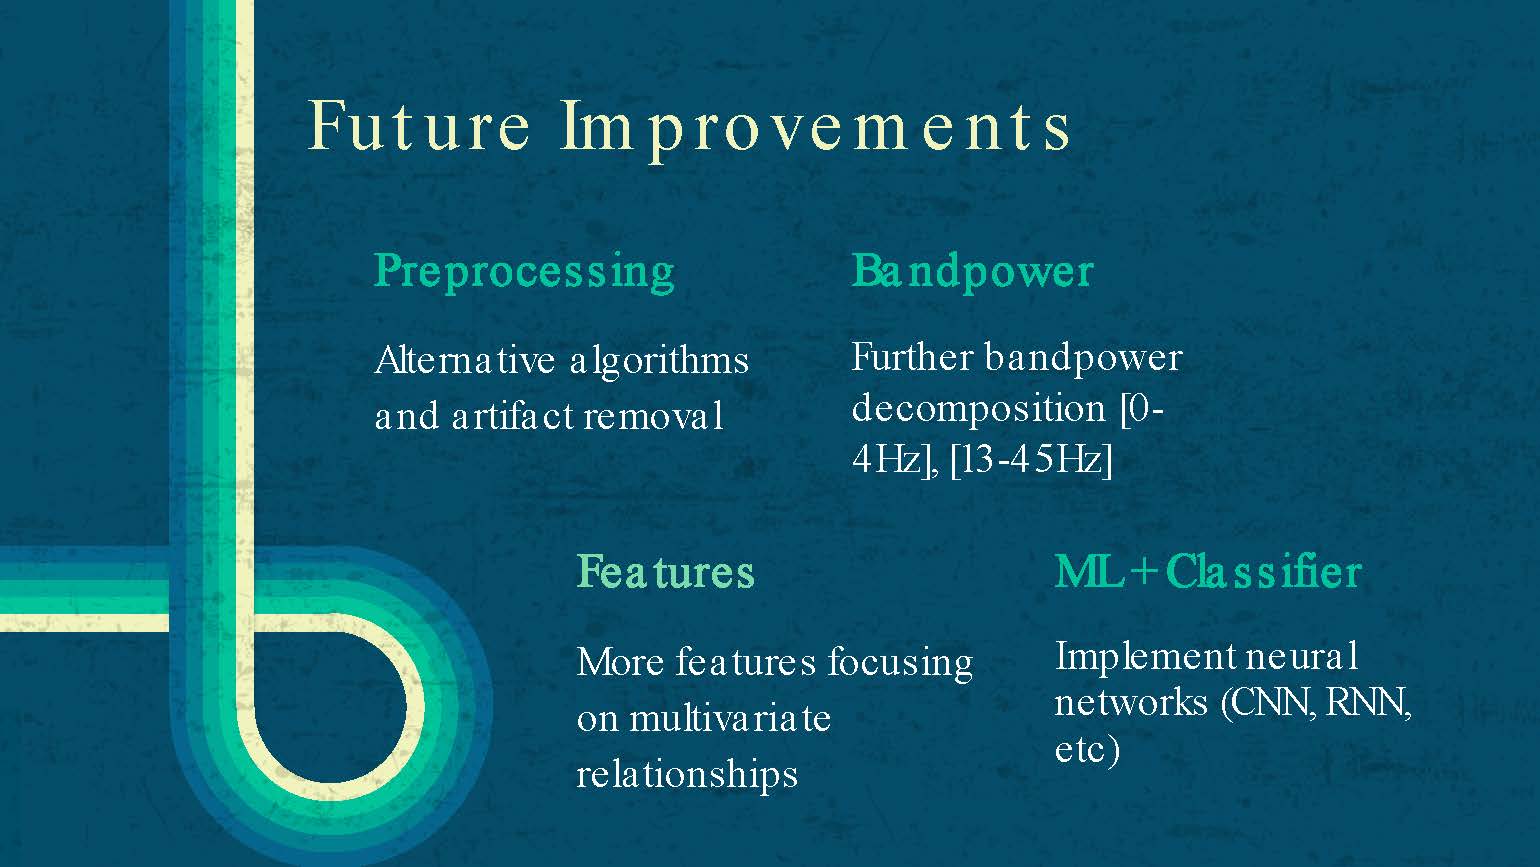
Future Improvements
Preprocessing
Alternative algorithms and artifact removal
Bandpower
Further bandpower decomposition [0-4Hz], [13-45Hz]
Features
More features focusing on multivariate relationships
ML + Classifier
Implement neural networks (CNN, RNN, etc)

Thank you!
Questions?
Credit and References
- Li Z, Zhang L, Zhang F, Gu R, Peng W, Hu L. Demystifying signal processing techniques to extract resting-state EEG features for psychologists. Brain Science Advances. 2020;6(3):189-209. doi:10.26599/BSA.2020.9050019
- AlSharabi, K., Salamah, Y. B., Aljallal, M., Abdurraqeeb, A. M., & Alturki, F. A. (2023). EEG-based clinical decision support system for Alzheimer's disorders diagnosis using EMD and deep learning techniques. Frontiers in Human Neuroscience, 17. https://doi.org/10.3389/fnhum.2023.1190203
- Miltiadous, A., Tzimourta, K. D., Afrantou, T., Ioannidis, P., Grigoriadis, N., Tsalikakis, D. G., Angelidis, P., Tsipouras, M. G., Glavas, E., Giannakeas, N., & Tzallas, A. T. (2023). A Dataset of Scalp EEG Recordings of Alzheimer's Disease, Frontotemporal Dementia and Healthy Subjects from Routine EEG. Data, 8(6), 95. https://doi.org/10.3390/data8060095
- Zhang Y, Wang G, Li Z, et al. Matlab Open Source Code: Noise-Assisted Multivariate Empirical Mode Decomposition Based Causal Decomposition for Causality Inference of Bivariate Time Series. Front Neuroinform. 2022;16:851645. Published 2022 Jun 16. doi:10.3389/fninf.2022.851645
- Miltiadous A, Tzimourta KD, Giannakeas N, Tsipouras MG, Afrantou T, Ioannidis P, Tzallas AT. Alzheimer's Disease and Frontotemporal Dementia: A Robust Classification Method of EEG Signals and a Comparison of Validation Methods. Diagnostics (Basel). 2021 Aug 9;11(8):1437. doi: 10.3390/diagnostics11081437. PMID: 34441371; PMCID: PMC8391578.
- Zhu E, Health and Behavior: Next-Gen Health Monitoring Empowered by Python Programming and Deep Learning Applications.(2024). GitHub Repository https://github.com/PiethonProgram/NA-MEMD

End of Presentation
Click the right arrow to return to the beginning of the slide show.
For a downloadable version of this presentation, email: I-SENSE@FAU.