Early Detection of Alzheimer's Disease and Related Disorders Using Deep Learning-Based 3D Pose Estimation, Gait Analysis, and Machine Learning

Presented by Asia Besant
REU Scholar Home Institution: Wayne State University (Detroit, MI)
Mentor: Dr. Behnaz Ghoraani
Co-Mentor: Mahmoud Seifallahi, Ph.D. Candidate
What is Alzheimer's Disease(AD) and Mild Cognitive Impairment(MCI)?
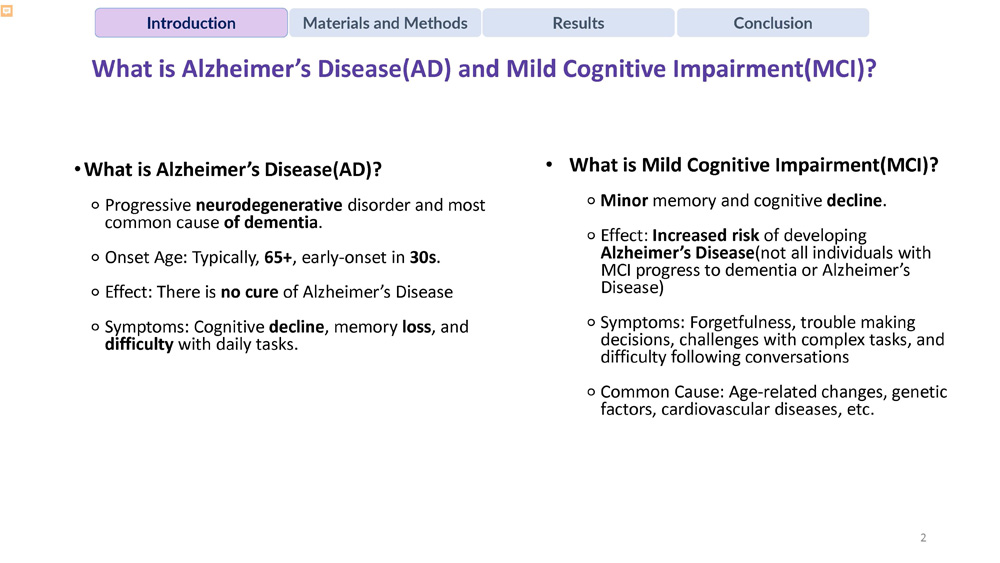
What is Alzheimer's Disease(AD)?
Progressive neurodegenerative disorder and most common cause of dementia.
Onset Age: Typically, 65+, early-onset in 30s.
Effect: There is no cure of Alzheimer's Disease
Symptoms: Cognitive decline, memory loss, and difficulty with daily tasks.
What is Mild Cognitive Impairment(MCI)?
Minor memory and cognitive decline.
Effect: Increased risk of developing Alzheimer's Disease(not all individuals with MCI progress to dementia or Alzheimer's Disease)
Symptoms: Forgetfulness, trouble making decisions, challenges with complex tasks, and difficulty following conversations
Common Cause: Age-related changes, genetic factors, cardiovascular diseases, etc.
Current Clinical Diagnoses of MCI, their Challenges, and Solution to Challenges
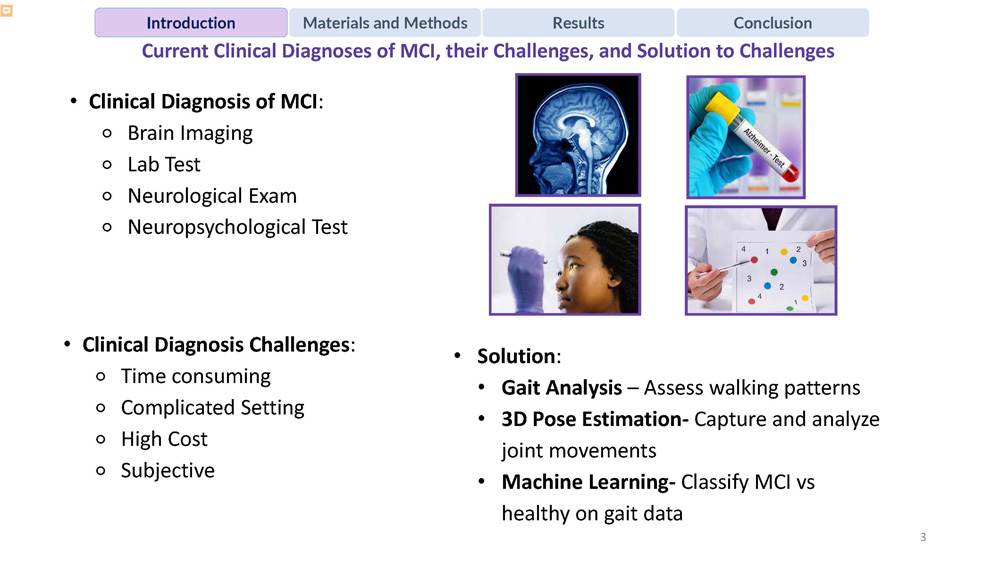
Clinical Diagnosis of MCI:
Brain Imaging
Lab Test
Neurological Exam
Neuropsychological Test
Clinical Diagnosis Challenges:
Time consuming
Complicated Setting
High Cost
Subjective
Solution:
Gait Analysis – Assess walking patterns
3D Pose Estimation- Capture and analyze joint movements
Machine Learning- Classify MCI vs healthy on gait data
Main Steps for Gait Analysis and Processing to Detect MCI
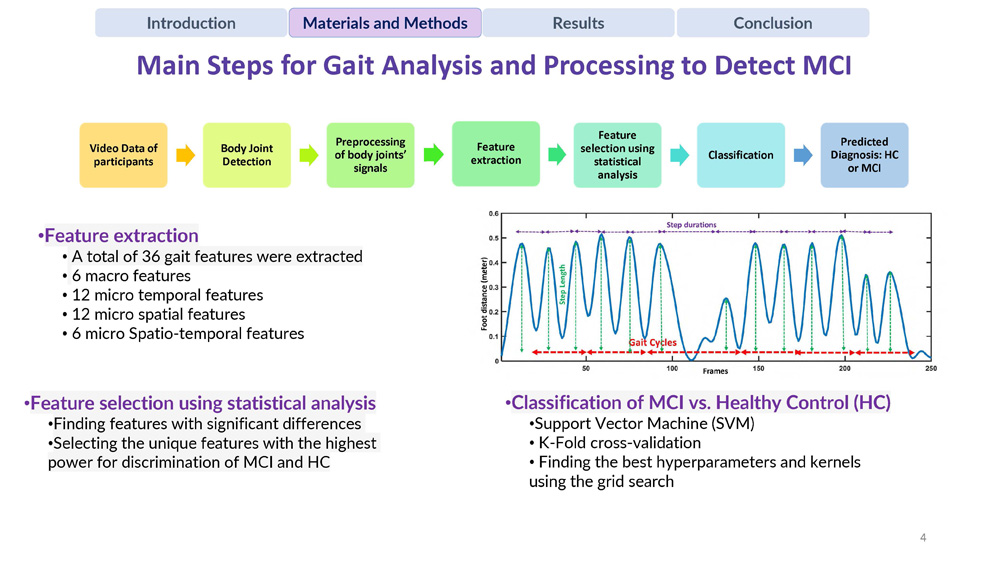
The workflow shows a sequential process: Video Data of participants → Body Joint Detection → Preprocessing of body joints' signals → Feature extraction → Feature selection using statistical analysis → Classification → Predicted Diagnosis: HC or MCI
Classification of MCI vs. Healthy Control (HC)
Support Vector Machine (SVM)
K-Fold cross-validation
Finding the best hyperparameters and kernels using the grid search
Feature extraction
A total of 36 gait features were extracted
6 macro features
12 micro temporal features
12 micro spatial features
6 micro Spatio-temporal features
Feature selection using statistical analysis
Finding features with significant differences
Selecting the unique features with the highest power for discrimination of MCI and HC
Main Steps for Gait Analysis and Processing to Detect MCI (continued)” with the section header highlighted in purple as “Materials and Methods”.
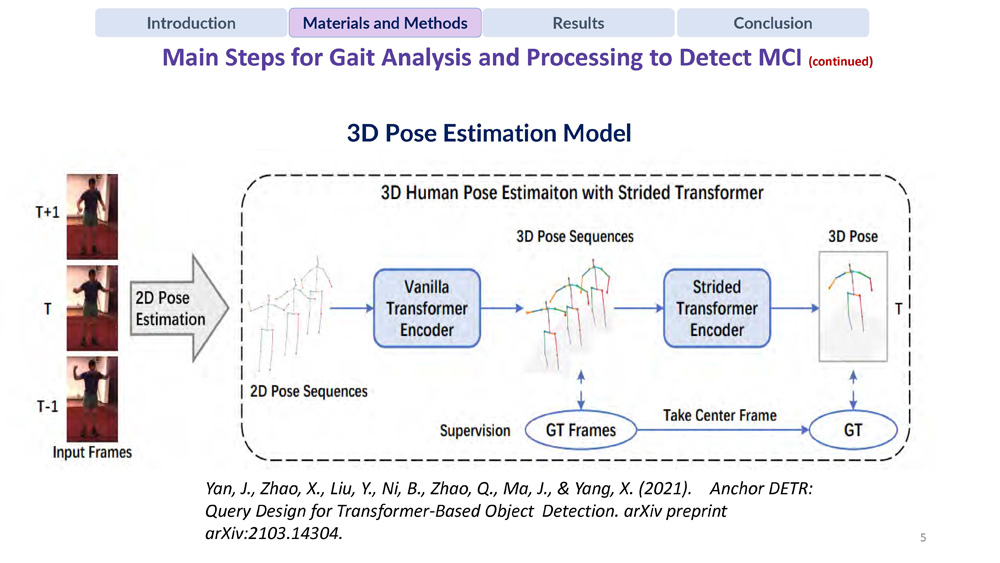
3D Pose Estimation Model”.
On the left side, three stacked images of a person standing are labeled as “Input Frames” at times T-1, T, and T+1. An arrow labeled “2D Pose Estimation” points to a stick-figure representation labeled “2D Pose Sequences.”
The flow then continues into a box labeled “Vanilla Transformer Encoder,” followed by stick-figure sequences labeled “3D Pose Sequences.”
Next, the sequence goes into another box labeled “Strided Transformer Encoder,” followed by a stick-figure labeled “3D Pose.”
Below, there are two ovals: one labeled “GT Frames” connected by an arrow with the word “Supervision” pointing toward the 3D pose sequences, and another labeled “GT” connected by an arrow pointing upward toward the final 3D pose.
The final 3D pose output has a label underneath reading “Take Center Frame.”
At the bottom of the slide is a citation:
Yan, J., Zhao, X., Liu, Y., Ni, B., Zhao, Q., Ma, J., & Yang, X. (2021). Anchor DETR: Query Design for Transformer-Based Object Detection. arXiv preprint arXiv:2103.14304.
In the top navigation bar, sections are shown as boxes: Introduction, Materials and Methods (highlighted), Results, Conclusion.
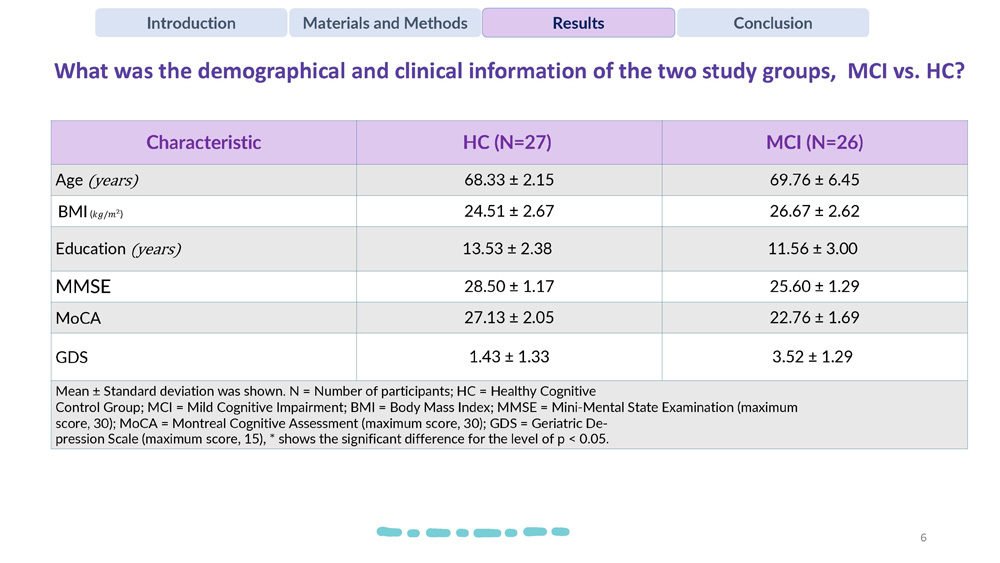
What was the demographical and clinical information of the two study groups, MCI vs. HC?
| Characteristic | HC (N=27) | MCI (N=26) |
|---|---|---|
| Age(years) | 68.33 ± 2.15 | 69.76 ± 6.45 |
| BMI (kg/m²) | 24.51 ± 2.67 | 26.67 ± 2.62 |
| Education (years) | 13.53 ± 2.38 | 11.56 ± 3.00 |
| MMSE | 28.50 ± 1.17 | 25.60 ± 1.29 |
| MoCA | 27.13 ± 2.05 | 22.76 ± 1.69 |
| GDS | 1.43 ± 1.33 | 3.52 ± 1.29 |
Mean ± Standard deviation was shown. N = Number of participants; HC = Healthy Cognitive Control Group; MCI = Mild Cognitive Impairment; BMI = Body Mass Index; MMSE = Mini-Mental State Examination (maximum score, 30); MoCA = Montreal Cognitive Assessment (maximum score, 30); GDS = Geriatric Depression Scale (maximum score, 15), * shows the significant difference for the level of p < 0.05.

Samples of body joint detection using 3D Pose Estimation Model on our dataset
The slide shows sample images demonstrating the 3D pose estimation model's ability to detect and track body joints during gait analysis. The images display skeletal overlays on human figures, showing the detected joint positions and connections that form the basis for gait feature extraction.
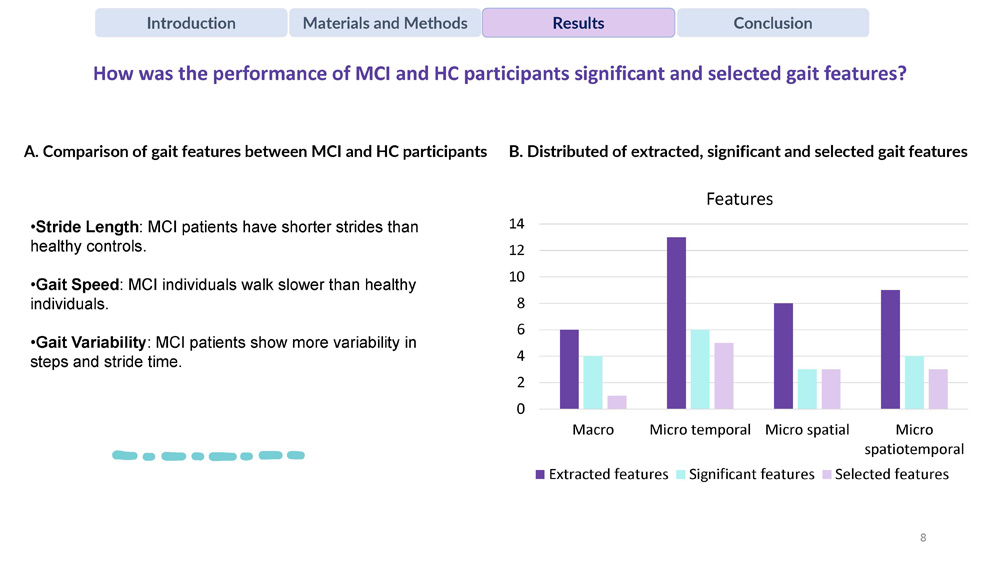
How was the performance of MCI and HC participants significant and selected gait features?
A. Comparison of gait features between MCI and HC participants
Stride Length: MCI patients have shorter strides than healthy controls.
Gait Speed: MCI individuals walk slower than healthy individuals.
Gait Variability: MCI patients show more variability in steps and stride time.
B. Distributed of extracted, significant and selected gait features
The bar chart shows the distribution across four feature categories: Macro, Micro temporal, Micro spatial, and Micro spatiotemporal. For each category, three bars represent: Extracted features (highest bars), Significant features (medium bars), and Selected features (lowest bars). The chart demonstrates the feature selection process from initial extraction to final selection for classification.
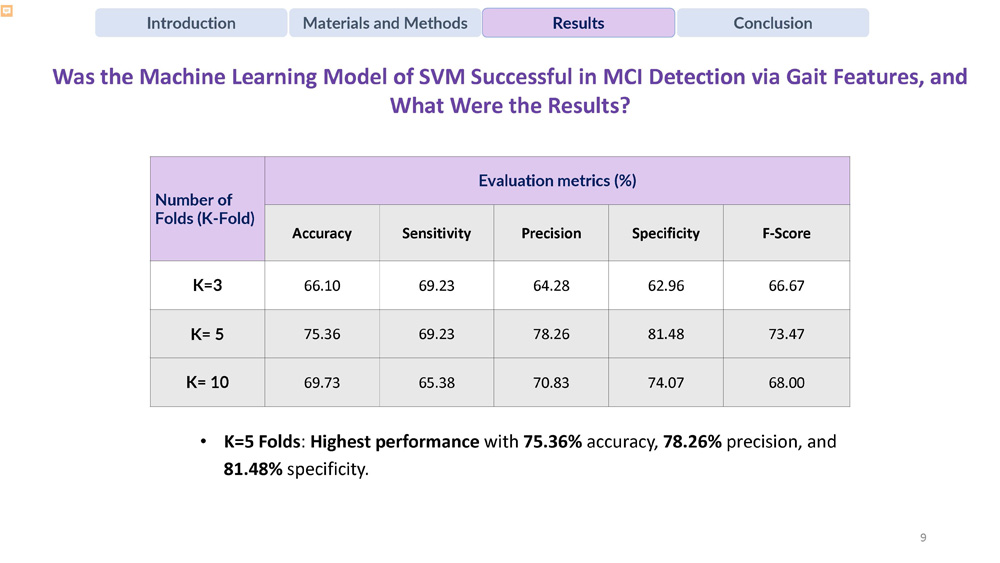
Was the Machine Learning Model of SVM Successful in MCI Detection via Gait Features, and What Were the Results?
K=5 Folds: Highest performance with 75.36% accuracy, 78.26% precision, and 81.48% specificity.
| Number of Folds (K-Fold) | Evaluation metrics (%) | ||||
|---|---|---|---|---|---|
| Accuracy | Sensitivity | Precision | Specificity | F-Score | |
| K=3 | 66.10 | 69.23 | 64.28 | 62.96 | 66.67 |
| K=5 | 75.36 | 69.23 | 78.26 | 81.48 | 73.47 |
| K=10 | 69.73 | 65.38 | 70.83 | 74.07 | 68.00 |
Conclusion
In summary, comprehensive analysis of curved-path gait using standard cameras, pose estimation via deep neural networks, signal processing, descriptive statistical analysis, and ML can be used as a complementary tool for MCI detection.
Suitable for widespread use in clinical and non-clinical settings to assist in frequent cognitive decline assessments
Promoting healthy aging by increasing the chance of in-time MCI diagnosis at early stage and related disorders before conversion to AD

Thank You!
Link to LinkedIn

End of Presentation
Click the right arrow to return to the beginning of the slide show.
For a downloadable version of this presentation, email: I-SENSE@FAU.