GPT-like Attention Mechanisms for Power Transformer Condition Monitoring and Prognostics
By Raul Mendy, Aira Torres, Joseph Accurso
Mentor: Yufei Tang, Ph.D.
Raul Mendy, Aira Torres, Joseph Accurso
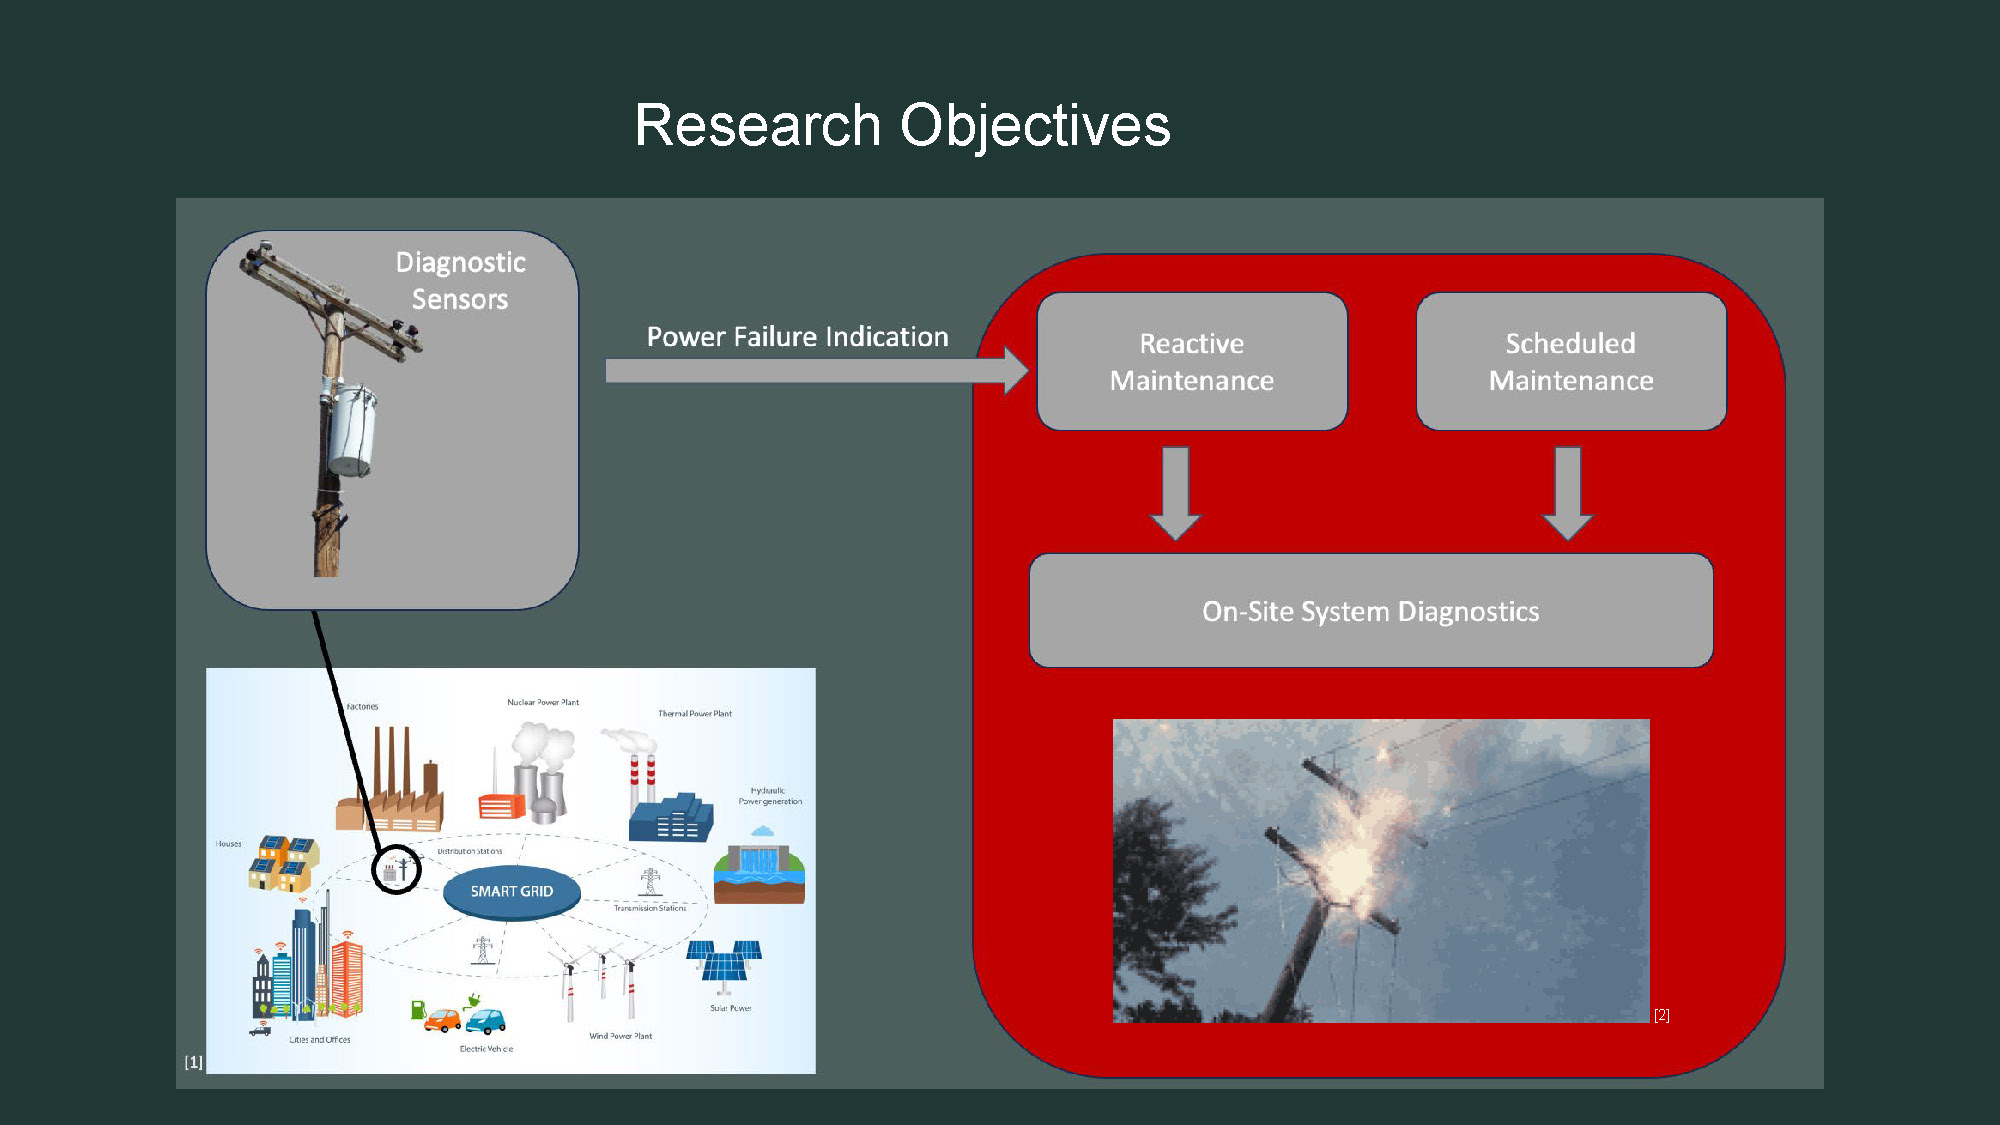
- The title "Research Objectives" is centered at the top.
- The image is divided into three main sections.
- The left section shows a photograph of diagnostic sensors on a utility pole. This is labeled "Diagnostic Sensors."
- Below this, there is an illustration of a smart grid with various types of power plants and a city.
- An arrow points from the "Diagnostic Sensors" section to the middle section, labeled "Power Failure Indication."
- The middle section is a red flowchart. Two boxes at the top are labeled "Reactive Maintenance" and "Scheduled Maintenance."
- Arrows point down from these two boxes to a central gray box labeled "On-Site System Diagnostics."
- The right-hand side of the image shows a photograph of a power line with a spark or flash occurring.

Remaining Useful Life Model section showing the approach for predicting transformer lifespan
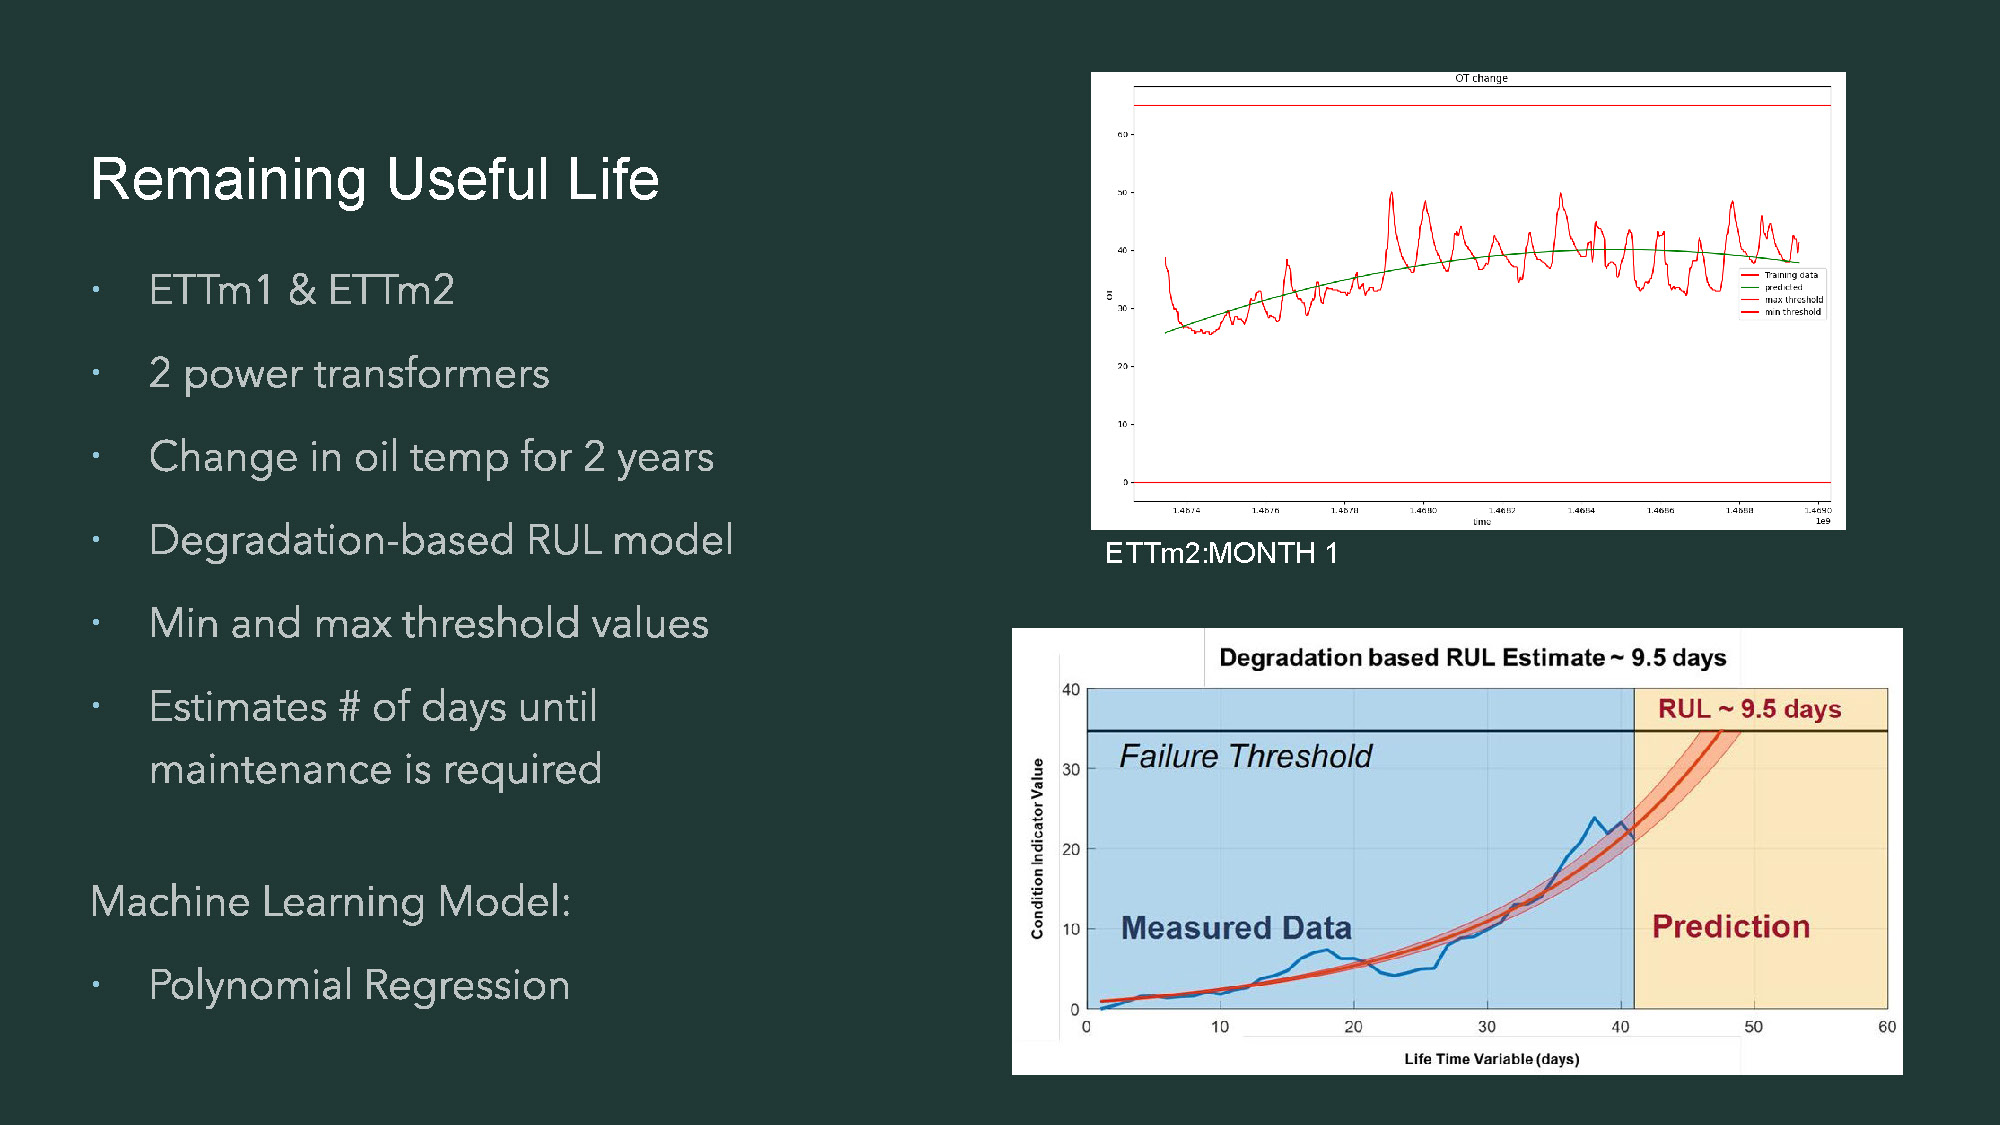
- The title "Remaining Useful Life" is in the top left corner.
- Below the title on the left side, there is a list of bullet points. The list includes "ETTm1 & ETTm2," "2 power transformers," "Change in oil temp for 2 years," "Degradation-based RUL model," "Min and max threshold values," and "Estimates # of days until maintenance is required."
- Below this list, the text "Machine Learning Model:" and "Polynomial Regression" is present.
- The right side of the image contains two graphs.
- The top graph is titled "CCT change" and has a horizontal axis labeled "time." A red line and a green line are plotted. The legend in the top right corner indicates "raw data," "smoothed," "min threshold," and "max threshold." The graph is labeled "ETTm2:MONTH 1."
- The bottom graph is titled "Degradation based RUL Estimate ~ 9.5 days."
- This bottom graph shows a blue shaded area labeled "Measured Data" and a lighter, orange/red shaded area labeled "Prediction."
- A solid blue line is labeled "Failure Threshold," and a solid orange line is labeled "RUL ~ 9.5 days."
- The x-axis is labeled "Life Time Variable (days)" and the y-axis is labeled "Condition Indicator Value."
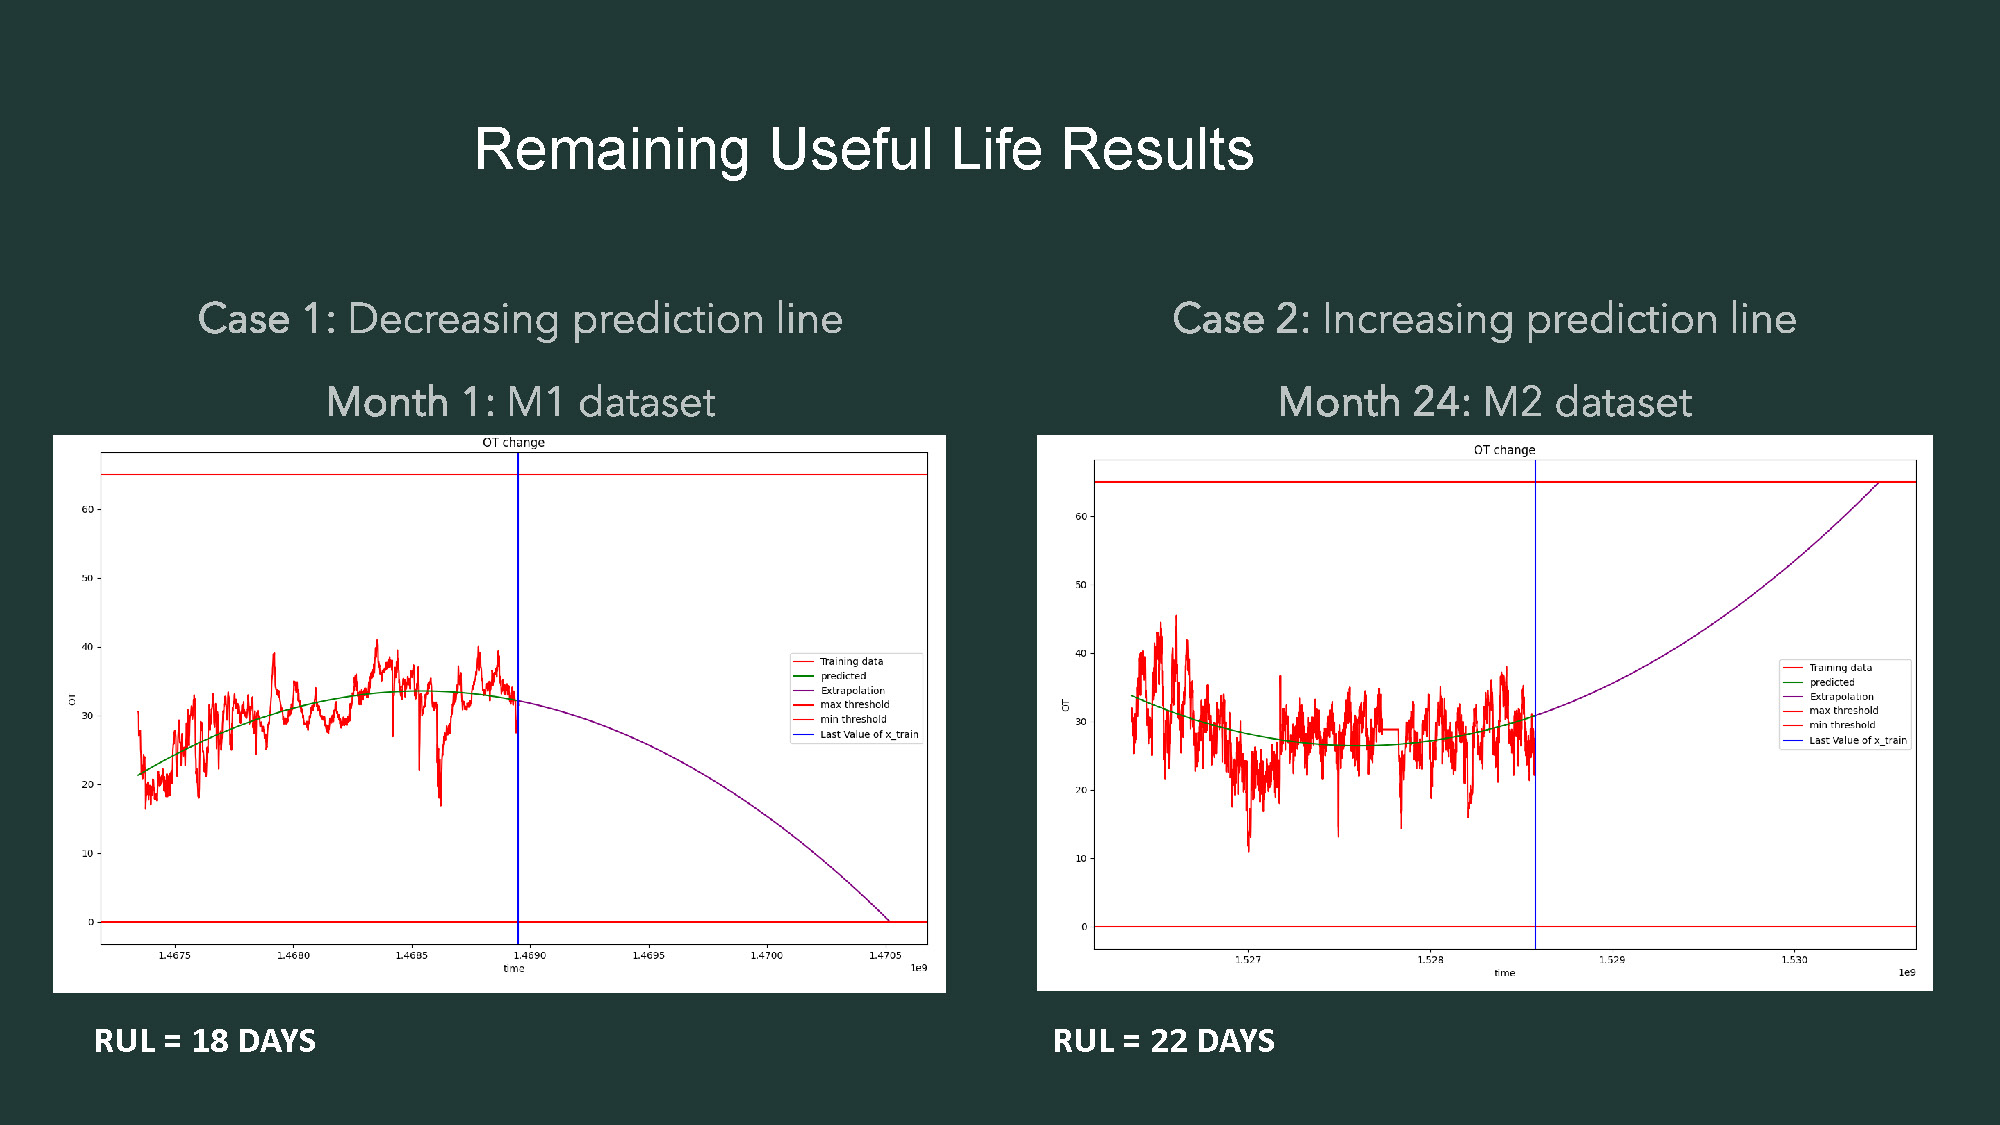
- The title "Remaining Useful Life Results" is centered at the top.
- The image displays two graphs side-by-side, each with its own label.
- The graph on the left is labeled "Case 1: Decreasing prediction line" and "Month 1: M1 dataset."
- This graph, titled "COT change," shows a red line, a green line, and a purple line. A vertical blue line is also present.
- The legend identifies the lines as "Training data," "Smoothed," "Stochastic," "Predicted," and "Max threshold," with the last two lines overlapping.
- The text "RUL = 18 DAYS" is below the graph.
- The graph on the right is labeled "Case 2: Increasing prediction line" and "Month 24: M2 dataset."
- This graph, also titled "COT change," displays similar lines and a vertical blue line.
- The legend for this graph includes "Training data," "Predicted," "Smoothed," and "Max threshold."
- The text "RUL = 22 DAYS" is below this graph.

Multi-Class Classification Model section introducing fault classification approach
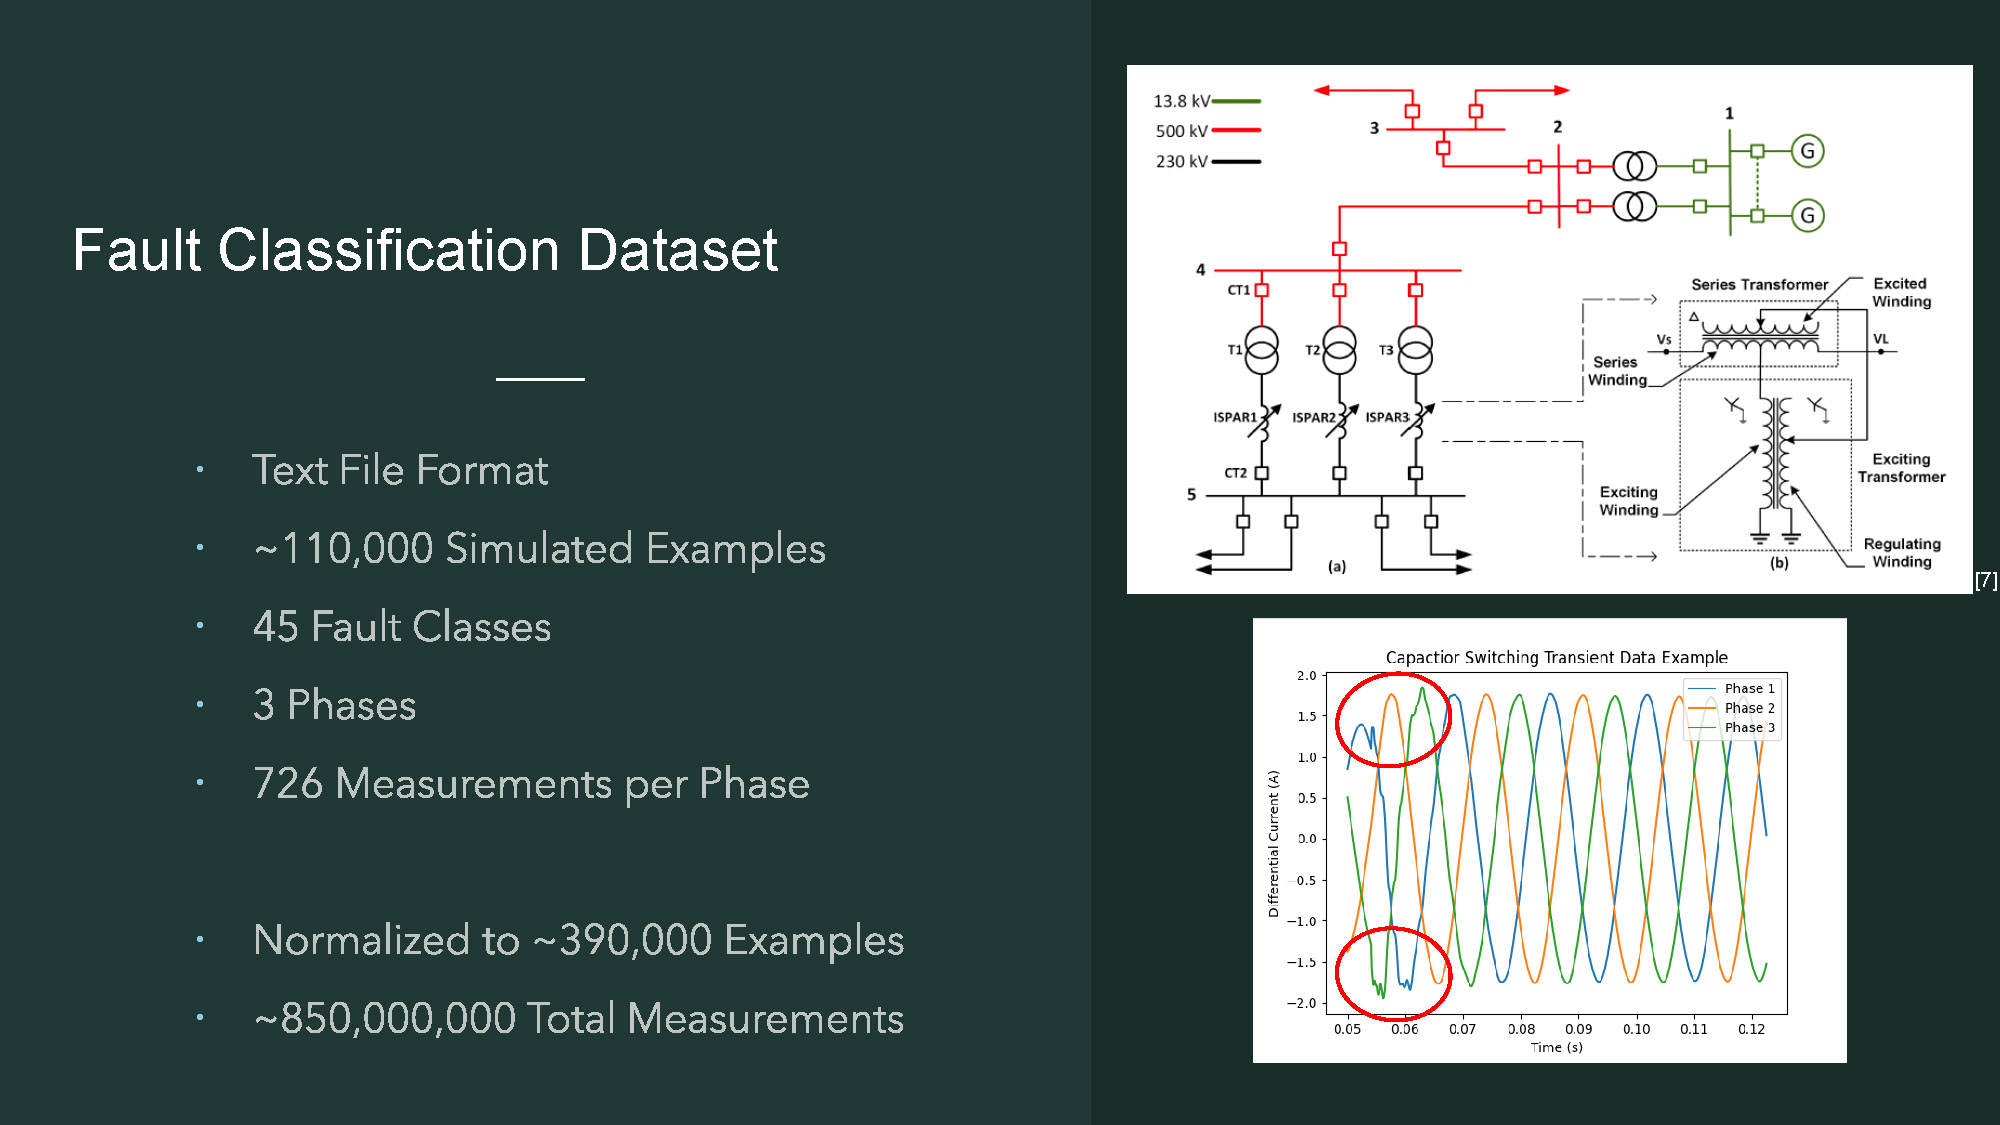
- The title "Fault Classification Dataset" is in the top left corner.
- A list of bullet points is present on the left side, including "Text File Format," "~110,000 Simulated Examples," "45 Fault Classes," "3 Phases," "726 Measurements per Phase," "Normalized to ~390,000 Examples," and "~850,000,000 Total Measurements."
- The right side of the image contains two figures.
- The top figure is an electrical schematic with components labeled with letters and numbers. It includes diagrams of a series transformer and an exciting transformer.
- The bottom figure is a line graph titled "Capacitor Switching Transient Data Example."
- The bottom graph shows three colored lines, labeled "Phase 1," "Phase 2," and "Phase 3," with red circles around two dips in the waveforms.
- The x-axis is labeled "Time (s)" and the y-axis is labeled "Differential Current (A)."
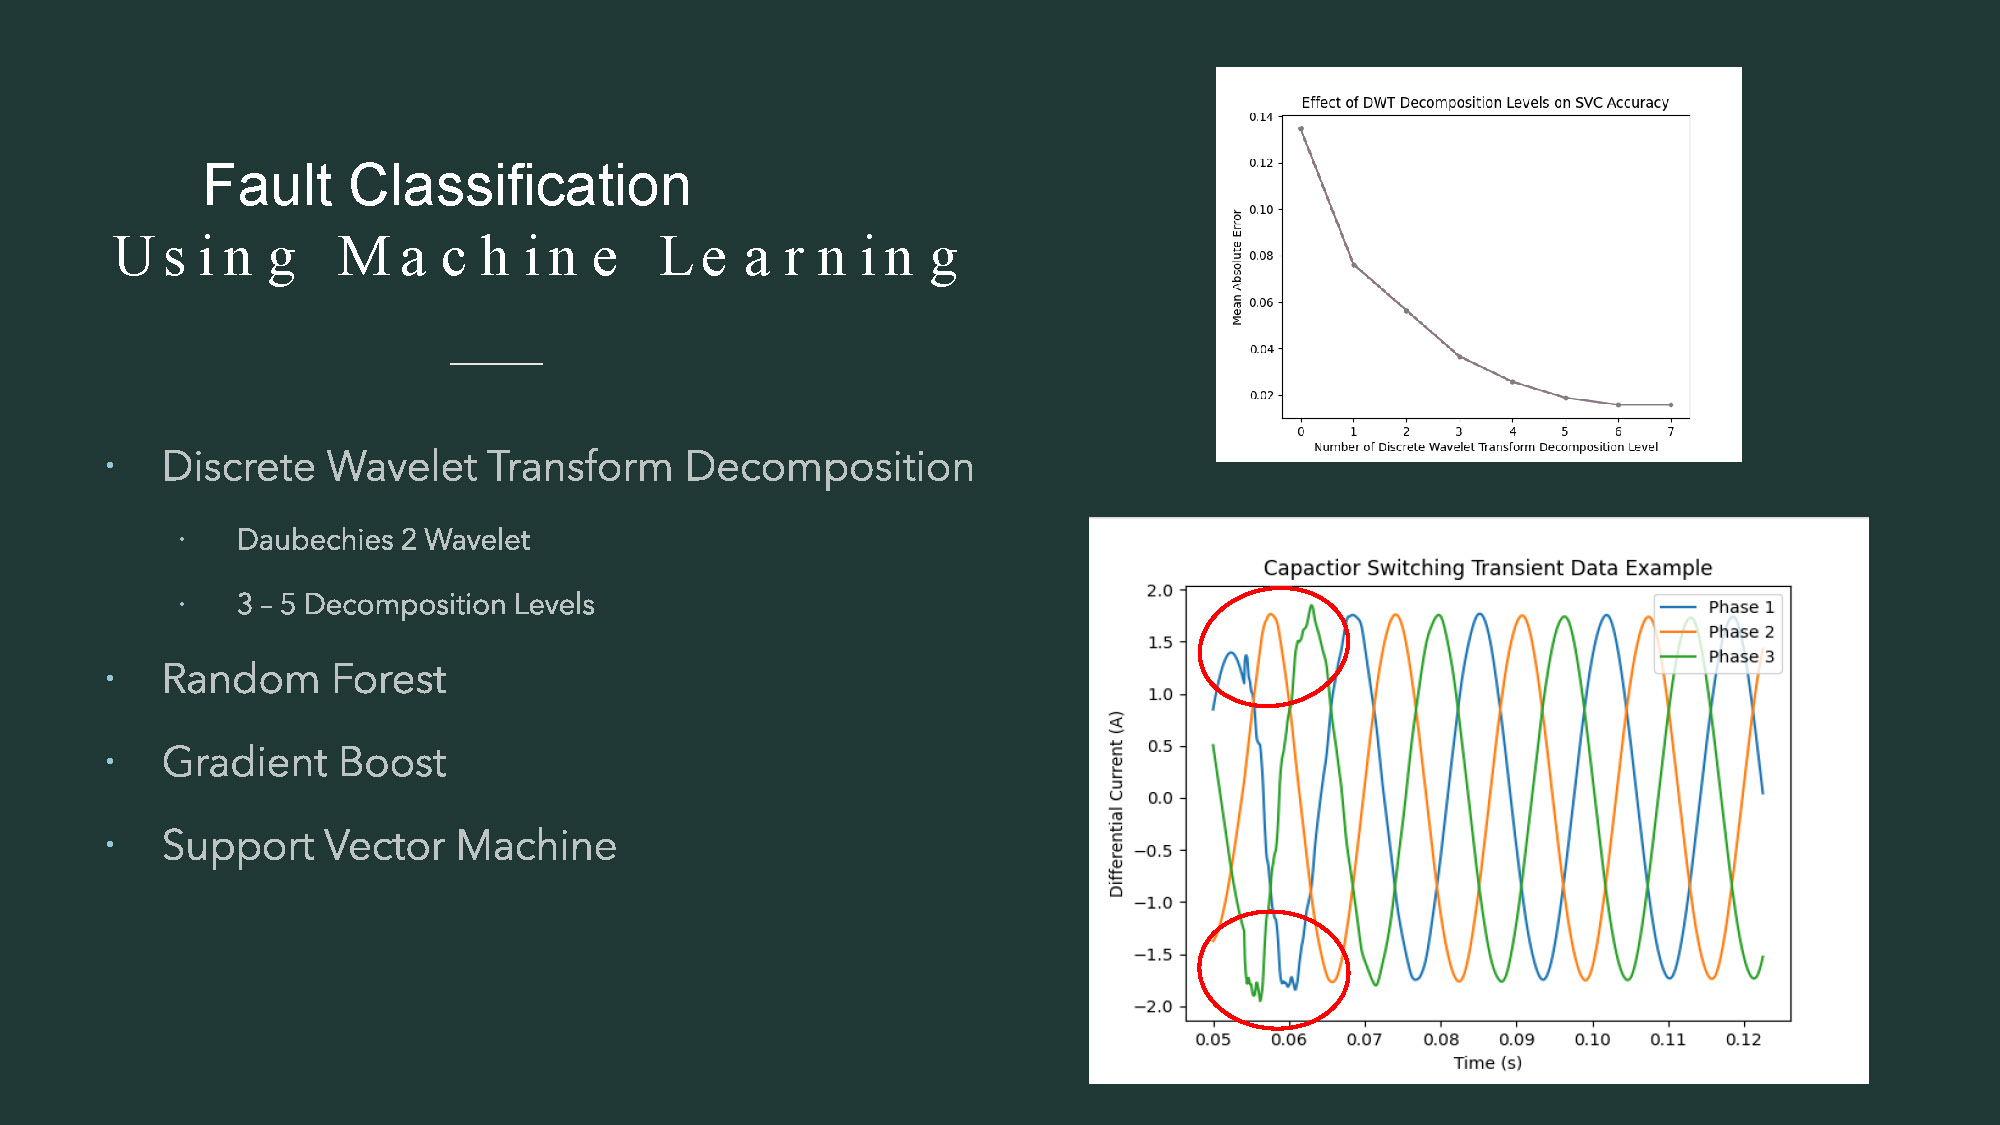
- The title "Fault Classification Using Machine Learning" is in the top left corner.
- A list of bullet points is on the left, including "Discrete Wavelet Transform Decomposition," "Daubechies 2 Wavelet," "3-5 Decomposition Levels," "Random Forest," "Gradient Boost," and "Support Vector Machine."
- The right side of the image contains two graphs.
- The top graph is a scatter plot with connected points, titled "Effect of DWT Decomposition Levels on SVC Accuracy."
- The x-axis of the top graph is labeled "Number of Discrete Wavelet Transform Decomposition Level" and the y-axis is labeled "Mean Absolute Error."
- The bottom graph is a line graph titled "Capacitor Switching Transient Data Example."
- This bottom graph shows three colored lines representing "Phase 1," "Phase 2," and "Phase 3," with red circles highlighting dips in the waveforms.
- The x-axis is labeled "Time (s)" and the y-axis is labeled "Differential Current (A)."
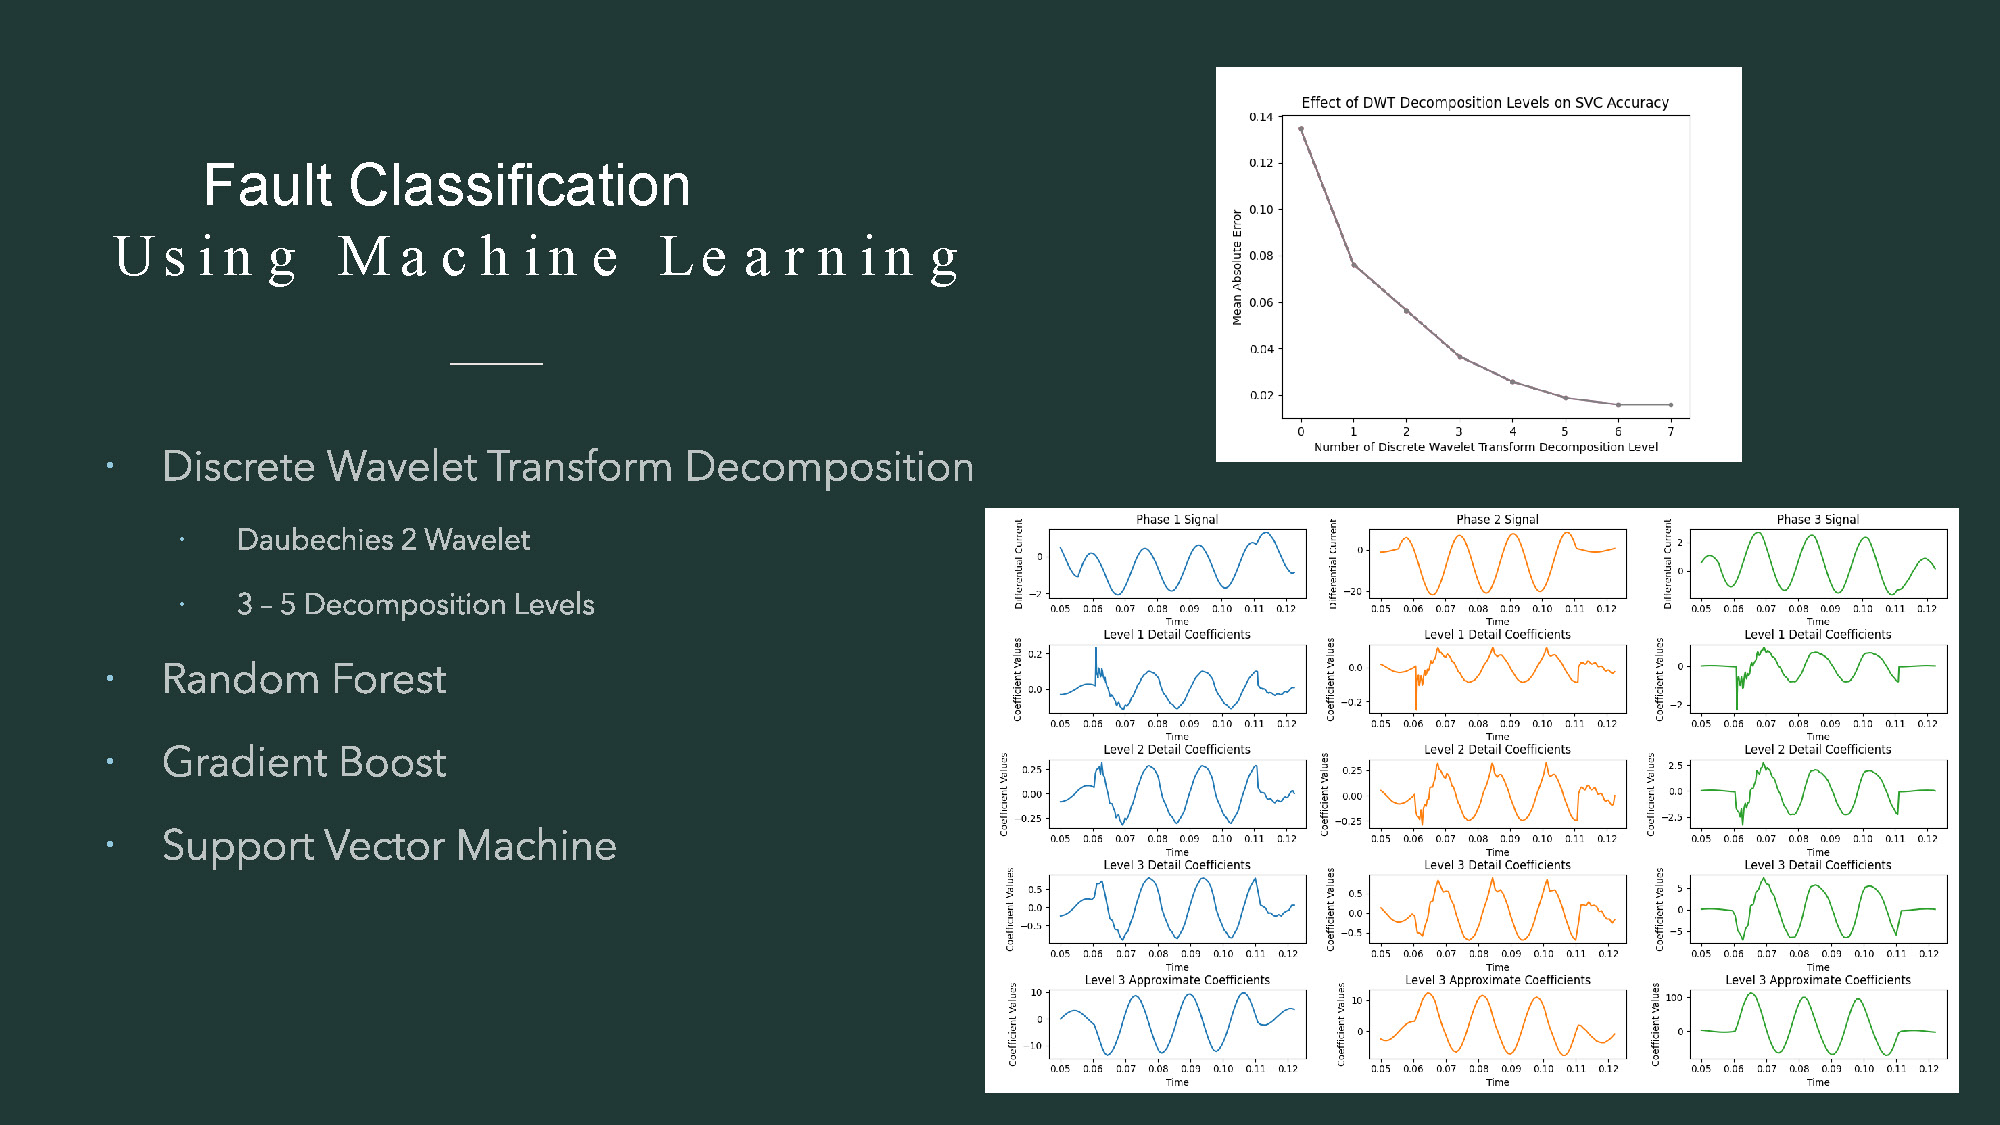
- The title "Fault Classification Using Machine Learning" is in the top left corner.
- A list of bullet points is on the left, including "Discrete Wavelet Transform Decomposition," "Daubechies 2 Wavelet," "3-5 Decomposition Levels," "Random Forest," "Gradient Boost," and "Support Vector Machine."
- The right side of the image contains multiple small graphs arranged in a grid.
- The top row of graphs is titled "Phase 1 Signal," "Phase 2 Signal," and "Phase 3 Signal."
- The graphs below show "Level 1 Detail Coefficients," "Level 2 Detail Coefficients," "Level 3 Detail Coefficients," and "Level 3 Approximate Coefficients" for each phase.
- The x-axes are labeled "Time," and the y-axes are labeled "Coefficient Values."
- The top right graph from the previous slide, "Effect of DWT Decomposition Levels on SVC Accuracy," is also in the top right corner of this slide.
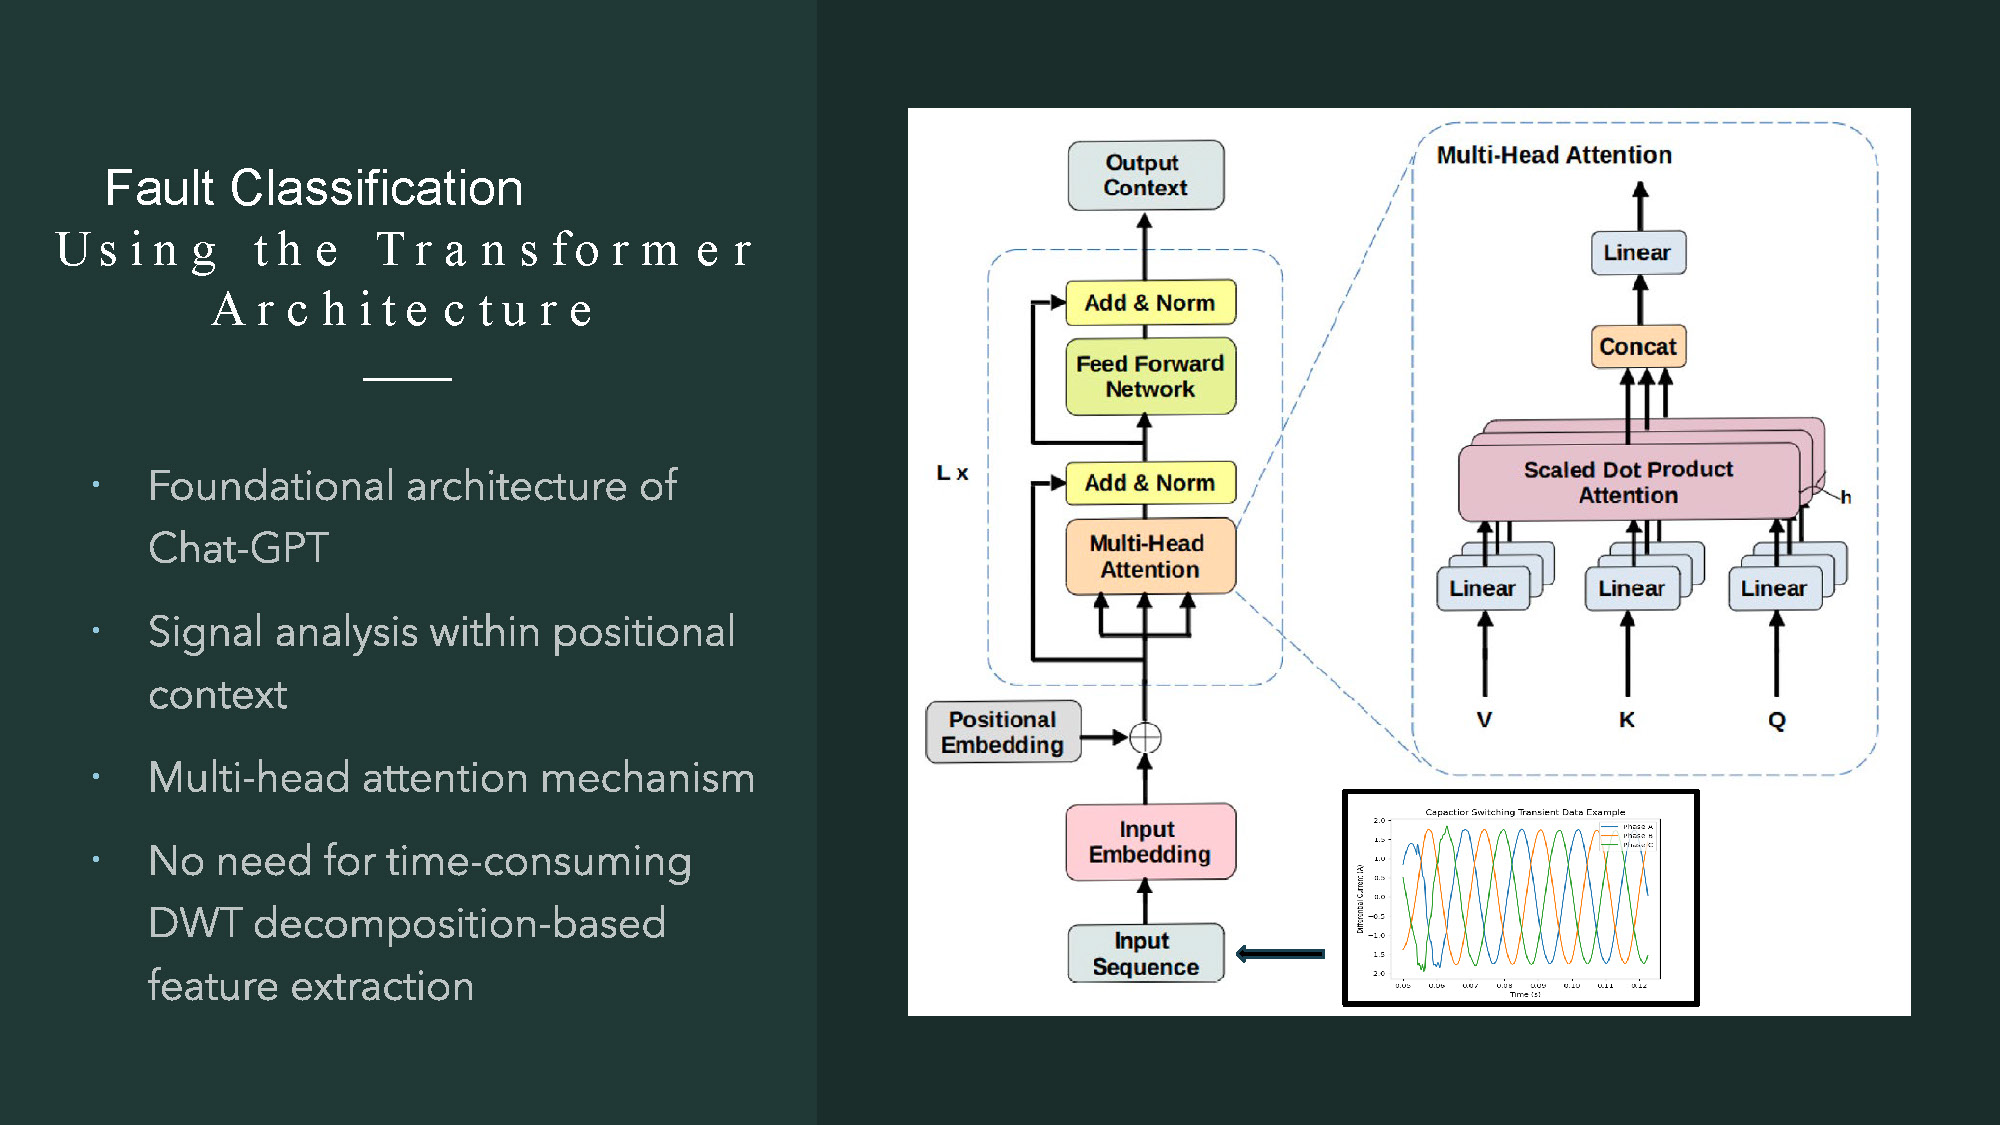
- The title "Fault Classification Using the Transformer Architecture" is in the top left corner.
- A list of bullet points is on the left side, including "Foundational architecture of Chat-GPT," "Signal analysis within positional context," "Multi-head attention mechanism," and "No need for time-consuming DWT decomposition-based feature extraction."
- The right side shows a diagram of the Transformer model architecture.
- The diagram includes labeled blocks such as "Input Sequence," "Input Embedding," "Positional Embedding," "Multi-Head Attention," "Add & Norm," and "Feed Forward Network."
- A detailed view of the "Multi-Head Attention" block is shown, with components labeled "Linear," "Scaled Dot Product Attention," and "Concat."
- A small graph titled "Capacitor Switching Transient Data Example" is at the bottom right.
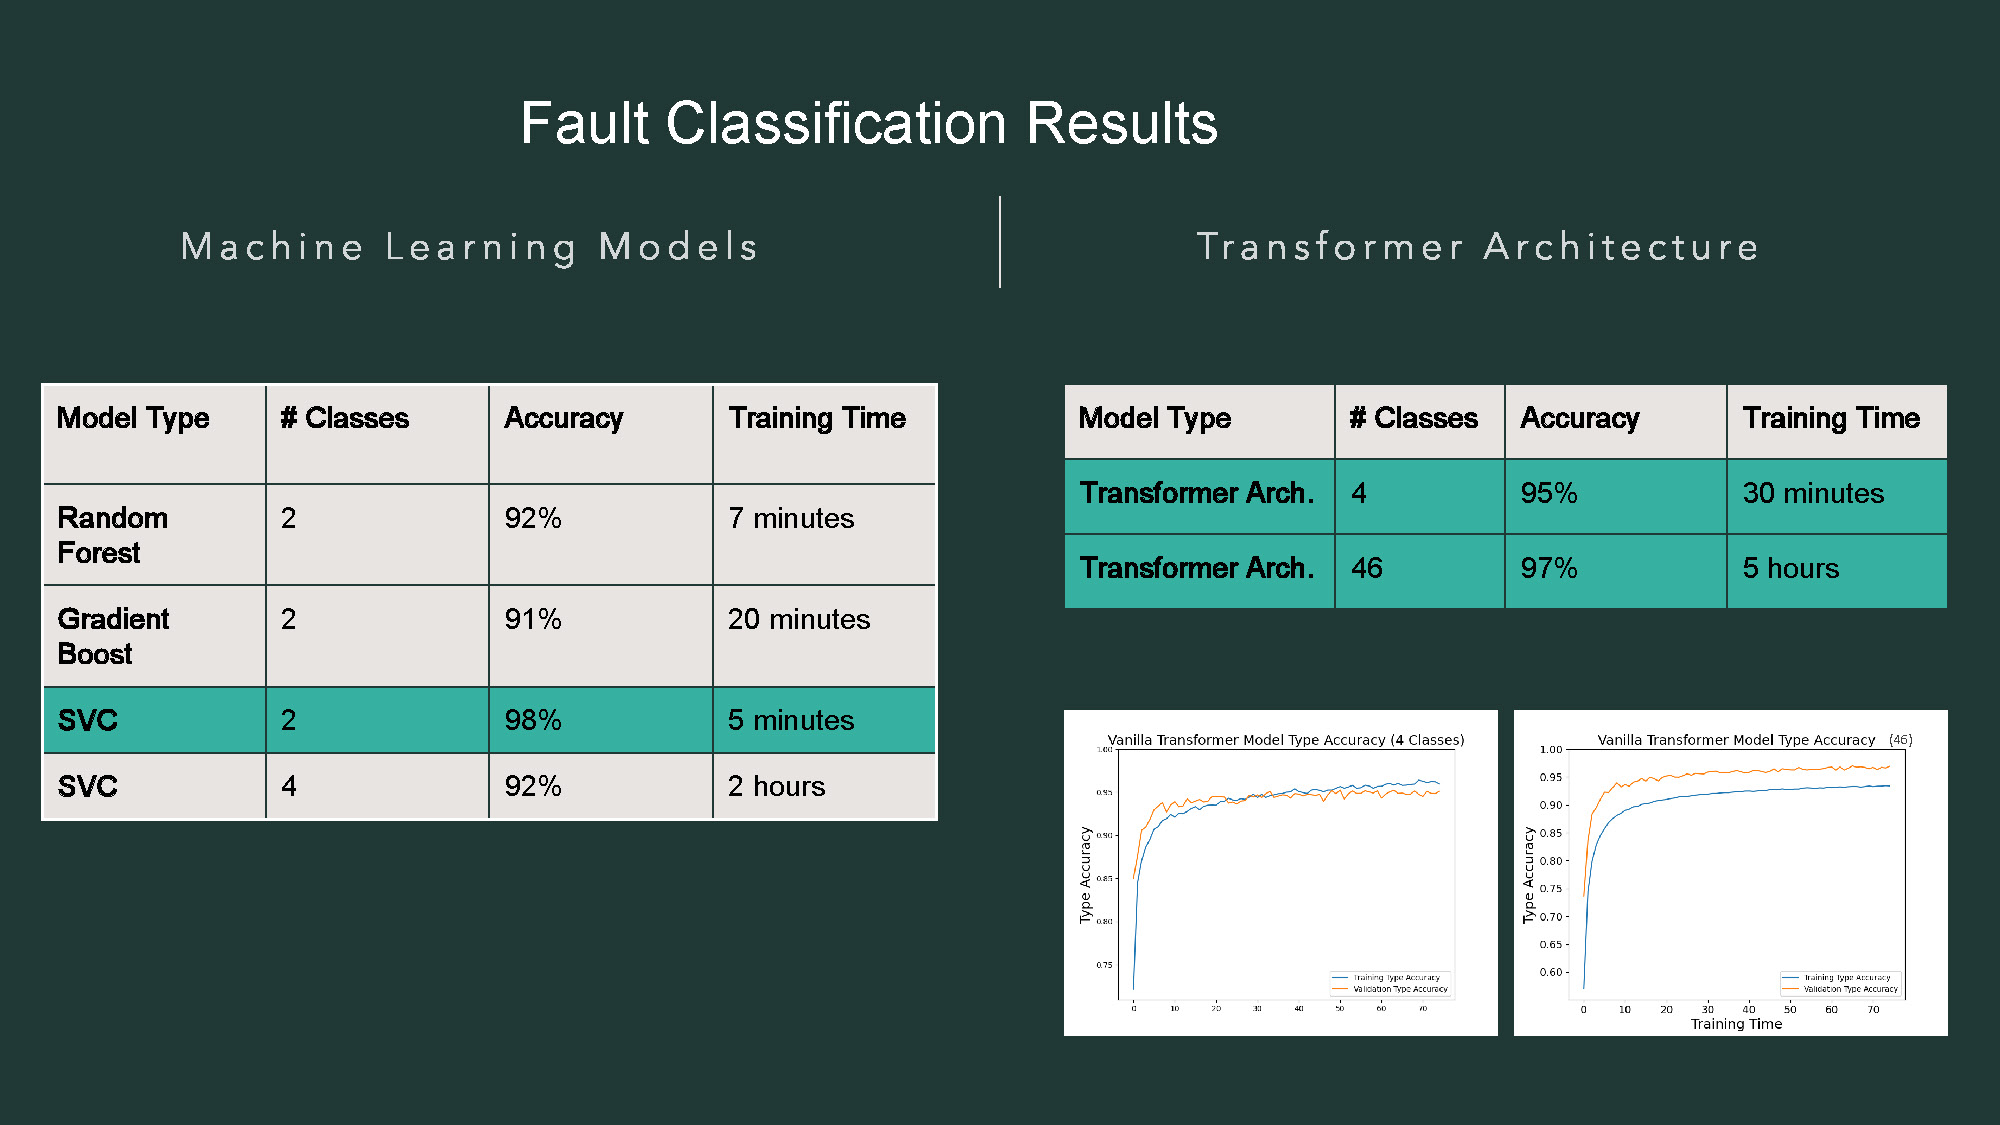
- The title "Fault Classification Results" is at the top.
- The page is split by a vertical line, with "Machine Learning Models" on the left and "Transformer Architecture" on the right.
- On the left, there is a table with four columns: "Model Type," "# Classes," "Accuracy," and "Training Time."
- The rows of this table show data for "Random Forest," "Gradient Boost," and "SVC." The rows for "SVC" are highlighted in a light green color.
- On the right, a second table with the same column headers shows results for "Transformer Arch." with "4" and "46" classes. The rows are also highlighted in a light green color.
- Below the right table, there are two line graphs.
- The graph on the left is titled "Vanilla Transformer Model Type Accuracy (4 Classes)." It shows two lines, "training_type accuracy" and "validation_type Accuracy."
- The graph on the right is titled "Vanilla Transformer Model Type Accuracy (46)." It also shows "training_type accuracy" and "validation_type Accuracy."
| Model Type | # Classes | Accuracy | Training Time |
|---|---|---|---|
| Random Forest | 2 | 92% | 7 minutes |
| Gradient Boost | 2 | 91% | 20 minutes |
| SVC | 2 | 98% | 5 minutes |
| SVC | 4 | 92% | 2 hours |
| Model Type | # Classes | Accuracy | Training Time |
|---|---|---|---|
| Transformer Arch. | 4 | 95% | 30 minutes |
| Transformer Arch. | 46 | 97% | 5 hours |
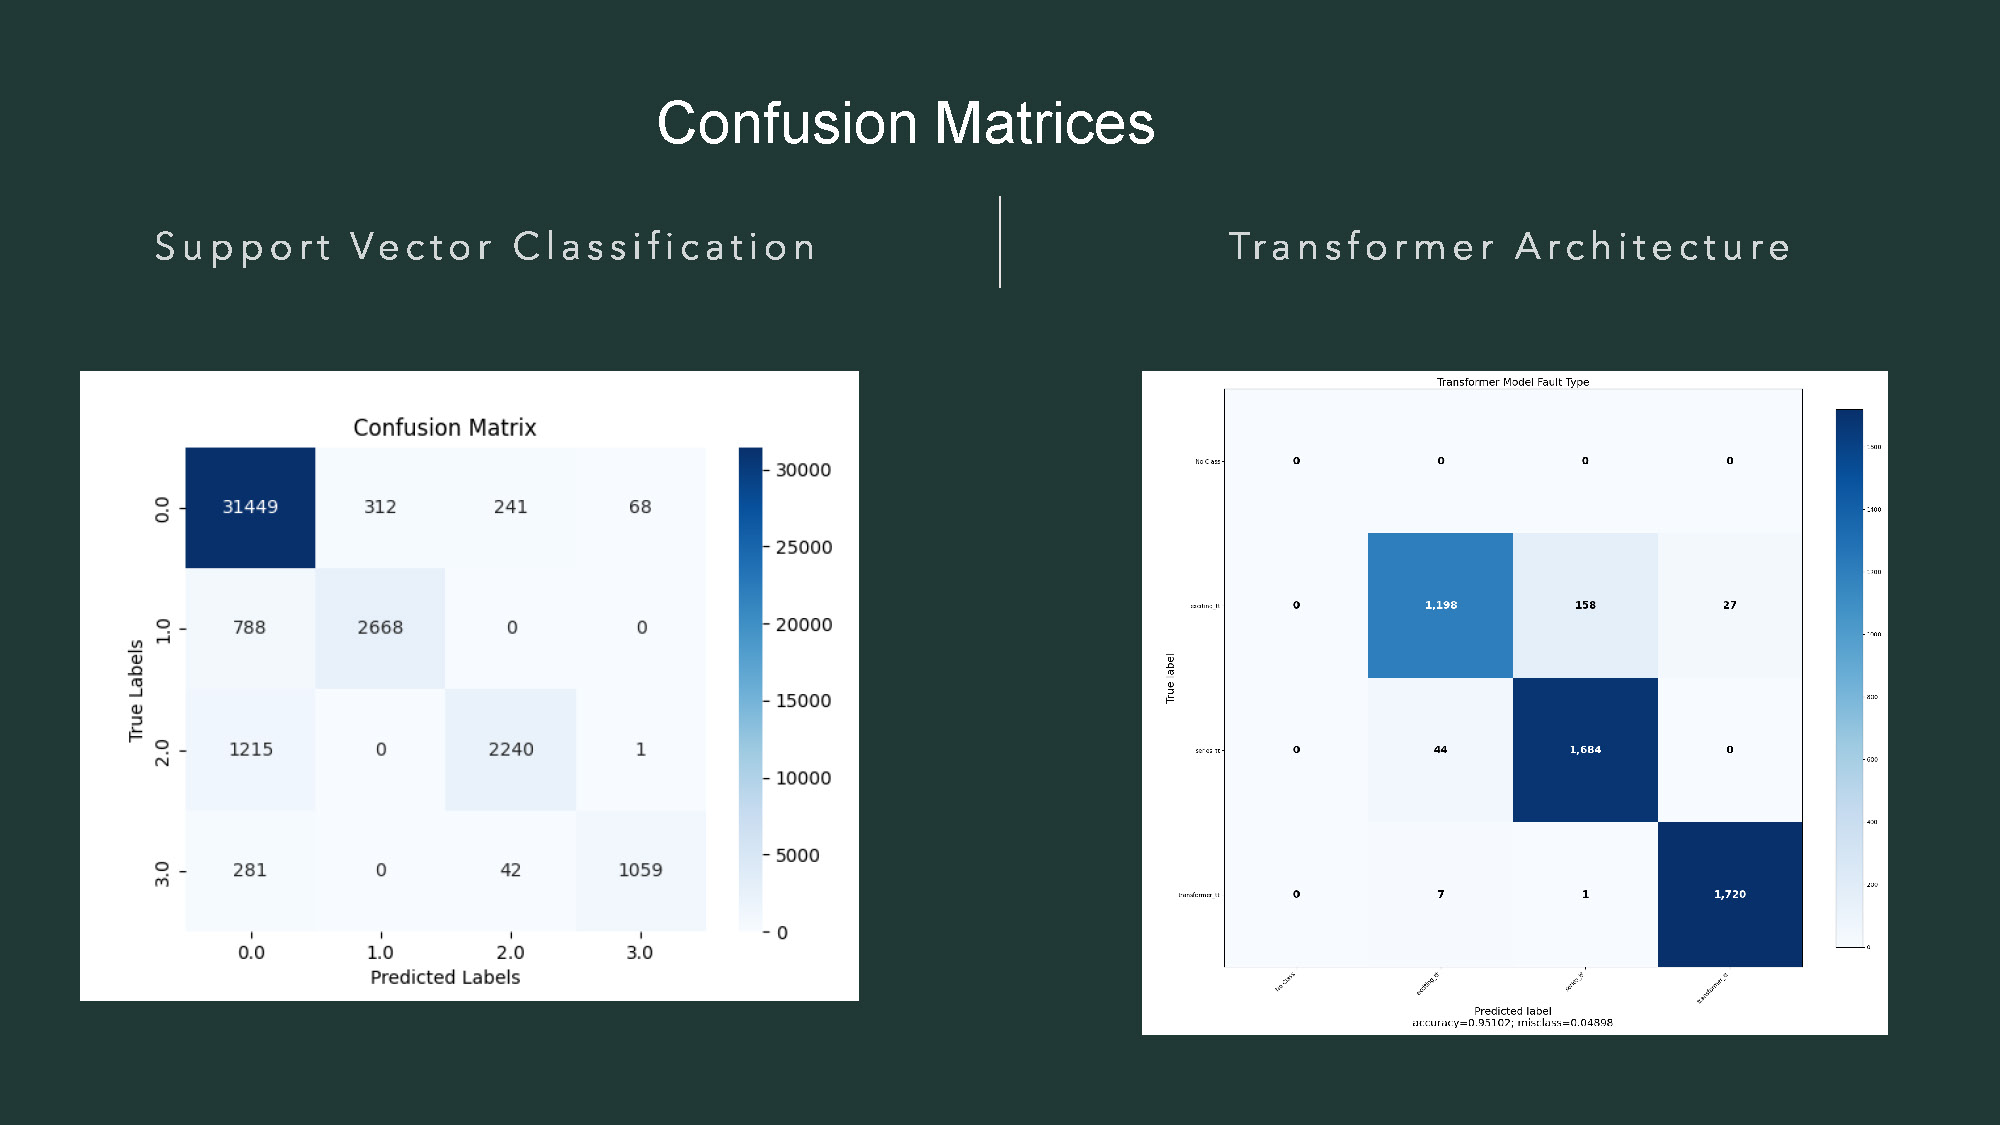
- The title "Confusion Matrices" is at the top.
- The page is split by a vertical line, with "Support Vector Classification" on the left and "Transformer Architecture" on the right.
- On the left, there is a heat map titled "Confusion Matrix." The axes are labeled with numbers 0.0, 1.0, 2.0, and 3.0. The left y-axis is labeled "True Labels," and the x-axis is labeled "Predicted Labels." The matrix shows a range of dark to light blue squares with numerical values.
- On the right, there is another heat map titled "Transformer Model Fault Type."
- The right heat map has the y-axis labeled "True label" and the x-axis labeled "Predicted label." The cells contain numerical values and are colored in shades of blue.
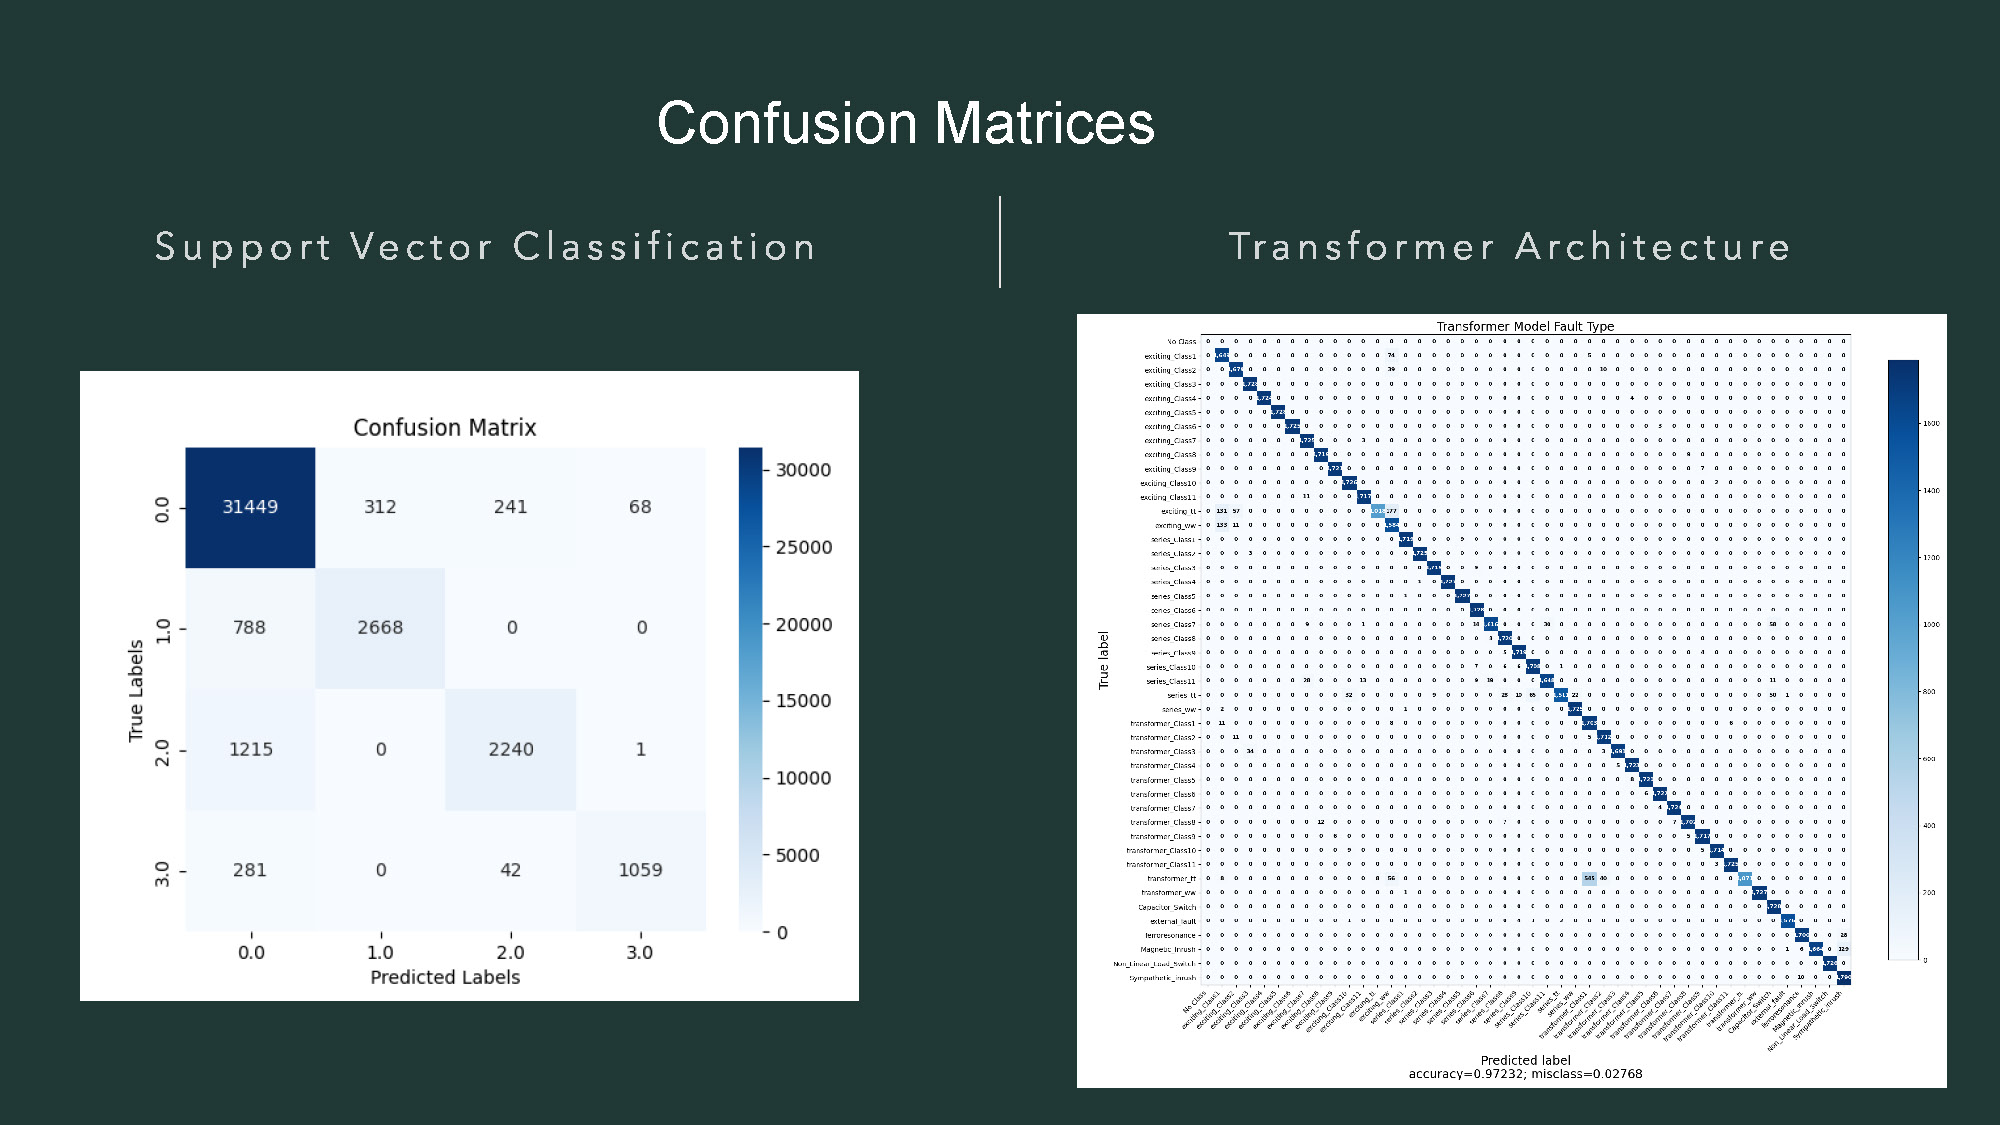
- The title "Confusion Matrices" is at the top.
- The page is split by a vertical line, with "Support Vector Classification" on the left and "Transformer Architecture" on the right.
- On the left, there is a heat map titled "Confusion Matrix." The axes are labeled with numbers 0.0, 1.0, 2.0, and 3.0. The y-axis is labeled "True Labels," and the x-axis is labeled "Predicted Labels." The cells contain numbers and are colored in shades of blue.
- On the right, there is a large heat map titled "Transformer Model Fault Type."
- This right heat map has a large number of labels on both the y-axis ("True label") and x-axis ("Predicted label"). The labels are small and mostly illegible, but appear to be text. Many cells in the matrix contain the letter 'X', while some on the diagonal contain numbers.

Full System Integration section showing complete system architecture
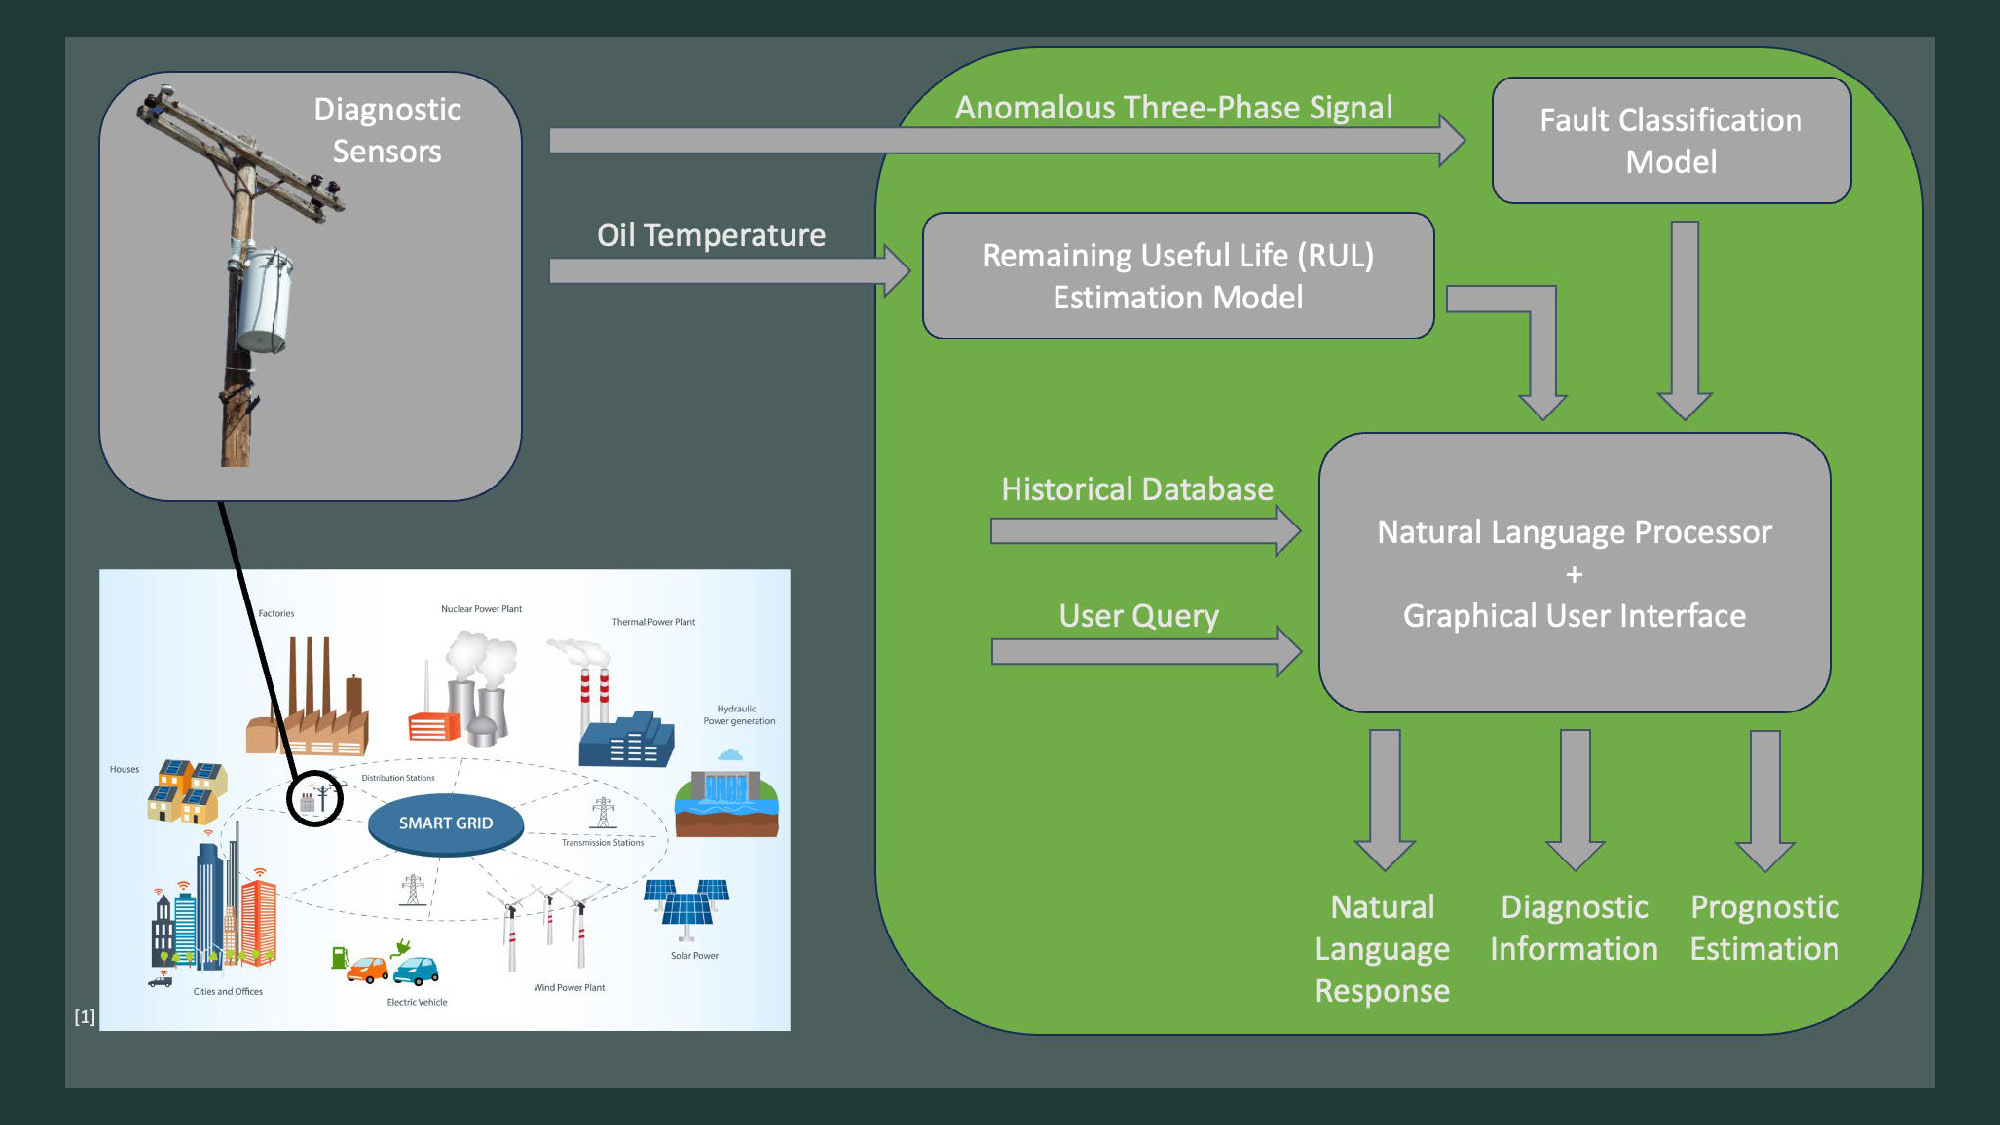
- A diagram on the left shows a utility pole with "Diagnostic Sensors" and a smart grid illustration.
- Arrows point from "Diagnostic Sensors" and "Oil Temperature" into a larger green box on the right.
- The green box contains a flowchart.
- At the top of the flowchart are two boxes: "Anomalous Three-Phase Signal" and "Oil Temperature," which point to "Fault Classification Model" and "Remaining Useful Life (RUL) Estimation Model," respectively.
- The "Fault Classification Model" and "Remaining Useful Life (RUL) Estimation Model" boxes have arrows that point down to a larger central gray box.
- The central gray box has a label on top, "Historical Database," and is titled "Natural Language Processor + Graphical User Interface." An arrow labeled "User Query" also points to this box.
- Three arrows point out of the central gray box at the bottom, leading to the labels "Natural Language Response," "Diagnostic Information," and "Prognostic Estimation."

Dark green slide with the word 'Demonstration'
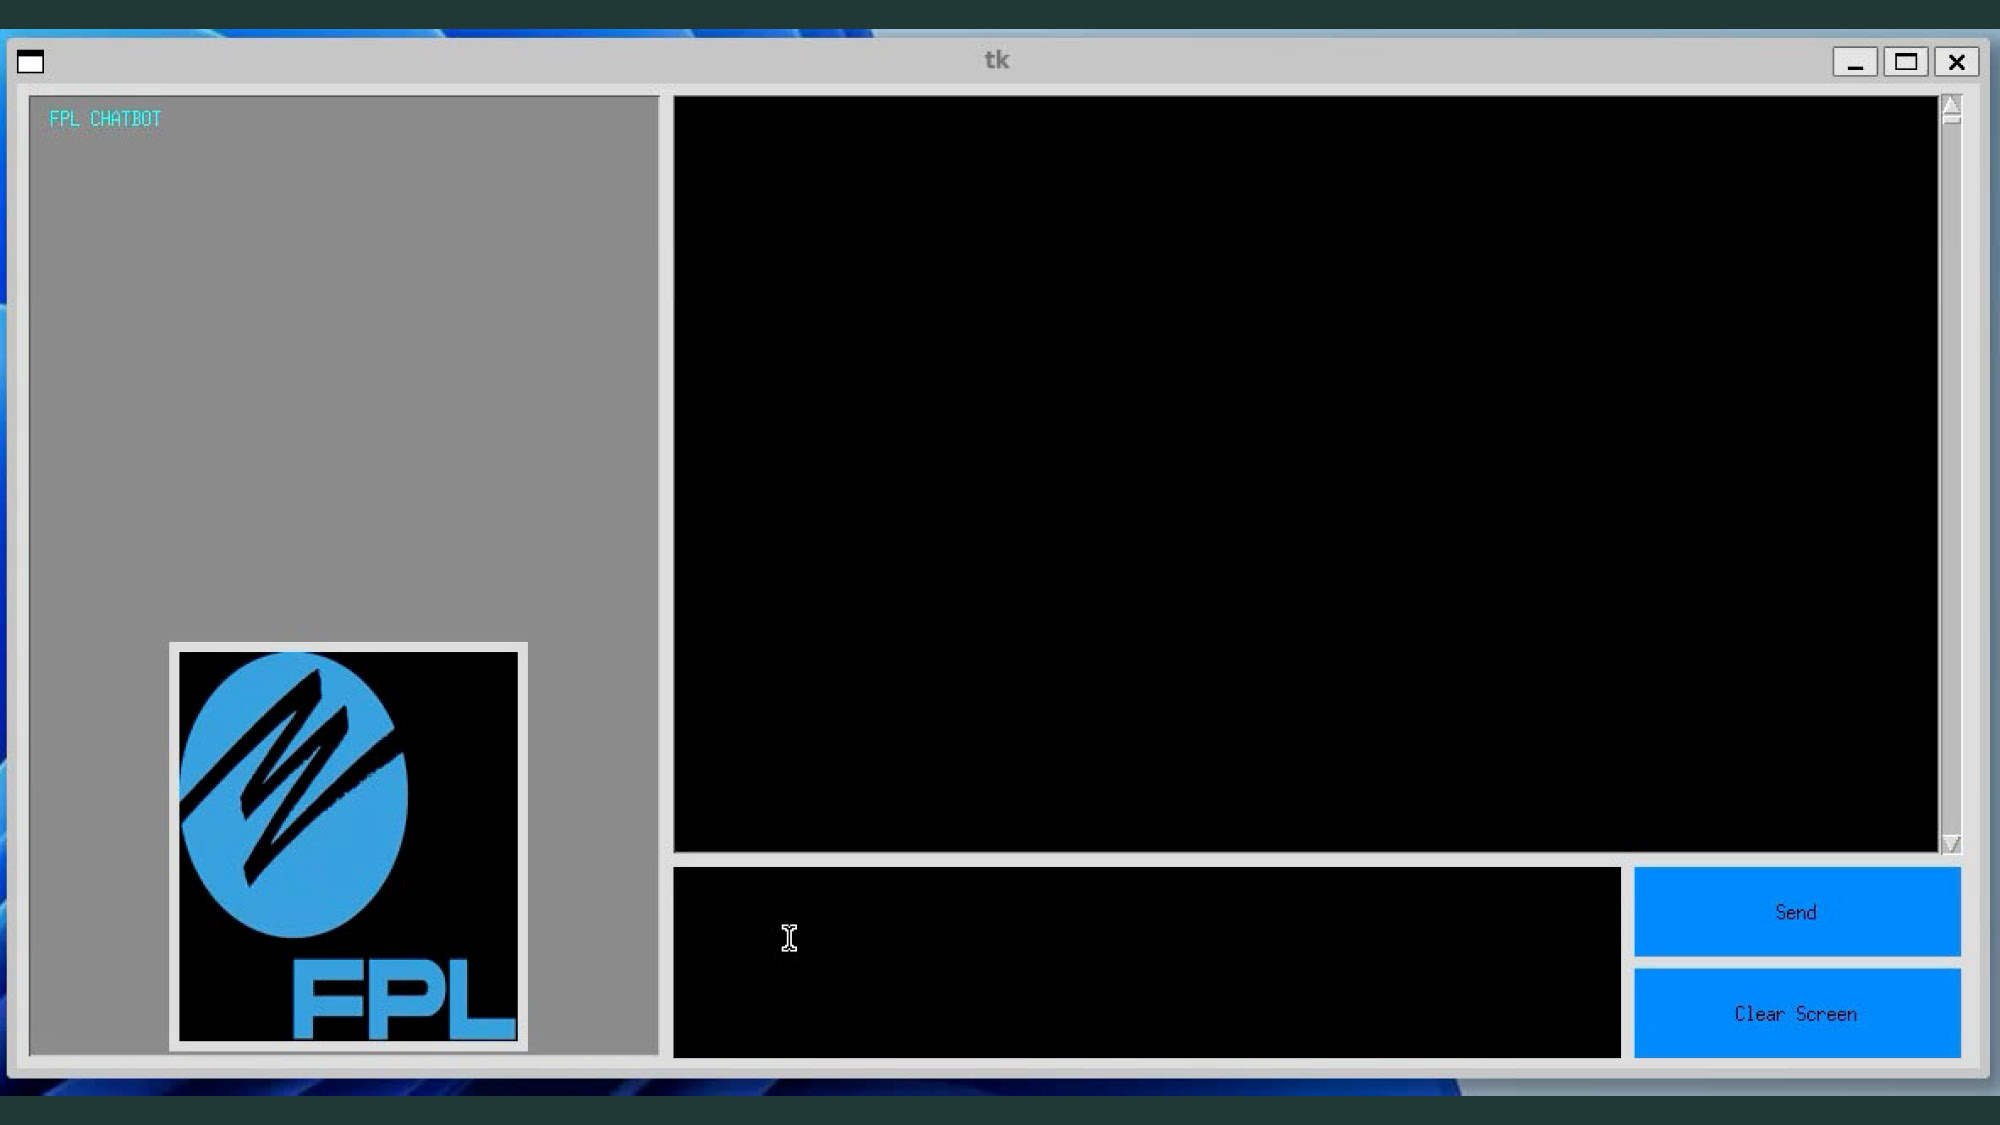
- The image shows a graphical user interface of a program window.
- The title bar of the window says "tk."
- The window is divided into several panes.
- The left pane is gray and has the text "FPL CHATBOT" in the top left corner.
- A blue and white FPL logo is in the bottom part of the left pane.
- The largest pane in the center is black.
- Below the black pane, there is a smaller input field with a blinking cursor.
- To the right of the input field are two blue buttons, the top one labeled "Send" and the bottom one labeled "Clear Screen."
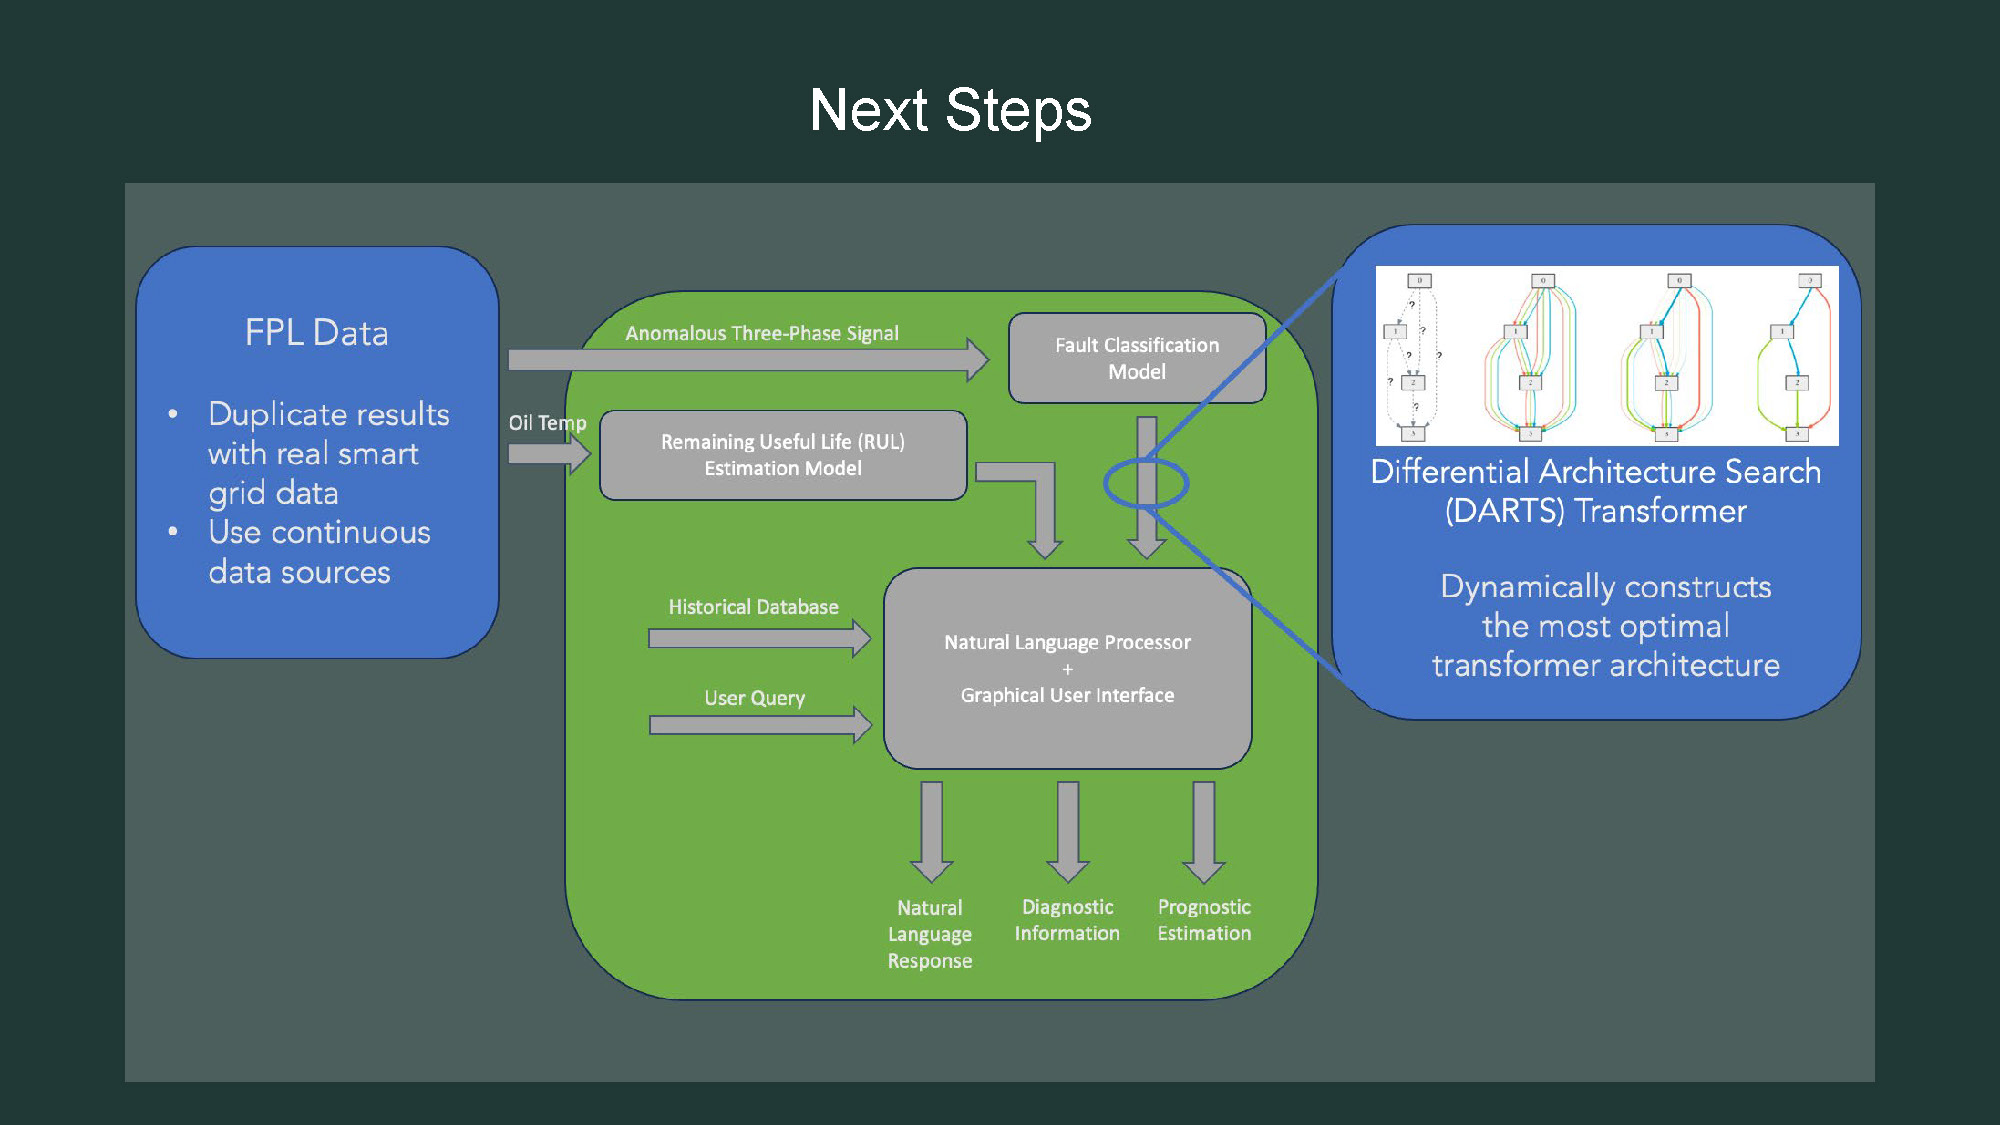
- The title "Next Steps" is centered at the top.
- A blue box on the left is titled "FPL Data" and contains two bullet points: "Duplicate results with real smart grid data" and "Use continuous data sources."
- A large green box in the center contains a flowchart with labeled gray boxes and arrows, similar to a previous image. The boxes include "Anomalous Three-Phase Signal," "Oil Temp," "Fault Classification Model," "Remaining Useful Life (RUL) Estimation Model," "Historical Database," and "Natural Language Processor + Graphical User Interface."
- Below the central gray box, there are three labels: "Natural Language Response," "Diagnostic Information," and "Prognostic Estimation."
- A blue box on the right is titled "Differential Architecture Search (DARTS) Transformer."
- This box contains a diagram with multiple interconnected boxes and curved lines.
- The text below the diagram says "Dynamically constructs the most optimal transformer architecture."
- An arrow points from the "Fault Classification Model" box to the "DARTS" box.
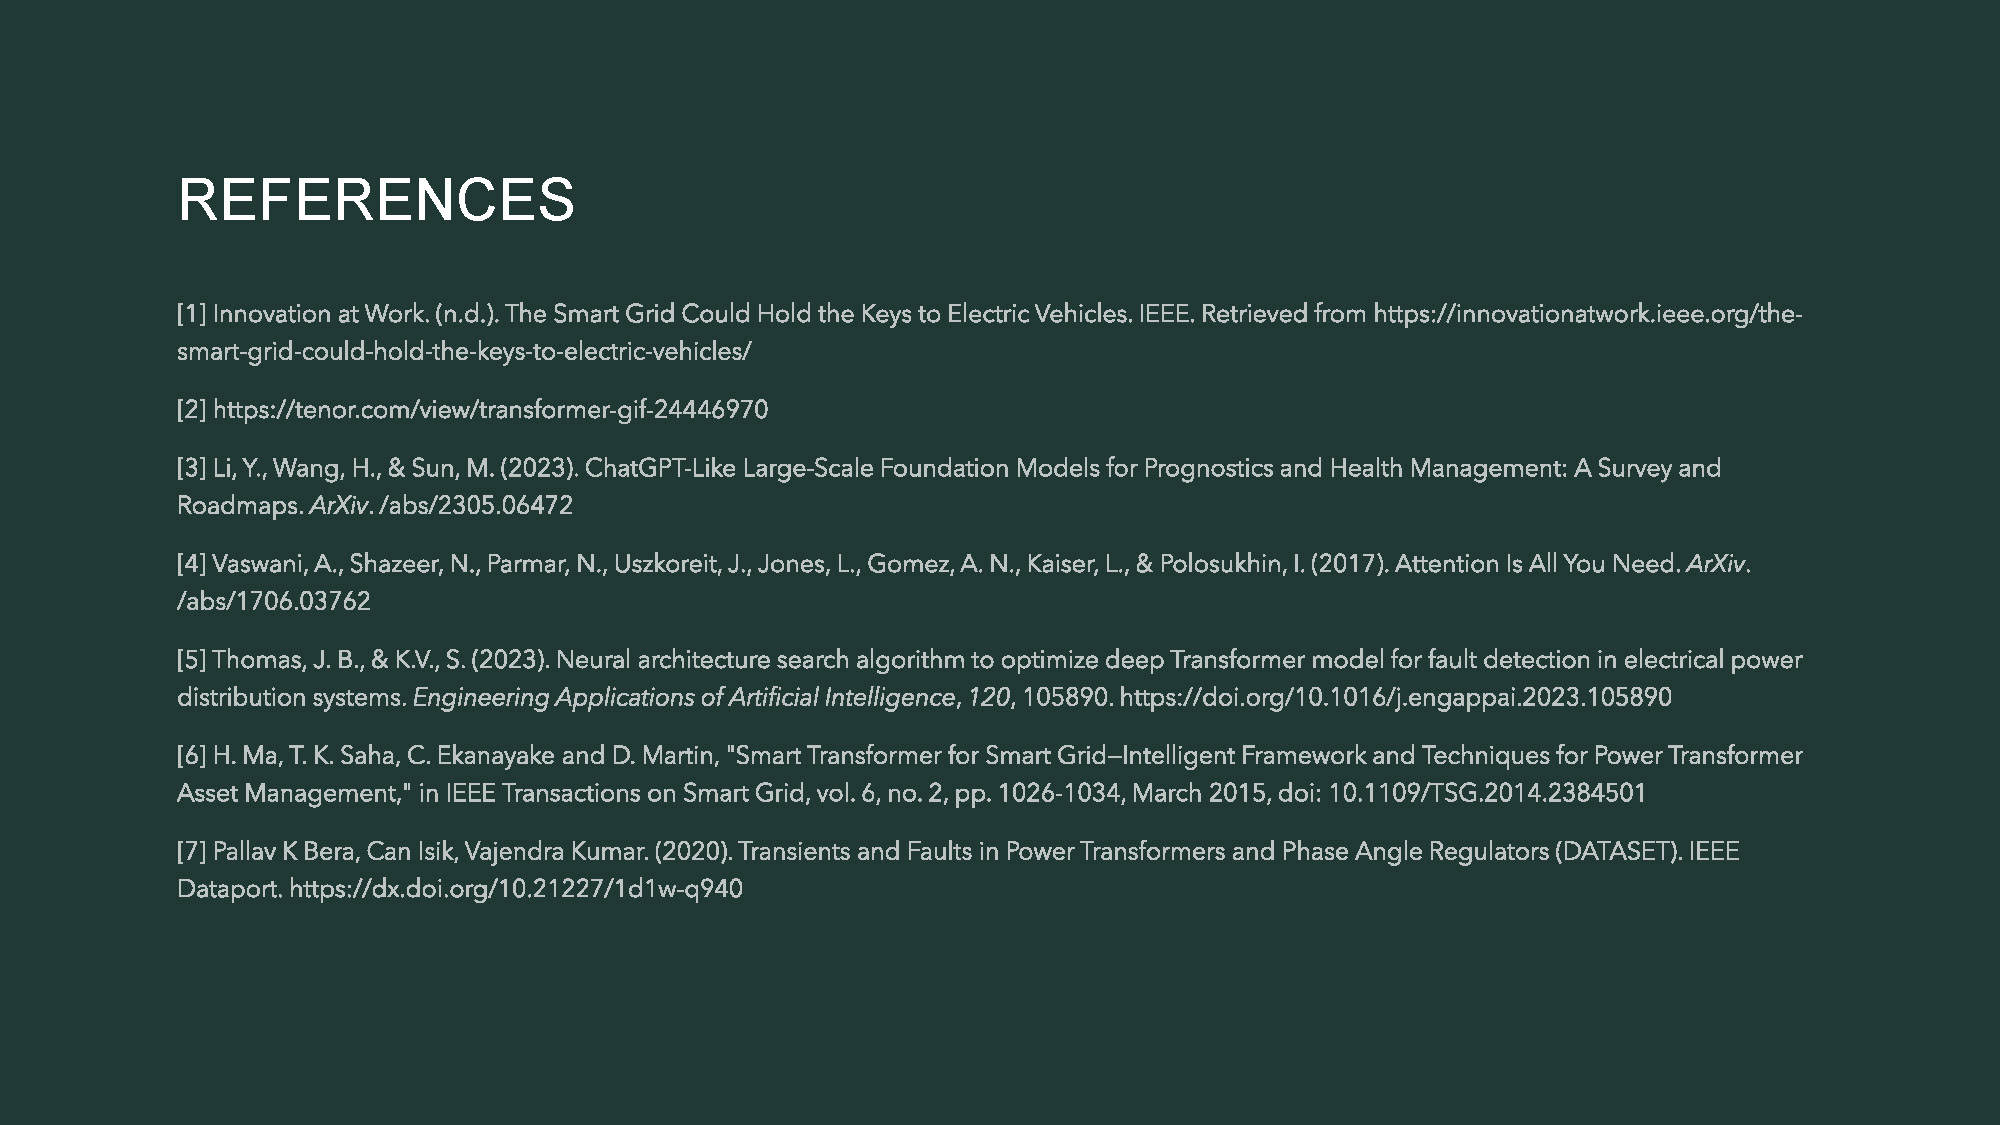
REFERENCES
- Innovation at Work. (n.d.). The Smart Grid Could Hold the Keys to Electric Vehicles. IEEE. Retrieved from https://innovationatwork.ieee.org/the-smart-grid-could-hold-the-keys-to-electric-vehicles/
- https://tenor.com/view/transformer-gif-244446970
- Li, Y., Wang, H., & Sun, M. (2023). ChatGPT-Like Large-Scale Foundation Models for Prognostics and Health Management: A Survey and Roadmaps. ArXiv. /abs/2305.06472
- Vaswani, A., Shazeer, N., Parmar, N., Uszkoreit, J., Jones, L., Gomez, A. N., Kaiser, L., & Polosukhin, I. (2017). Attention is All You Need. ArXiv. /abs/1706.03762
- Thomas, J. B., & K.V, S. (2023). Neural architecture search algorithm to optimize deep Transformer model for fault detection in electrical power distribution systems. Engineering Applications of Artificial Intelligence, 120, 105890. https://doi.org/10.1016/j.engappai.2023.105890
- H. Ma, T. K. Saha, C. Ekanayake and D. Martin, “Smart Transformer for Smart Grid—Intelligent Framework and Techniques for Power Transformer Asset Management,” in IEEE Transactions on Smart Grid, vol. 6, no. 2, pp. 1026-1034, March 2015, doi: 10.1109/TSG.2014.2384501
- Pallav K Bera, Can Isik, Vajendra Kumar. (2020). Transients and Faults in Power Transformers and Phase Angle Regulators (DATASET). IEEE Dataport. https://dx.doi.org/10.21227/1d1w-q940

End of Presentation
Click the right arrow to return to the beginning of the slide show.
For a downloadable version of this presentation, email: I-SENSE@FAU.