Federated Learning for Autonomous Driving
By: Koy Torres & David Sanchez
Mentored by: Yufei Tang
A bit of background for AD
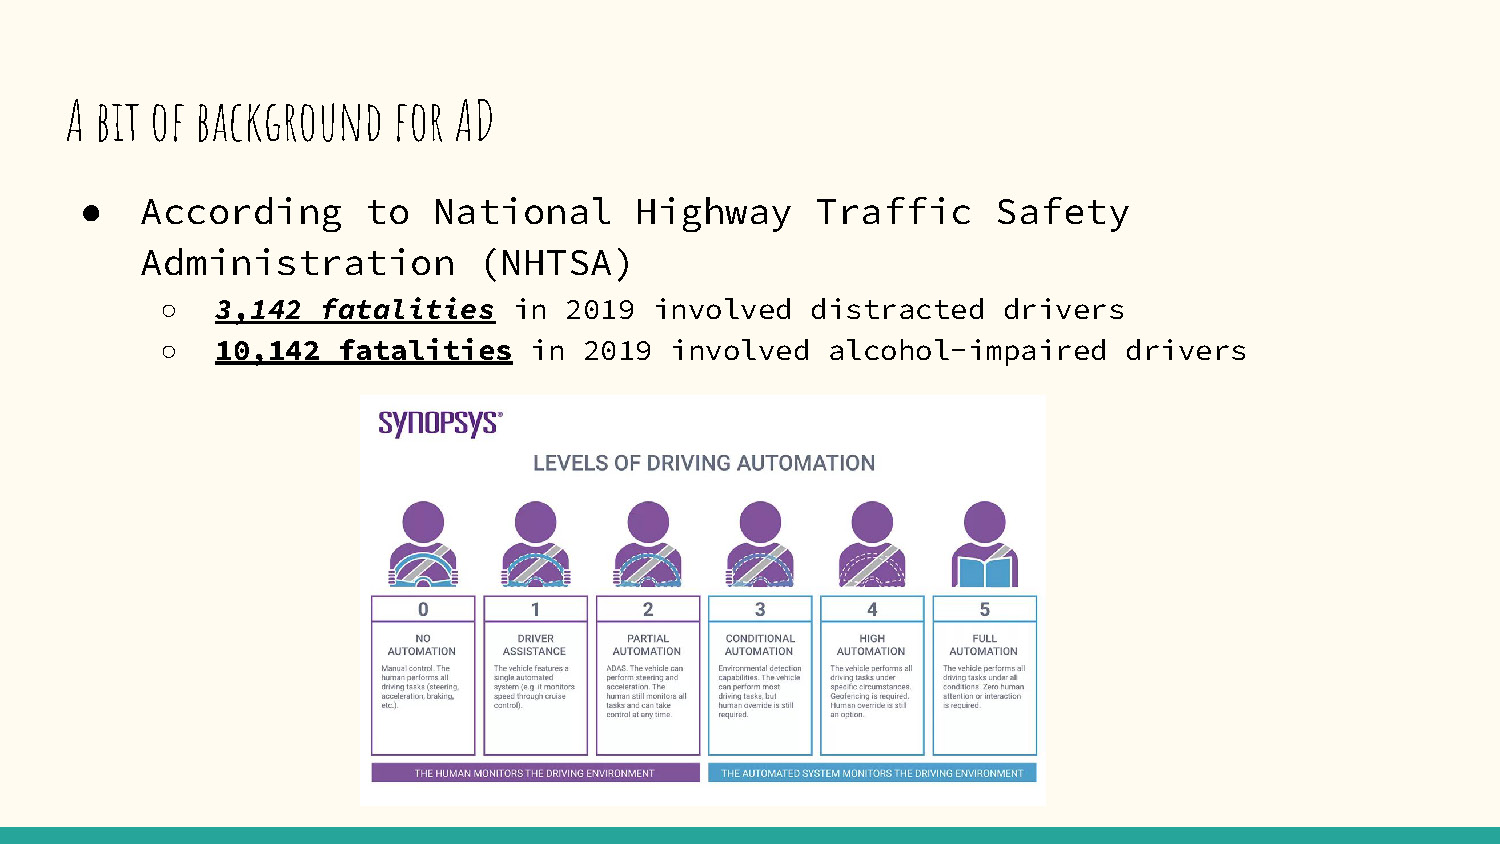
- According to National Highway Traffic Safety Administration (NHTSA)
- 3,142 fatalities in 2019 involved distracted drivers
- 10,142 fatalities in 2019 involved alcohol-impaired drivers
- 0 – No Automation: Manual control, all tasks performed by human.
- 1 – Driver Assistance: Vehicle assists with a single automated system (e.g., cruise control).
- 2 – Partial Automation: Vehicle can perform steering and acceleration, but human monitors at all times.
- 3 – Conditional Automation: Vehicle manages tasks in certain environments, human intervention still required.
- 4 – High Automation: Vehicle handles driving tasks under limited conditions, no human intervention needed.
- 5 – Full Automation: Vehicle performs all driving tasks under all conditions, no human attention required.
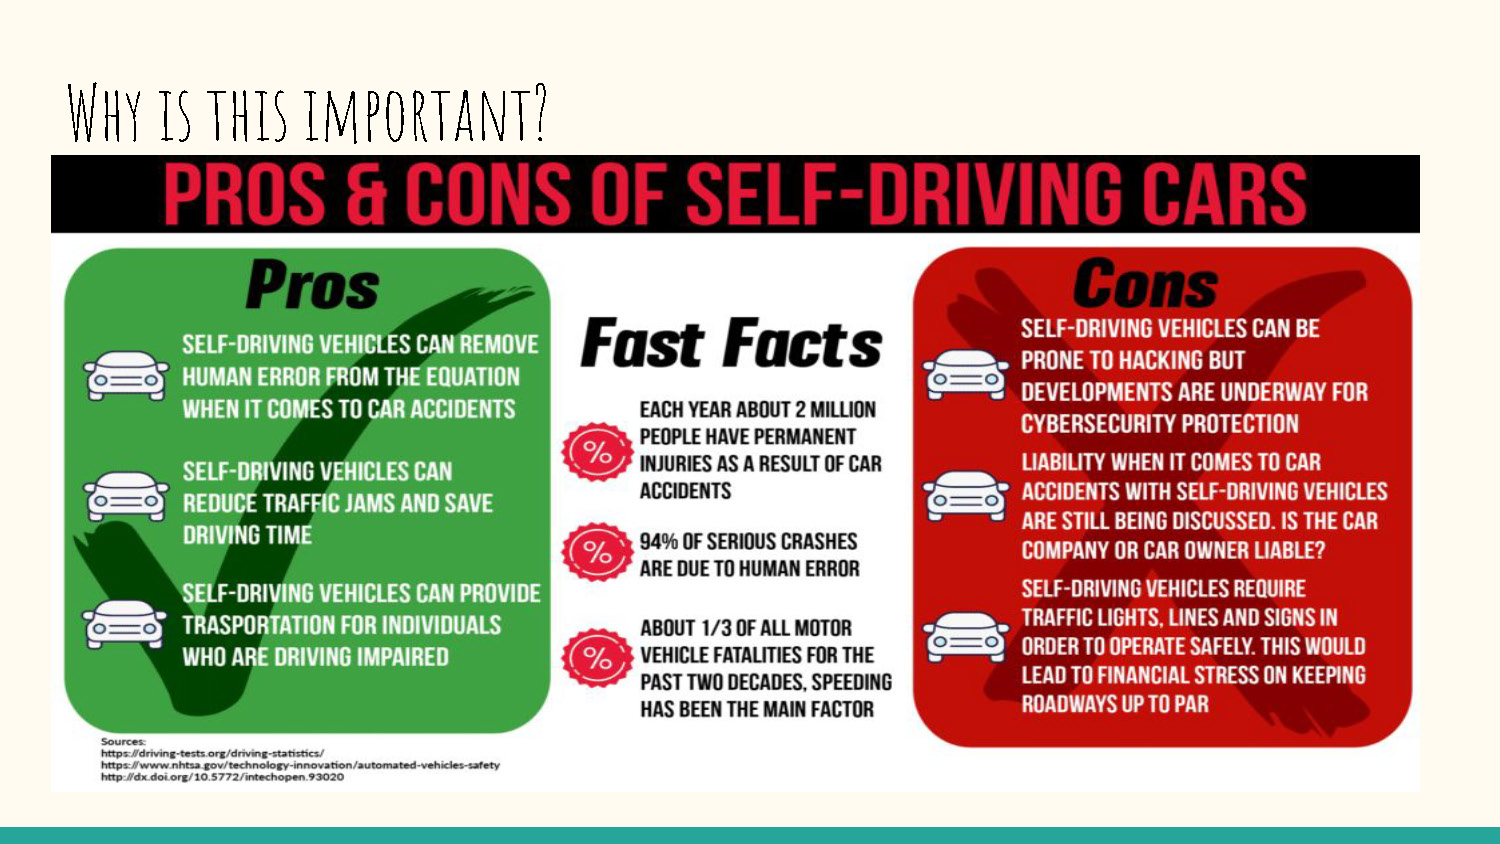
The image is a slide titled "PROS & CONS OF SELF-DRIVING CARS." The title is in large white font against a black and red background. A smaller heading, "WHY IS THIS IMPORTANT?" is in a handwritten font above the main title. The slide is divided into three main columns: "Pros" on the left with a green background, "Fast Facts" in the center with a white background, and "Cons" on the right with a red background.
The "Pros" section lists three points with a green checkmark icon. The points are: "Self-driving vehicles can remove human error from the equation when it comes to car accidents," "Self-driving vehicles can reduce traffic jams and save driving time," and "Self-driving vehicles can provide transportation for individuals who are driving impaired."
The "Fast Facts" section has three bullet points, each with a pink percent sign icon. The points are: "Each year about 2 million people have permanent injuries as a result of car accidents," "94% of serious crashes are due to human error," and "About 1/3 of all motor vehicle fatalities for the past two decades, speeding has been the main factor."
The "Cons" section lists three points with a red X icon. The points are: "Self-driving vehicles can be prone to hacking but developments are underway for cybersecurity protection," "Liability when it comes to car accidents with self-driving vehicles are still being discussed. Is the car company or car owner liable?" and "Self-driving vehicles require traffic lights, lines and signs in order to operate safely. This would lead to financial stress on keeping roadways up to par."
What is Federated Autonomous Driving Network (FADNet)?
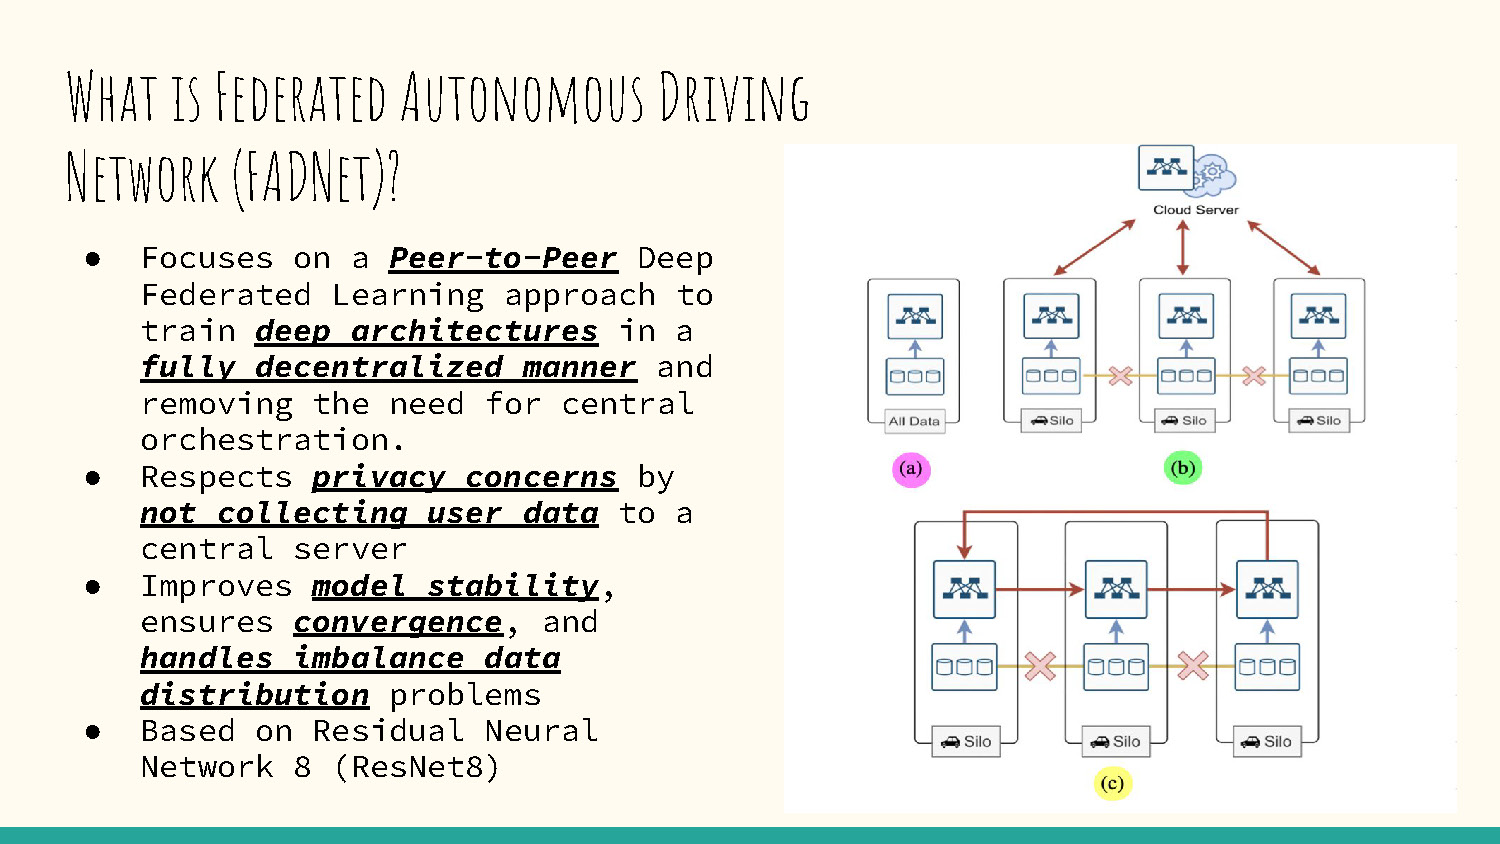
- Focuses on a Peer-to-Peer Deep Federated Learning approach to train deep architectures in a fully decentralized manner and removing the need for central orchestration.
- Respects privacy concerns by not collecting user data to a central server.
- Improves model stability, ensures convergence, and handles imbalance data distribution problems.
- Based on Residual Neural Network 8 (ResNet8).
On the right side of the slide, there are two diagrams.
The top diagram shows a cloud server connected to three "Silo" boxes, each labeled "All Data." The connections are represented by red arrows pointing from the server to the silos. The connections from the silos back to the server are represented by red arrows with a cross-out symbol, indicating a broken or severed connection. This diagram is labeled with a pink circle containing the letter "(a)."
The bottom diagram shows three "Silo" boxes. Each silo has bidirectional arrows connecting it to the adjacent silos, forming a linear network. These arrows are colored blue, and the center silo has a red cross-out symbol on the connection to the right silo. This diagram is labeled with a yellow circle containing the letter "(c)." A small, green circle with the letter "(b)" is placed between the two diagrams.
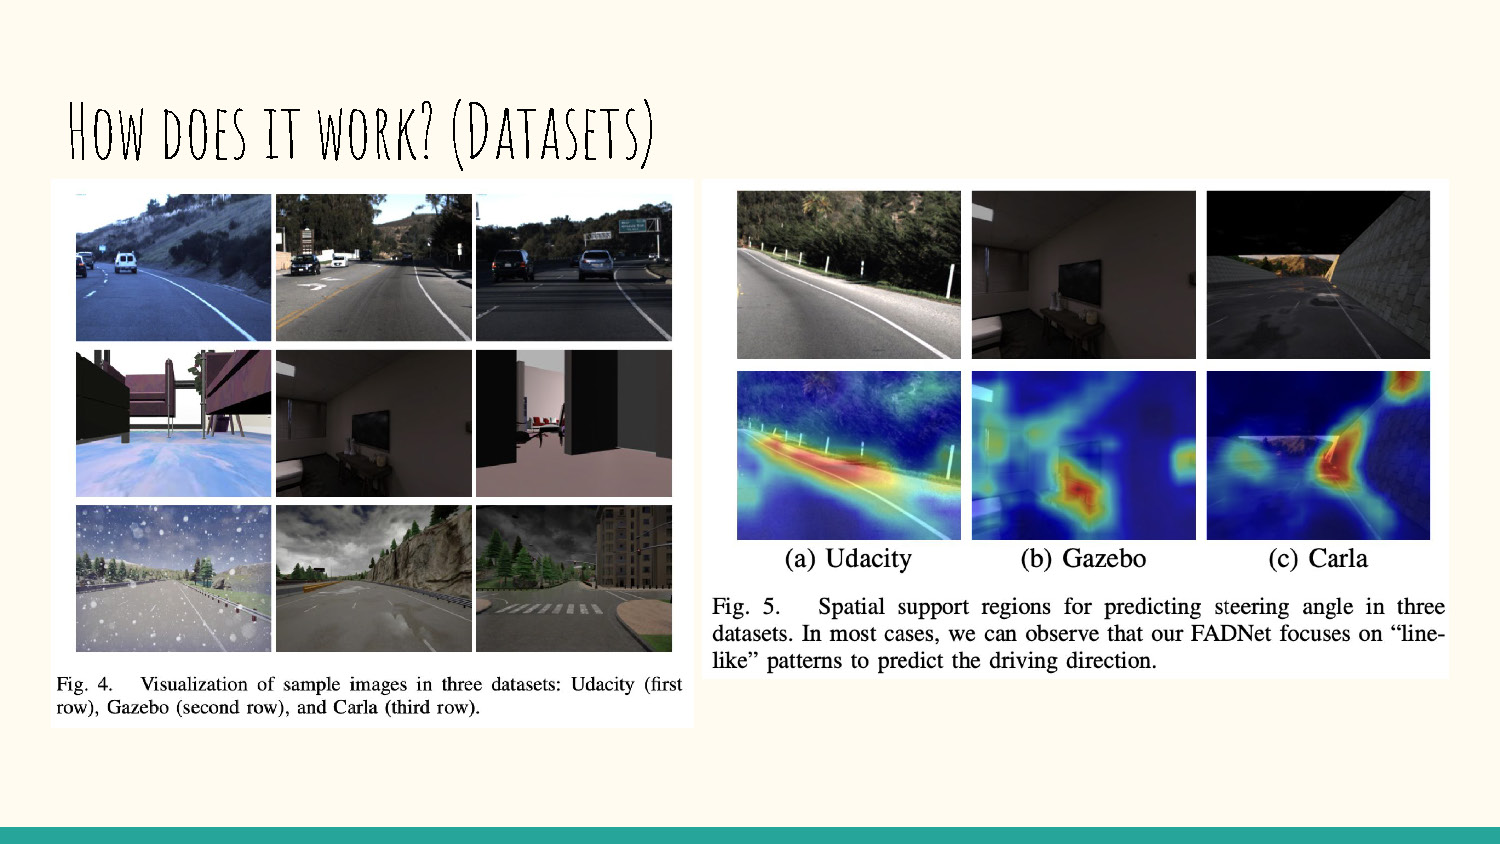
How does it work? (Datasets)
The slide contains two figures, each with a caption.
Fig. 4, on the left, is titled "Visualization of sample images in three datasets: Udacity (first row), Gazebo (second row), and Carla (third row)." It shows a grid of nine images arranged in three rows and three columns. The top row contains three photos of real-world roads. The middle row contains three images of an interior room. The bottom row contains three images of an outdoor driving environment, one of which shows snow.
Fig. 5, on the right, is titled "Spatial support regions for predicting steering angle in three datasets. In most cases, we can observe that our FADNet focuses on 'line-like' patterns to predict the driving direction." It shows a grid of six images arranged in two rows and three columns. The top row shows three images labeled "(a) Udacity," "(b) Gazebo," and "(c) Carla." The bottom row shows heatmaps corresponding to the images directly above them. The heatmaps have colored regions (blue, green, yellow, and red) overlaid on the images.
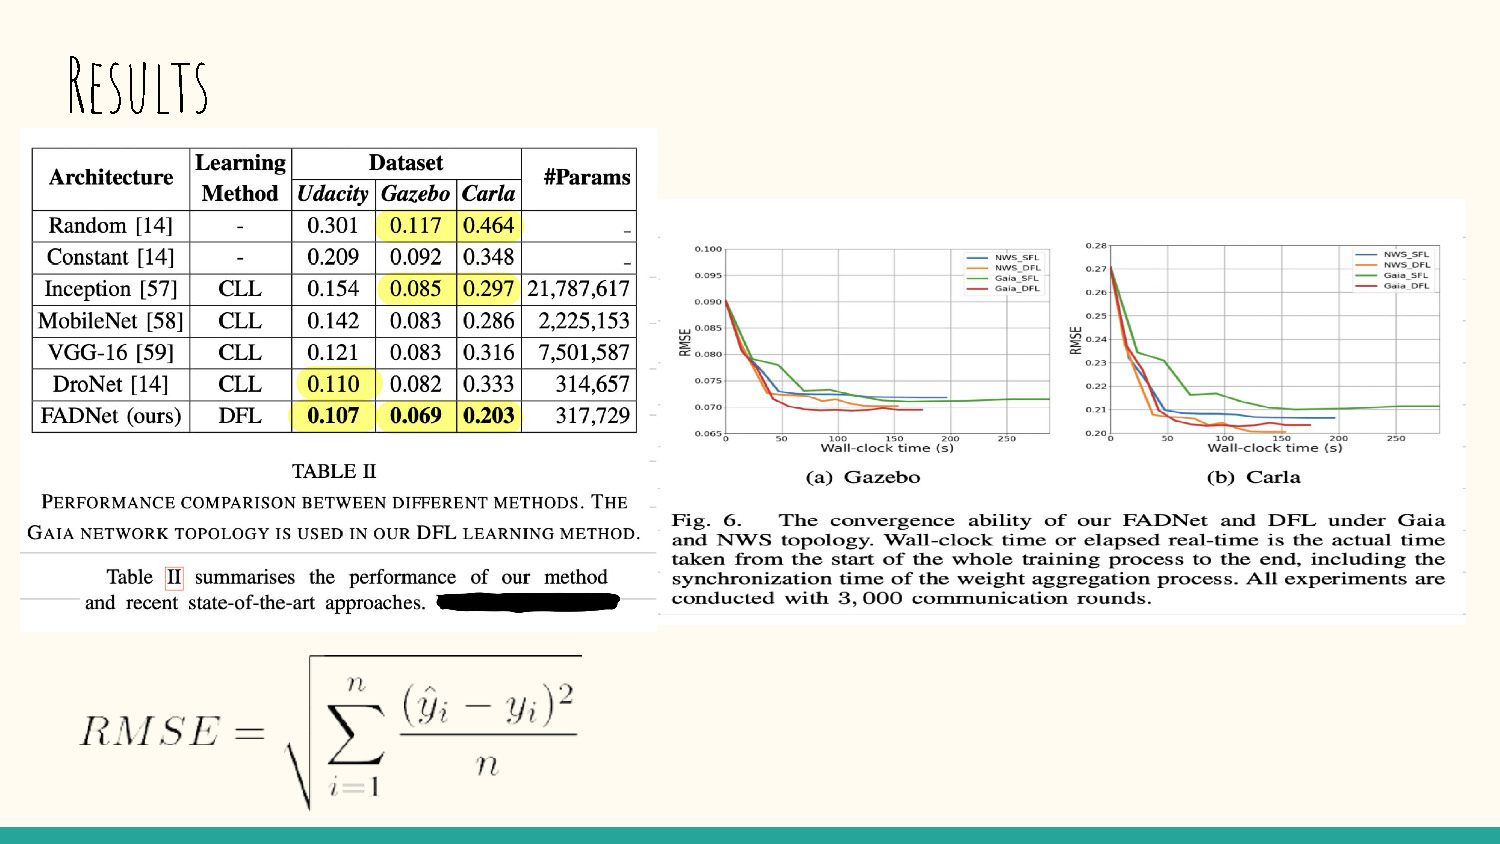
Results
The slide contains a table and two graphs, each with a caption.
The table, titled "TABLE II," is a "PERFORMANCE COMPARISON BETWEEN DIFFERENT METHODS." It has six rows of data under a header with the columns: "Architecture," "Learning Method," "Udacity," "Gazebo," "Carla," and "#Params." The cells in the "Udacity," "Gazebo," and "Carla" columns contain numerical values, with certain cells highlighted in yellow.
The graph section is labeled "Fig. 6. The convergence ability of our FADNet and DFL under Gaia and NWS topology." It shows two line graphs side-by-side, labeled "(a) Gazebo" and "(b) Carla." Both graphs plot "RMSE" on the y-axis against "Wall-clock time (s)" on the x-axis. Each graph displays four lines of different colors, each with a corresponding label in a legend.
Below the graphs, a sentence states that "Table II summarises the performance of our method and recent state-of-the-art approaches."
At the bottom of the slide, there is a mathematical formula for RMSE (Root Mean Square Error):
$$RMSE = \sqrt{\frac{\sum_{i=1}^{n} (\hat{y}_{i} - y_{i})^{2}}{n}}$$
Conclusion
In conclusion, we introduced a peer-to-peer to deep federated learning method that effectively utilizes the user data in a fully distributed manner. Our FADNet architecture has proven to have better accuracy performance than existing works.
Currently, our deployment experiment is limited to a mobile robot in an indoor environment.
In the future, we would like to test our approach with more silos and deploy the trained model using an autonomous car on man-made roads.
References
- Nguyen, Anh and Do, Tuong and Tran, Minh and Nguyen, Binh X and Duong, Chien and Phan, Tu and Tjiputra, Erman and Tran, Quang D. (2022, April 19). 33rd IEEE Intelligent Vehicles Symposium, Deep Federated Learning for Autonomous Driving. Retrieved from https://arxiv.org/pdf/2110.05754.pdf
- "What Is an Autonomous Car? – How Self-Driving Cars Work." Synopsys. Retrieved from www.synopsys.com/automotive/what-is-autonomous-car.html

End of Presentation
Click the right arrow to return to the beginning of the slide show.
For a downloadable version of this presentation, email: I-SENSE@FAU.