Ocean Current Turbine Emulation

Advisors: Dr. Tang and Sasha Fung
Presented by Carter Nichols and Elisa Weinberg

Opal-RT Overview
The image shows a tall, black, metal cabinet with a logo and the text "OPAL-RT" on its front door. The text "Opal-RT Overview" is in large, bold, orange letters in the dark blue section, with a thin orange line below it.
Opal-RT Overview
Background
- The US Government has made a commitment to reach net zero emissions by 2050 at the latest.
- The ocean's currents store a vast amount of untapped energy which looks promising as a source of sustainable renewable energy.
- Ocean Current Turbines (OCT's) have gained a lot of attention as a reliable and viable renewable energy source to be integrated into the power grid.
Opal-RT Overview
Project Impact
- As we get closer to the zero emissions deadline there is an increasing push for research into renewable energies.
- This research will highlight how efficient OCT's would be for utility scale power generation.
- Why Opal-RT? There is an increasing demand for reliable testing and simulation, which needs to be done on real time simulation technologies.
Opal-RT Overview
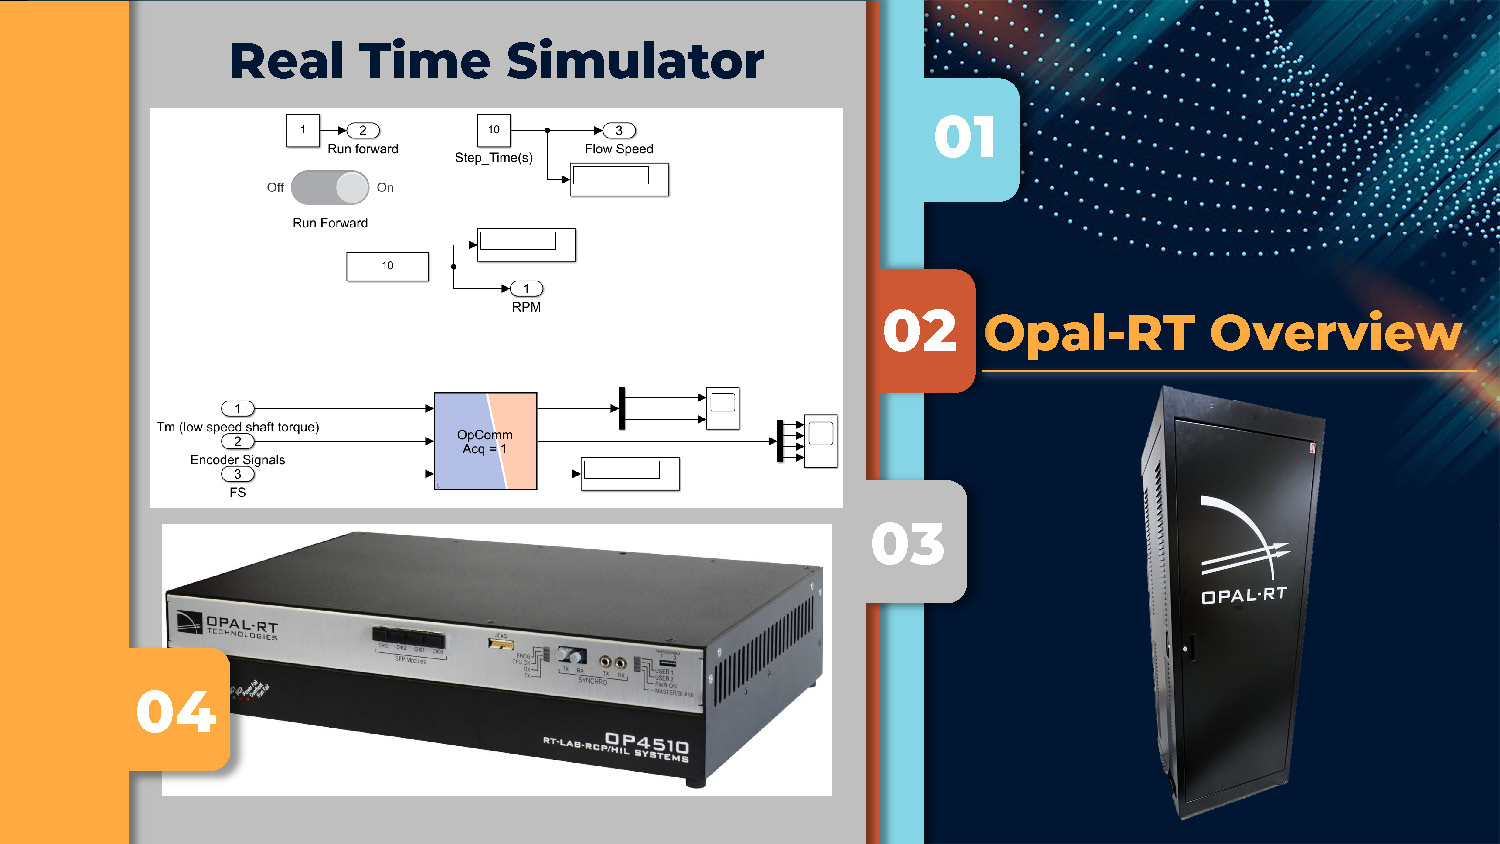
Real Time Simulator
The image displays a multi-paneled layout. The main left panel, which is grey, shows a diagram of a "Real Time Simulator" with various interconnected blocks and numerical values. Below this diagram, a low-profile, silver-and-black electronic device labeled "OPAL-RT OP4510" is visible. On the right side of the image, there's a vertical column with four colored rectangular blocks. From top to bottom, the blocks are light blue, orange, grey, and orange, numbered 01 through 04. The orange block in the second position has the text "Opal-RT Overview" and is positioned next to a tall, black cabinet similar to the one in the first image.
Opal-RT Overview
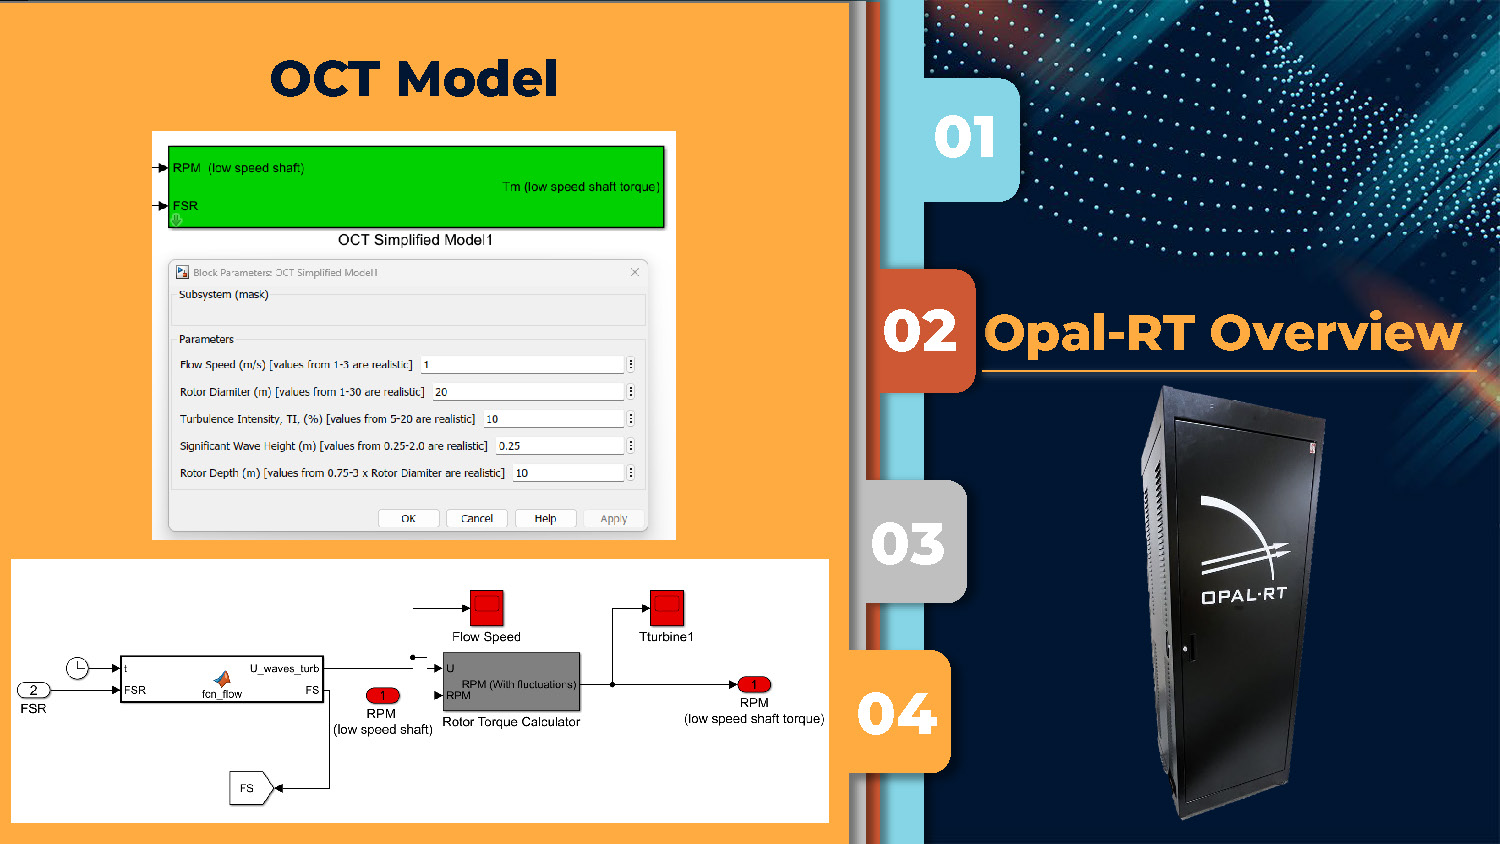
OCT Model
This image has a similar multi-paneled layout. The main left panel, which is orange-yellow, shows two diagrams. The top diagram is a pop-up window titled "OCT Simplified Model" with various parameters and controls. The bottom diagram shows interconnected blocks labeled "U_waves_tun," "RPM," "TTurbine1," and others, with connecting arrows. The right side of the image features a vertical column of four numbered, colored rectangular blocks identical to the previous image, with the same "Opal-RT Overview" text next to the tall, black cabinet.
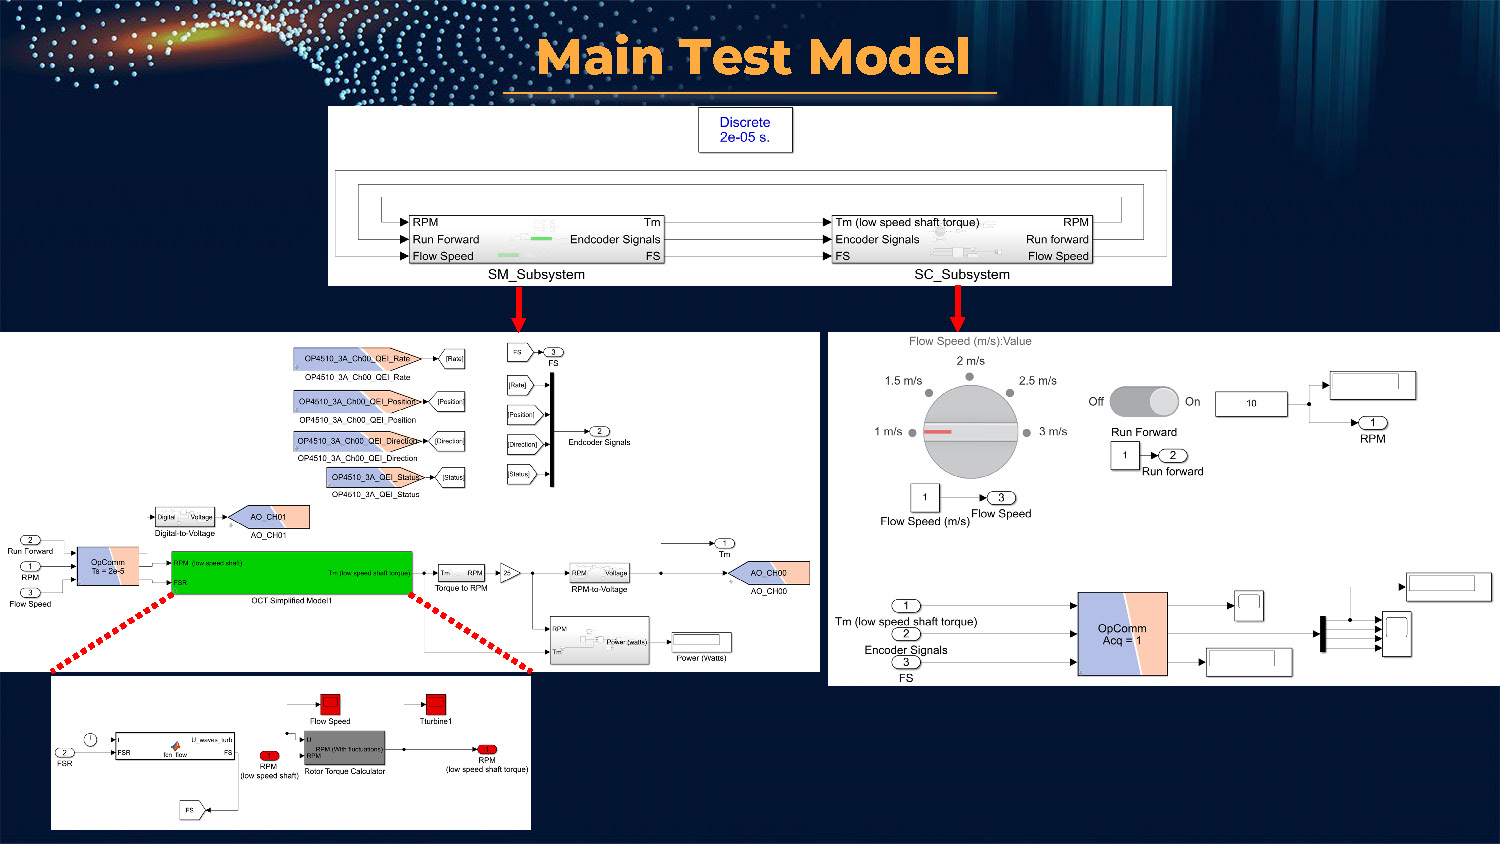
Main Test Model
The image features a dark green background with a dotted pattern. It shows several interconnected diagrams with different layouts. The top diagram shows two subsystems, "SM_Subsystem" and "SC_Subsystem." The middle section has three distinct diagrams: one with a large central block and multiple inputs and outputs, a second with a circular dial for "Flow Speed," and a third with another set of interconnected blocks. The bottom section displays a smaller, detailed diagram of a "Rotor Torque Calculator."
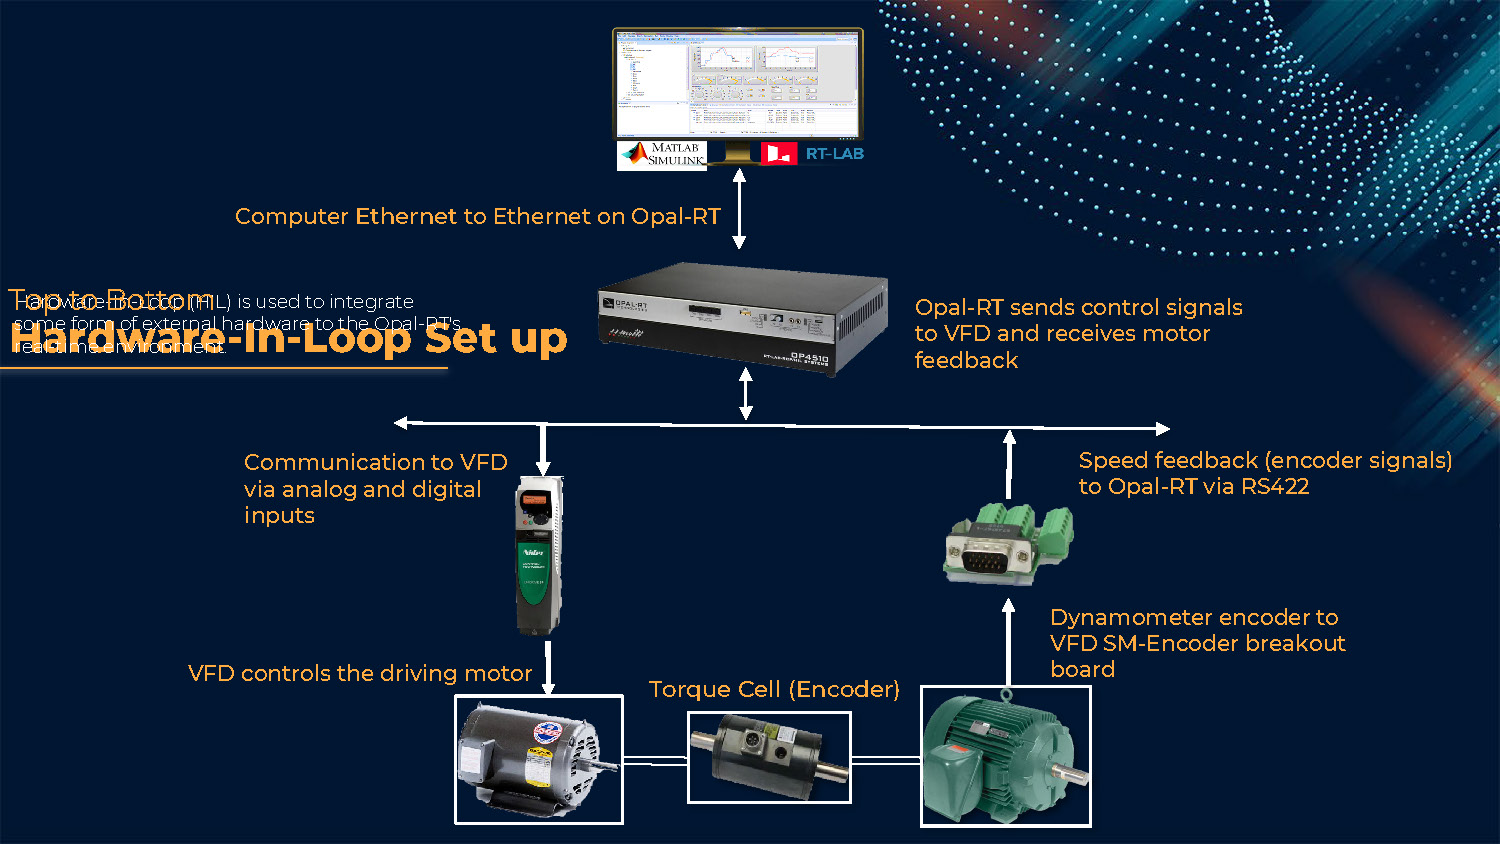
Top to Bottom Hardware-In-Loop Set up
Speed feedback (encoder signals) to Opal-RT via RS422
Computer Ethernet to Ethernet on Opal-RT
VFD controls the driving motor
Communication to VFD via analog and digital inputs
Dynamometer encoder to VFD SM-Encoder breakout board
Torque Cell (Encoder)
Opal-RT sends control signals to VFD and receives motor feedback
Hardware-In-Loop (HIL) is used to integrate some form of external hardware to the Opal-RT's real-time environment.
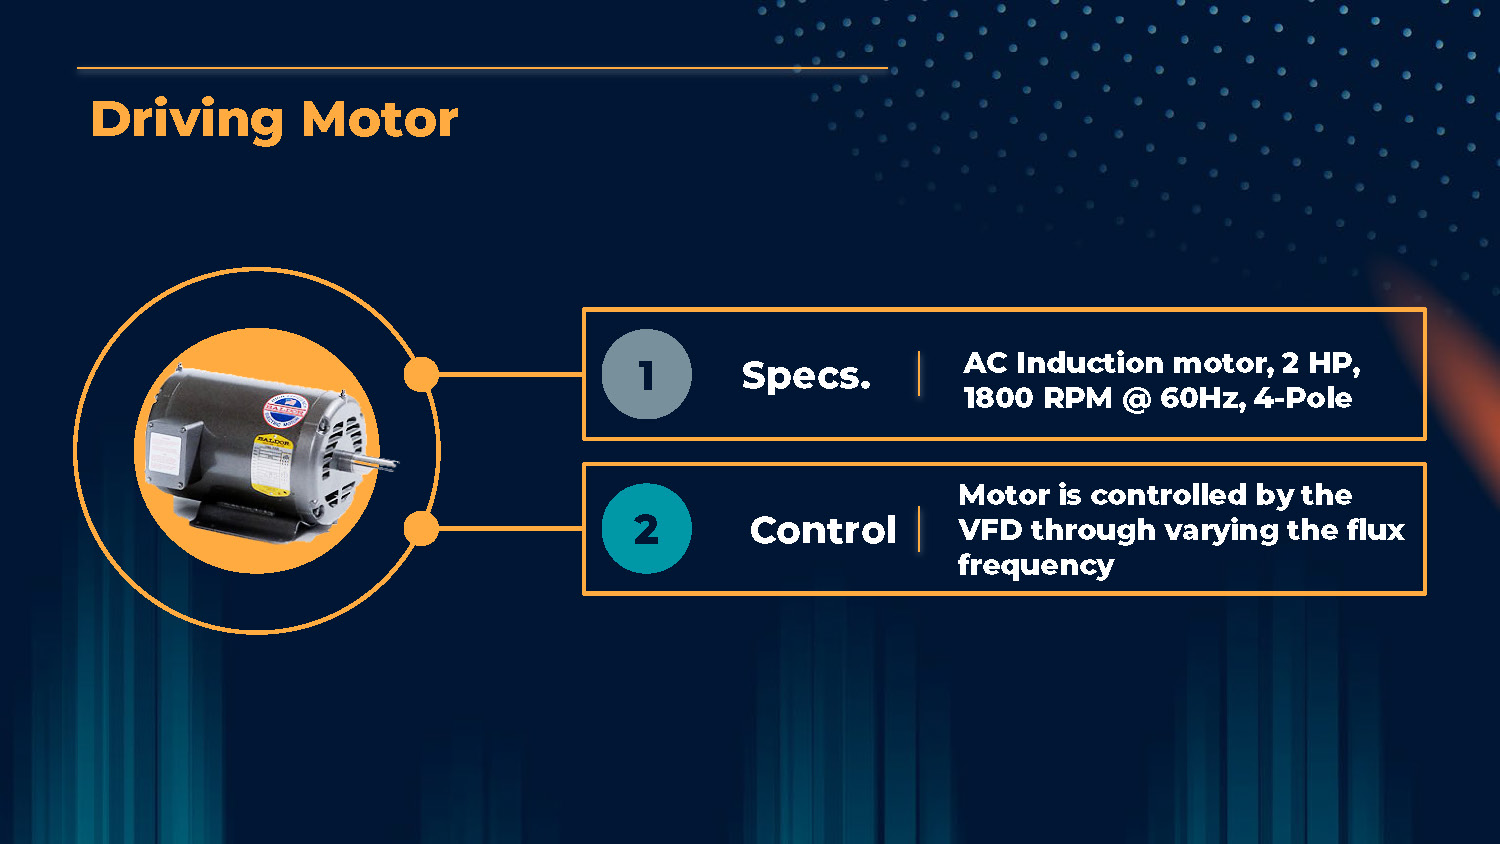
Driving Motor
Specs.
AC Induction motor, 2 HP, 1800 RPM @ 60Hz, 4-Pole
Control
Motor is controlled by the VFD through varying the flux frequency
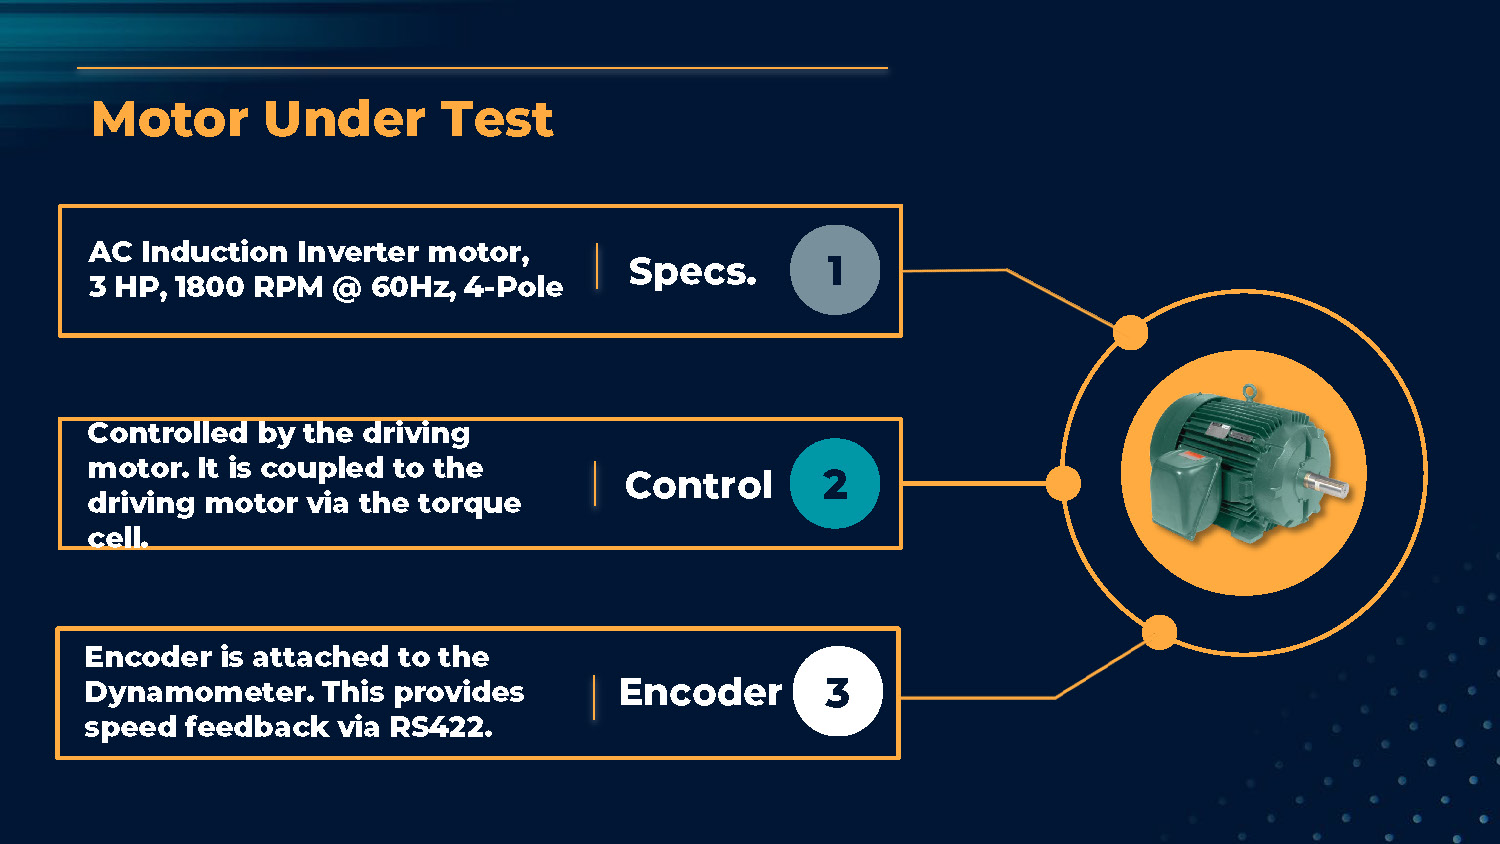
Motor Under Test
Specs.
AC Induction Inverter motor, 3 HP, 1800 RPM @ 60Hz, 4-Pole
Control
Controlled by the driving motor. It is coupled to the driving motor via the torque cell.
Encoder
Encoder is attached to the Dynamometer. This provides speed feedback via RS422.
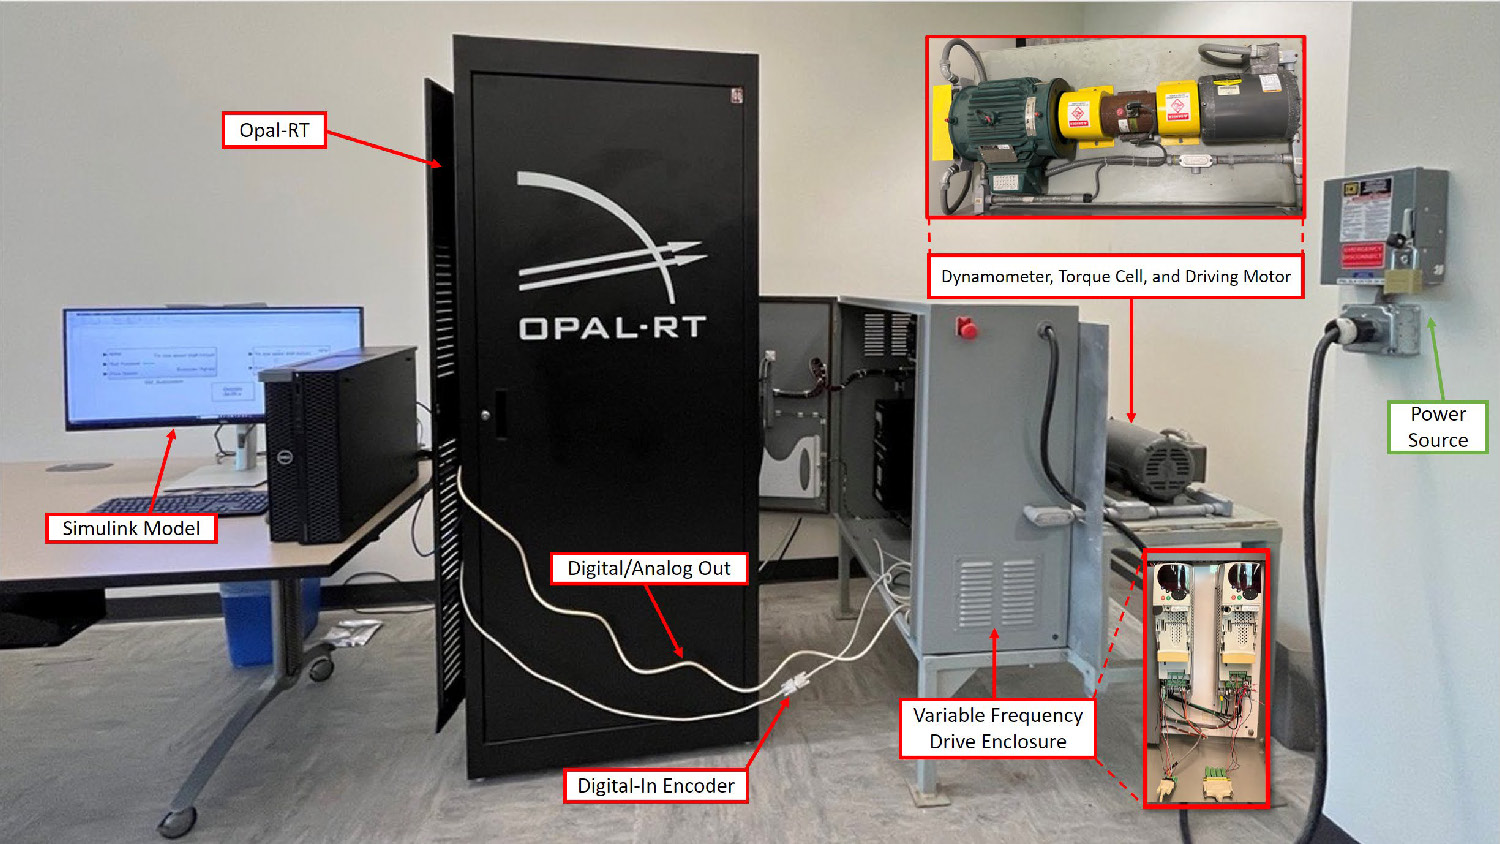
This image shows a laboratory setup. A tall, black cabinet labeled "OPAL-RT" is at the center. To its left, a desk with a Dell computer monitor and keyboard is labeled "Simulink Model." To the right of the cabinet is a grey-and-black machine labeled "Variable Frequency Drive Enclosure." A close-up of the internal components of this enclosure is shown in a red-bordered box. Another red-bordered box at the top right shows a close-up of machinery labeled "Dynamometer, Torque Cell, and Driving Motor." A green-bordered box points to an electrical outlet on the wall, labeled "Power Source." White cables connect the "Opal-RT" cabinet to the "Variable Frequency Drive Enclosure," with labels indicating "Digital-In Encoder" and "Digital/Analog Out."

Test Run Results
This slide shows a dark background with the words 'Test Run Results' in white text.
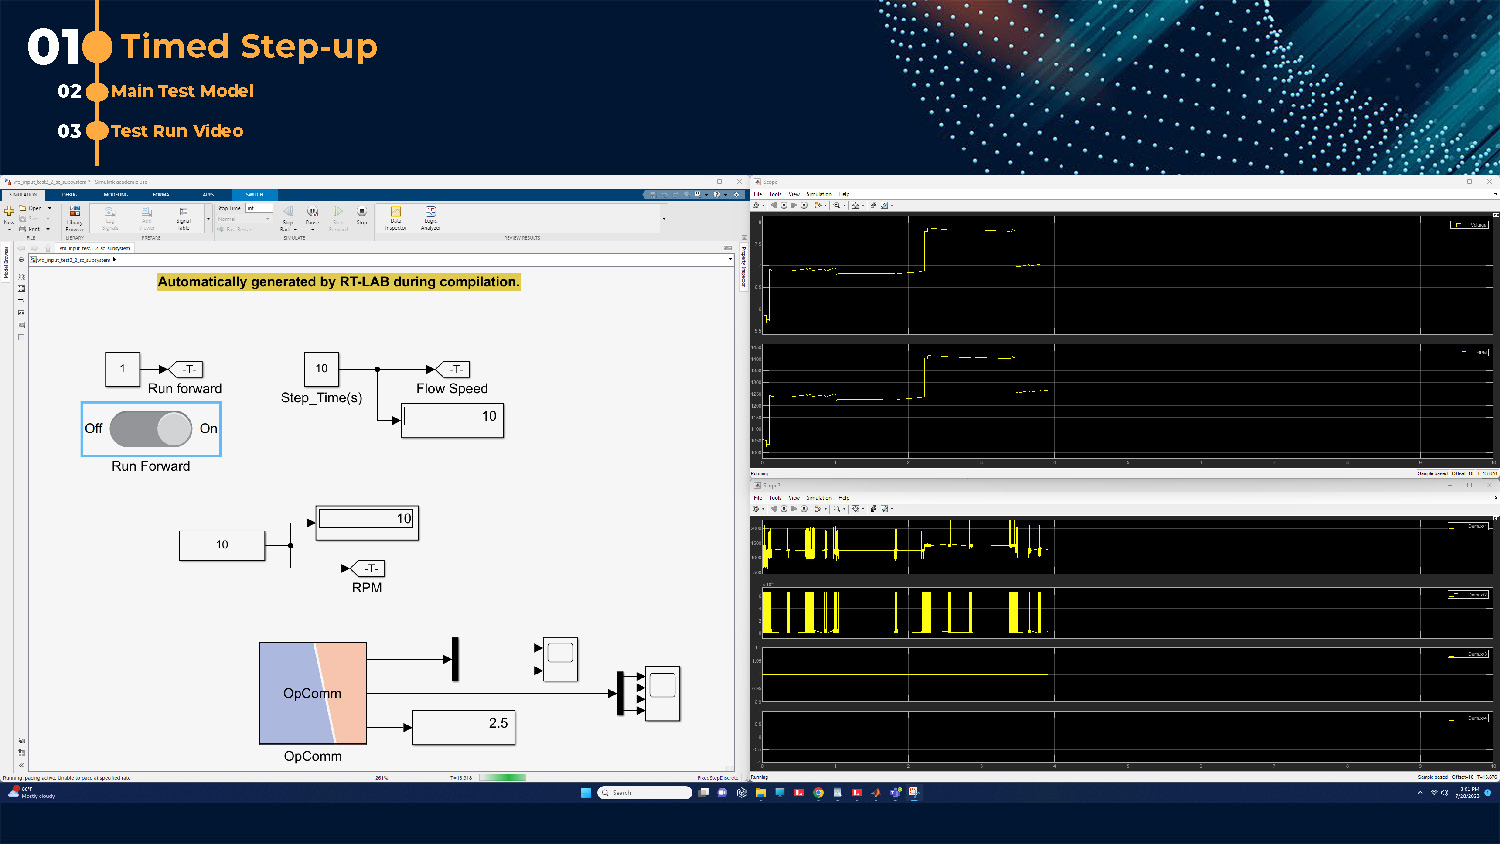
01 Timed Step-up
The image shows a split-screen view. The left side displays a diagram in a software interface, with blocks for "Run Forward," "Step_Time(s)," and "Flow Speed," along with an "On/Off" toggle switch and an "OpComm" block. Text at the top of this diagram reads, "Automatically generated by RT-LAB during compilation." The right side of the screen shows four separate black plots with yellow lines and data points over time. The background is dark blue with a dotted pattern, and a list on the top left indicates "01 Timed Step-up," "02 Main Test Model," and "03 Test Run Video."
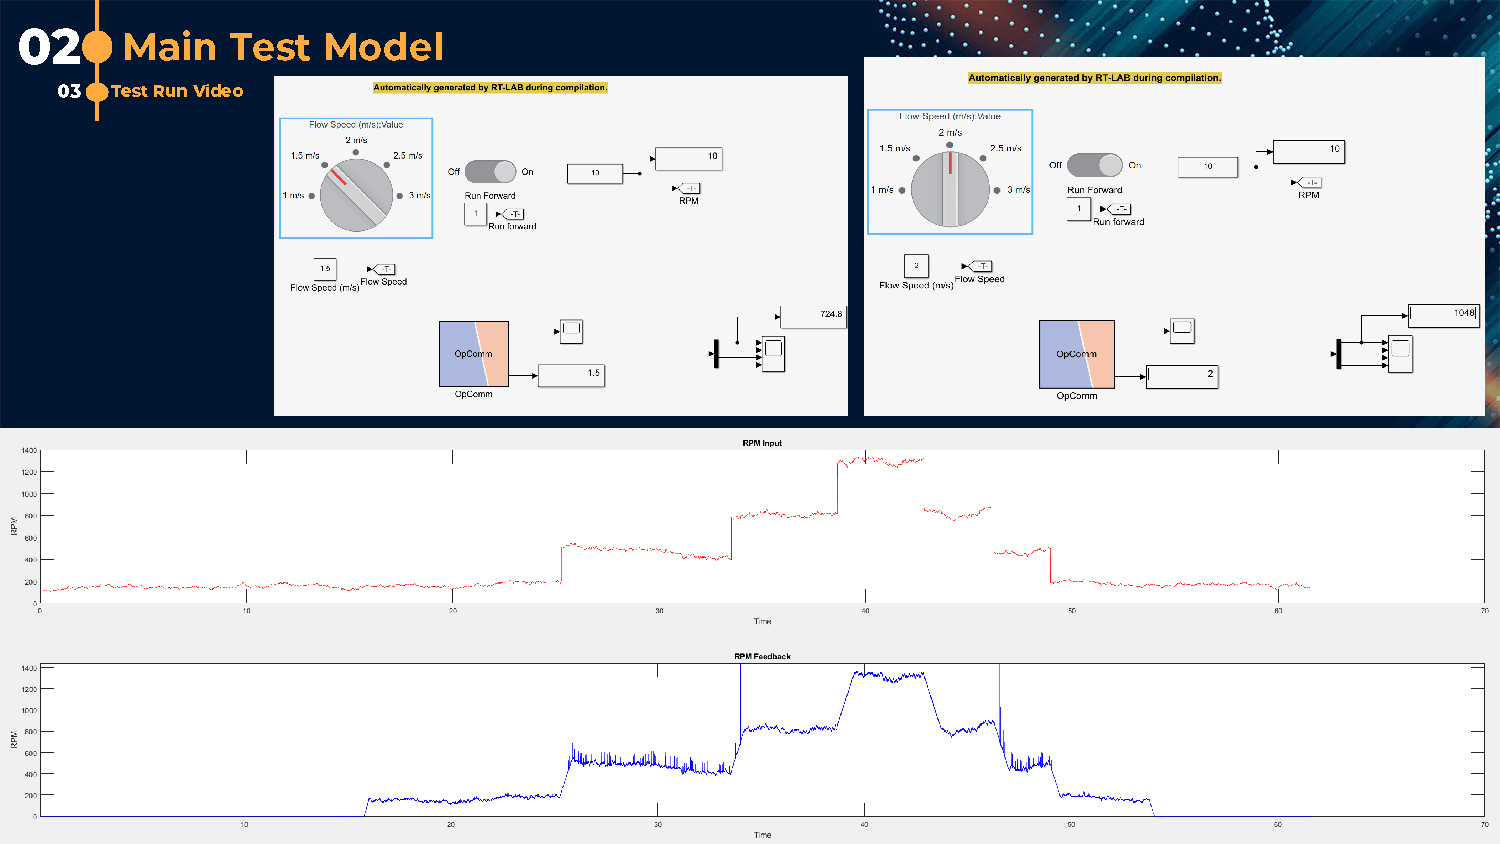
02 Main Test Model
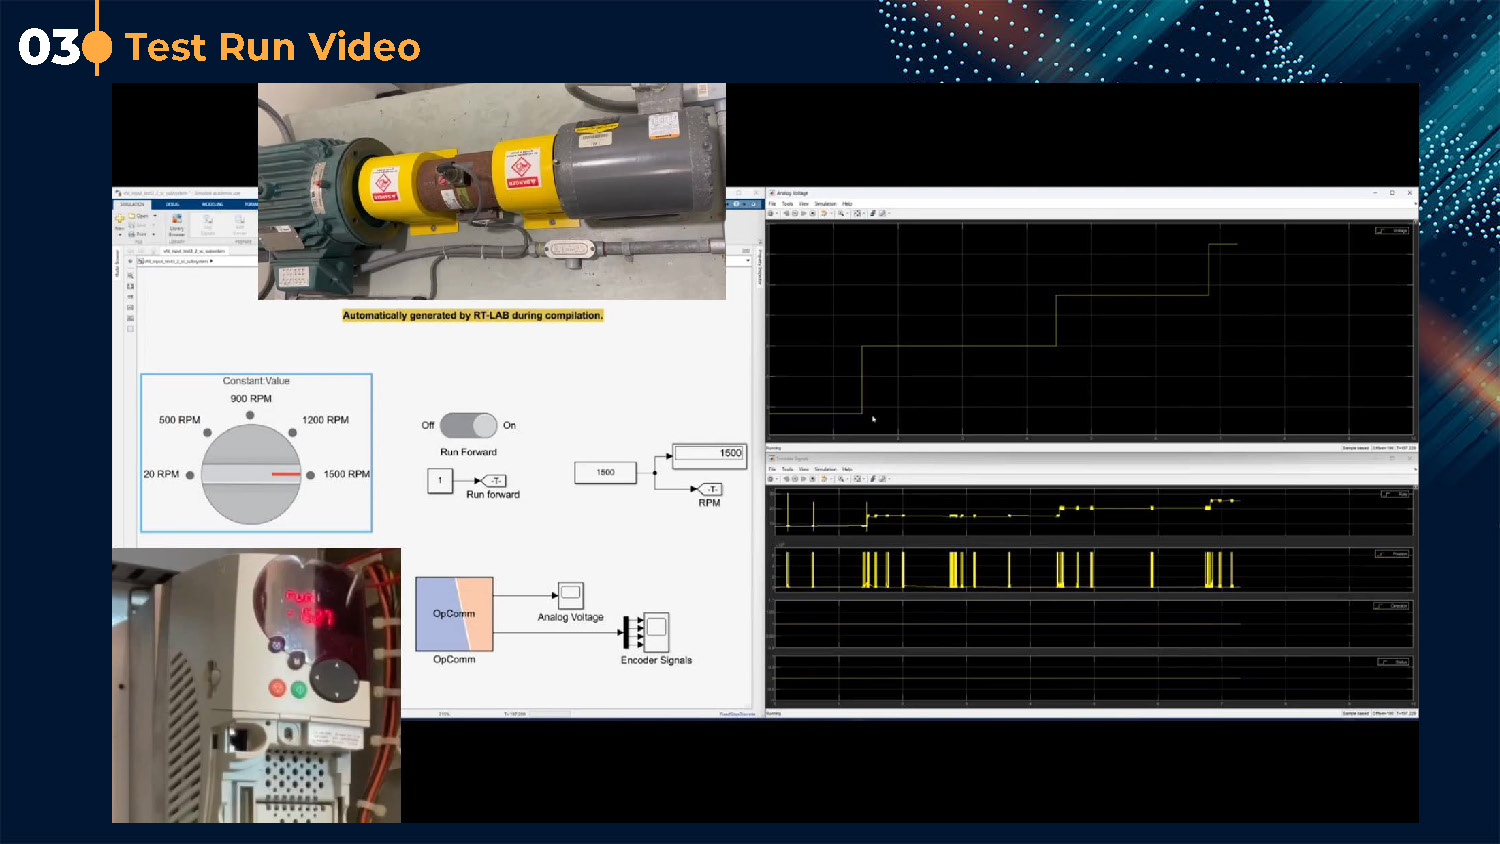
Test Run Video
The image is split into a top and bottom section. The top section shows two identical diagrams with circular dials labeled "Flow Speed (m/s) Value," "On/Off" toggles, and "RPM" readouts. The text "Automatically generated by RT-LAB during compilation" appears above both diagrams. The bottom section contains two large plots. The top plot shows a red line graph labeled "RPM Input" with RPM on the y-axis and Time on the x-axis. The bottom plot shows a blue line graph labeled "RPM Feedback" with RPM on the y-axis and Time on the x-axis.
Test Run Video
Main Test Model
The image shows a multi-part layout. The top section displays a video still of a yellow-and-black motor setup. Below this, there is a software interface with diagrams and controls. A circular dial is labeled "Constant Value" with various RPM values, and there's an "On/Off" toggle switch and an "OpComm" block. Below this, a portion of a physical control panel with a red digital readout is visible. The right side of the screen displays three separate black plots with yellow and blue lines, showing data over time.

Next Steps
Thank You!

End of Presentation
Click the right arrow to return to the beginning of the slide show.
For a downloadable version of this presentation, email: I-SENSE@FAU.