Graph Learning for Network Data
Mentors: Dr. Xingquan Zhu and Yufei Jin
Student: Richard Gao
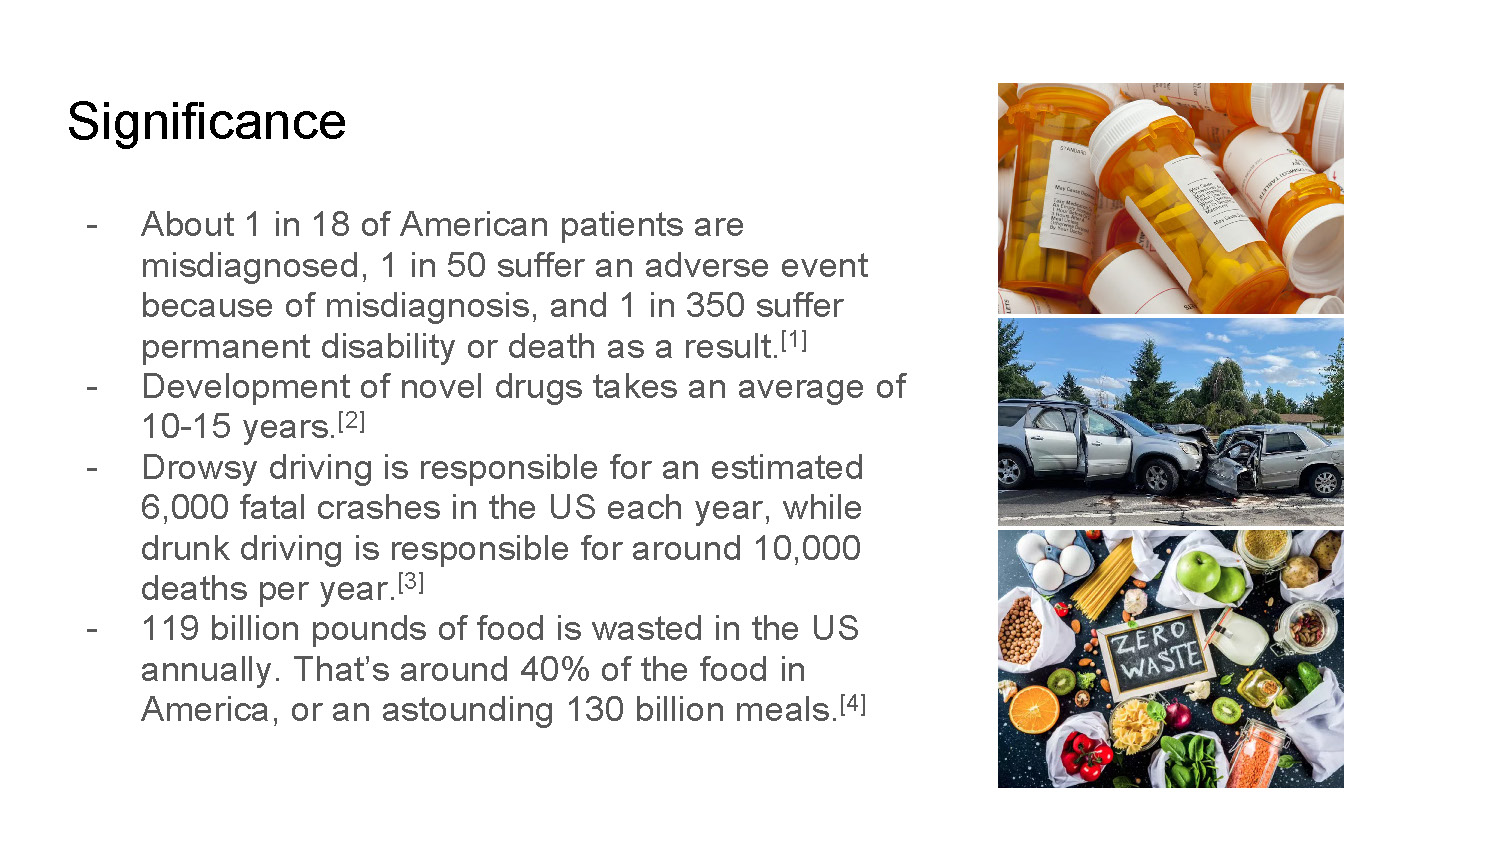
Significance
- About 1 in 18 of American patients are misdiagnosed, 1 in 50 suffer an adverse event because of misdiagnosis, and 1 in 350 suffer permanent disability or death as a result.[1]
- Development of novel drugs takes an average of 10-15 years.[2]
- Drowsy driving is responsible for an estimated 6,000 fatal crashes in the US each year, while drunk driving is responsible for around 10,000 deaths per year.[3]
- 119 billion pounds of food is wasted in the US annually. That’s around 40% of the food in America, or an astounding 130 billion meals.[4]
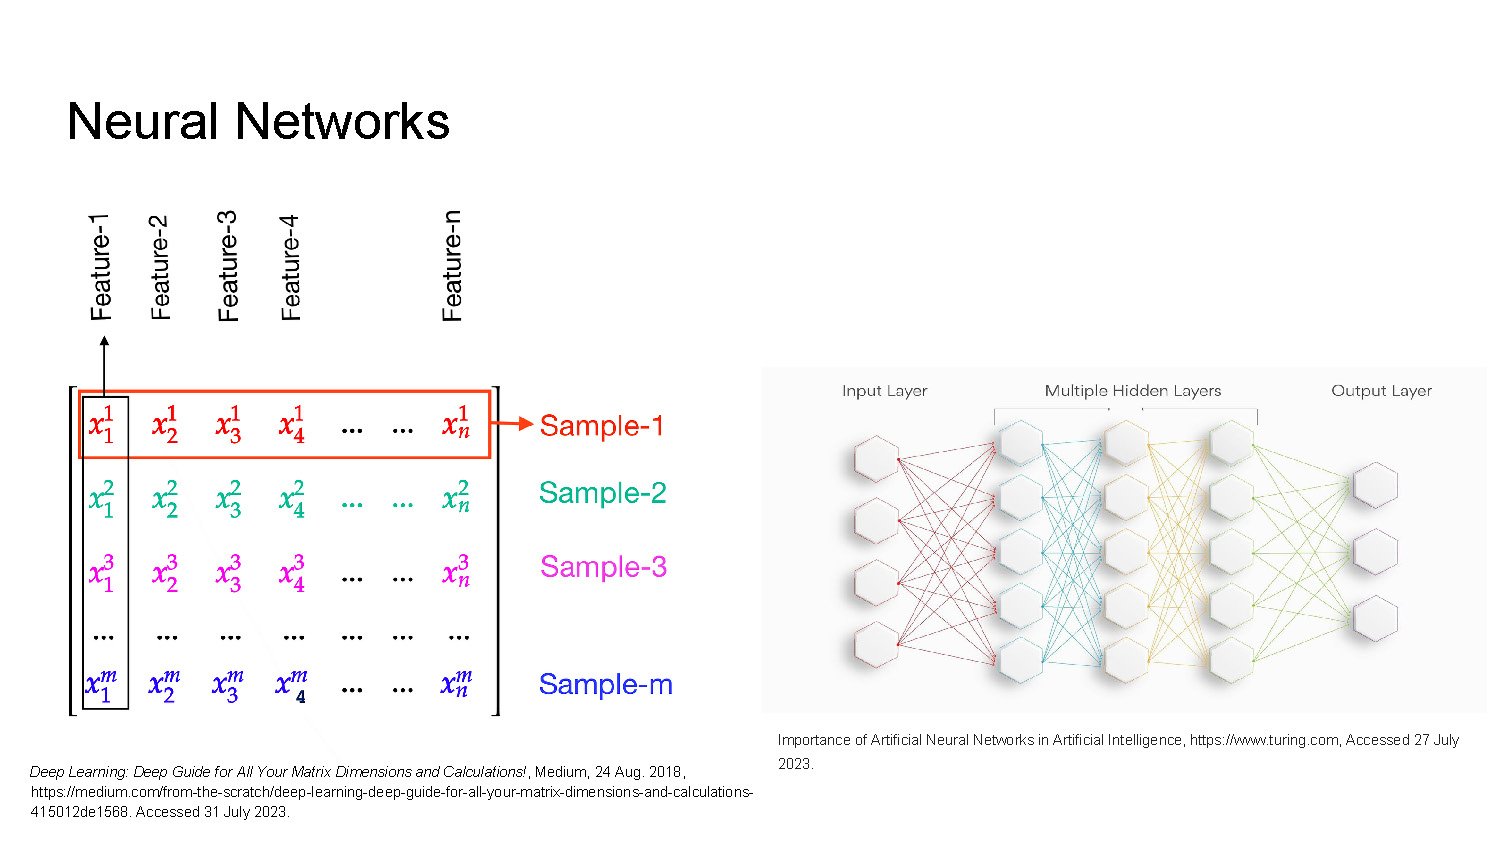
Neural Networks
The left side features a matrix with columns labeled "Feature-1" to "Feature-n" and rows labeled "Sample-1" to "Sample-m."
Deep Learning: Deep Guide for All Your Matrix Dimensions and Calculations!, Medium, 24 Aug. 2018, https://medium.com/from-the-scratch/deep-learning-deep-guide-for-all-your-matrix-dimensions-and-calculations-415012de1568. Accessed 31 July 2023.
The right side displays a schematic diagram of a neural network with an "Input Layer," "Multiple Hidden Layers," and an "Output Layer." Each layer is composed of interconnected hexagons in various colors.
Importance of Artificial Neural Networks in Artificial Intelligence, https://www.turing.com, Accessed 27 July 2023.
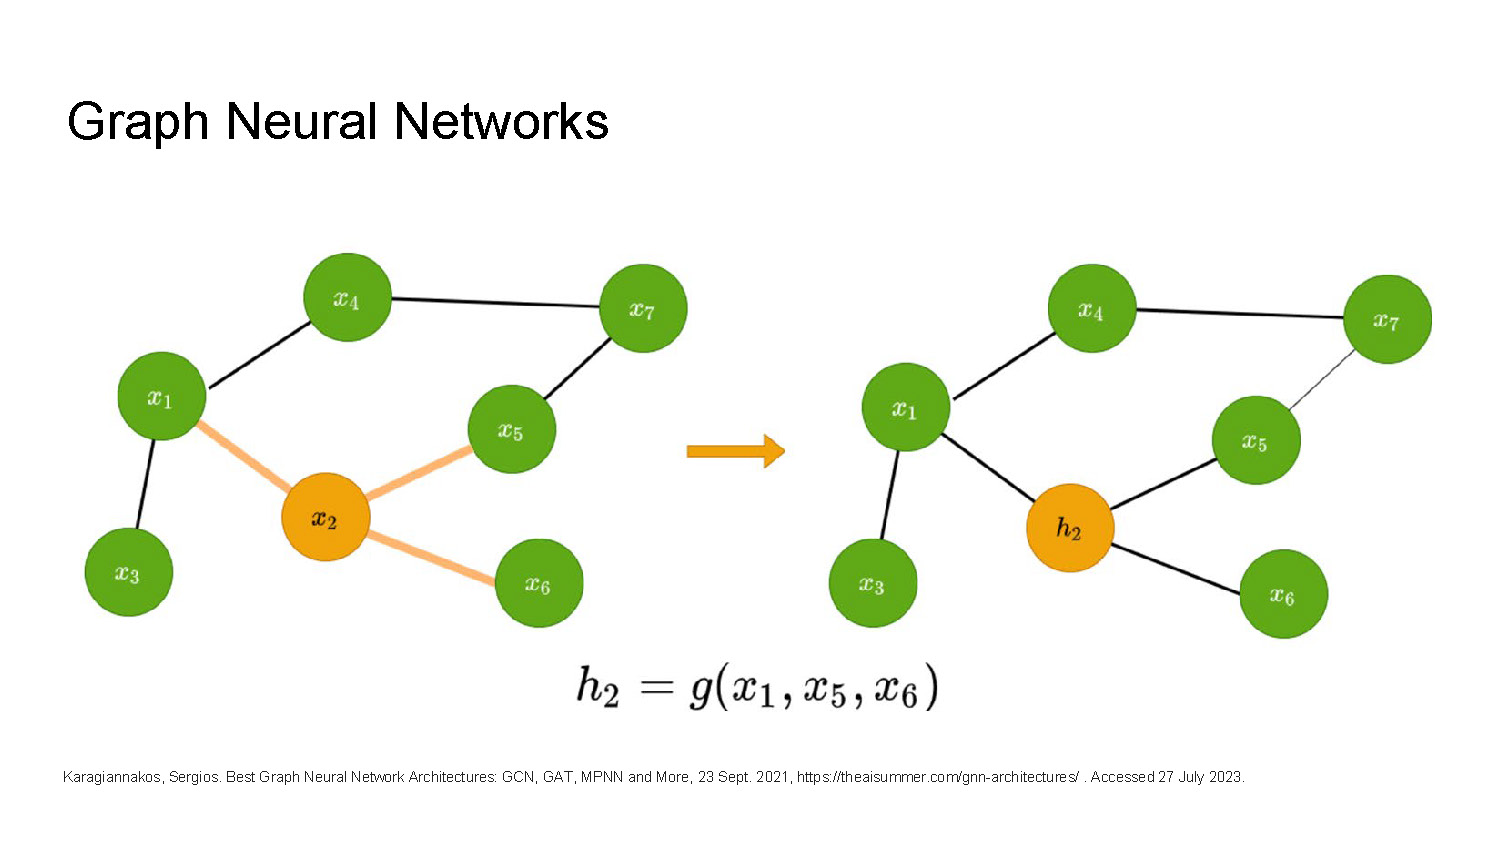
Graph Neural Networks
The slide shows two diagrams of connected green and orange circles, with lines representing connections. The diagram on the left has one orange circle labeled "x2" connected to two green circles, "x5" and "x6," by highlighted lines. An orange arrow points from the left diagram to the right. The diagram on the right shows a similar structure, but the orange circle is now labeled "h2." A mathematical formula, "$$h_2 = g(x_1, x_5, x_6)$$," is written below the diagrams.
Karagiannakos, Sergios. Best Graph Neural Network Architectures: GCN, GAT, MPNN and More, 23 Sept. 2021, https://theaisummer.com/gnn-architectures/ . Accessed 27 July 2023.
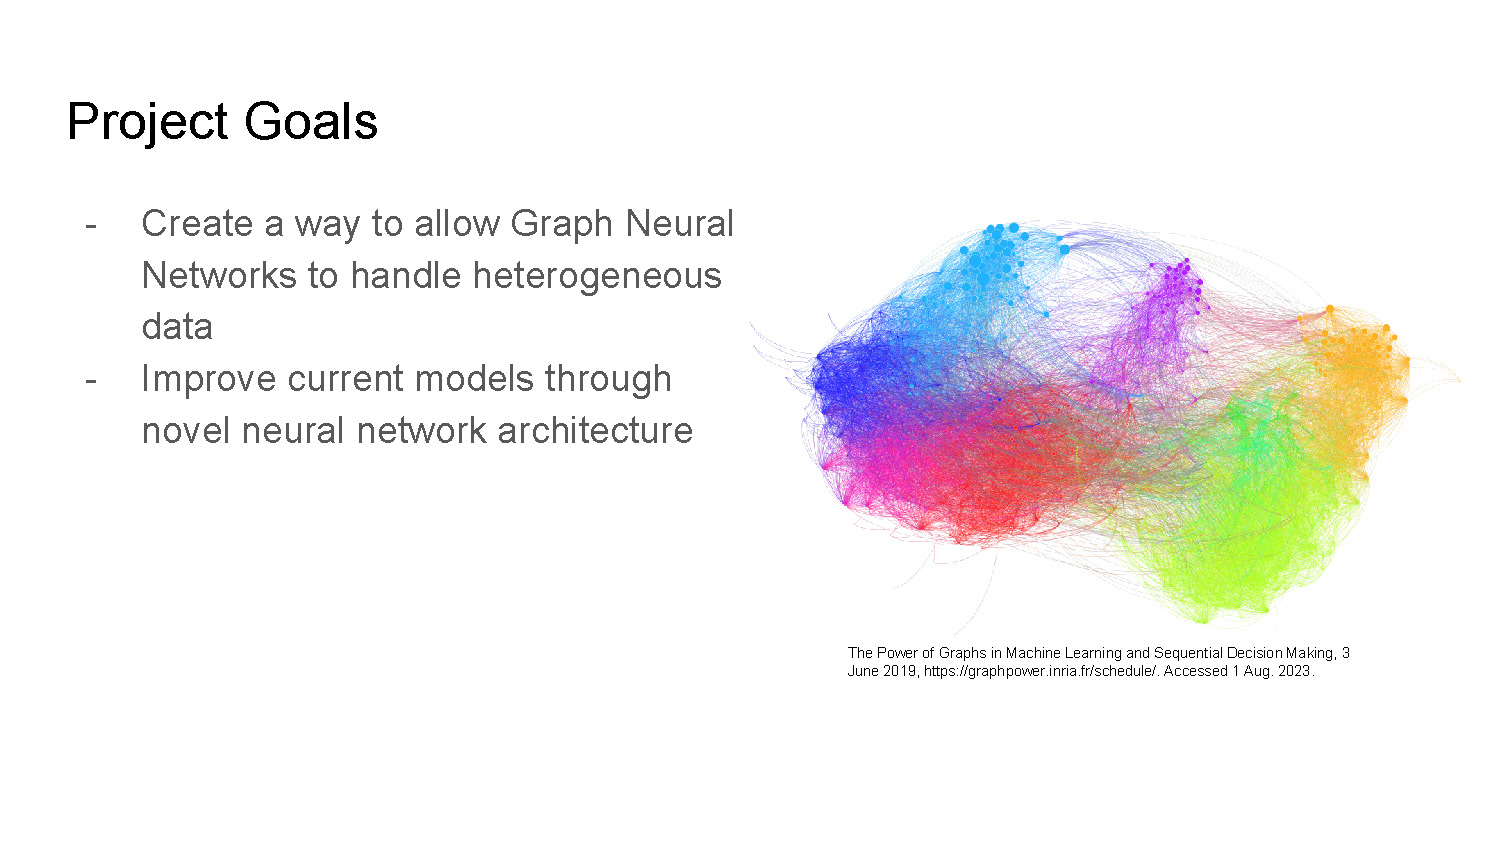
Project Goals
- Create a way to allow Graph Neural Networks to handle heterogeneous data
- Improve current models through novel neural network architecture
The Power of Graphs in Machine Learning and Sequential Decision Making, 3 June 2019, https://graphpower.inria.fr/schedule/. Accessed 1 Aug. 2023.
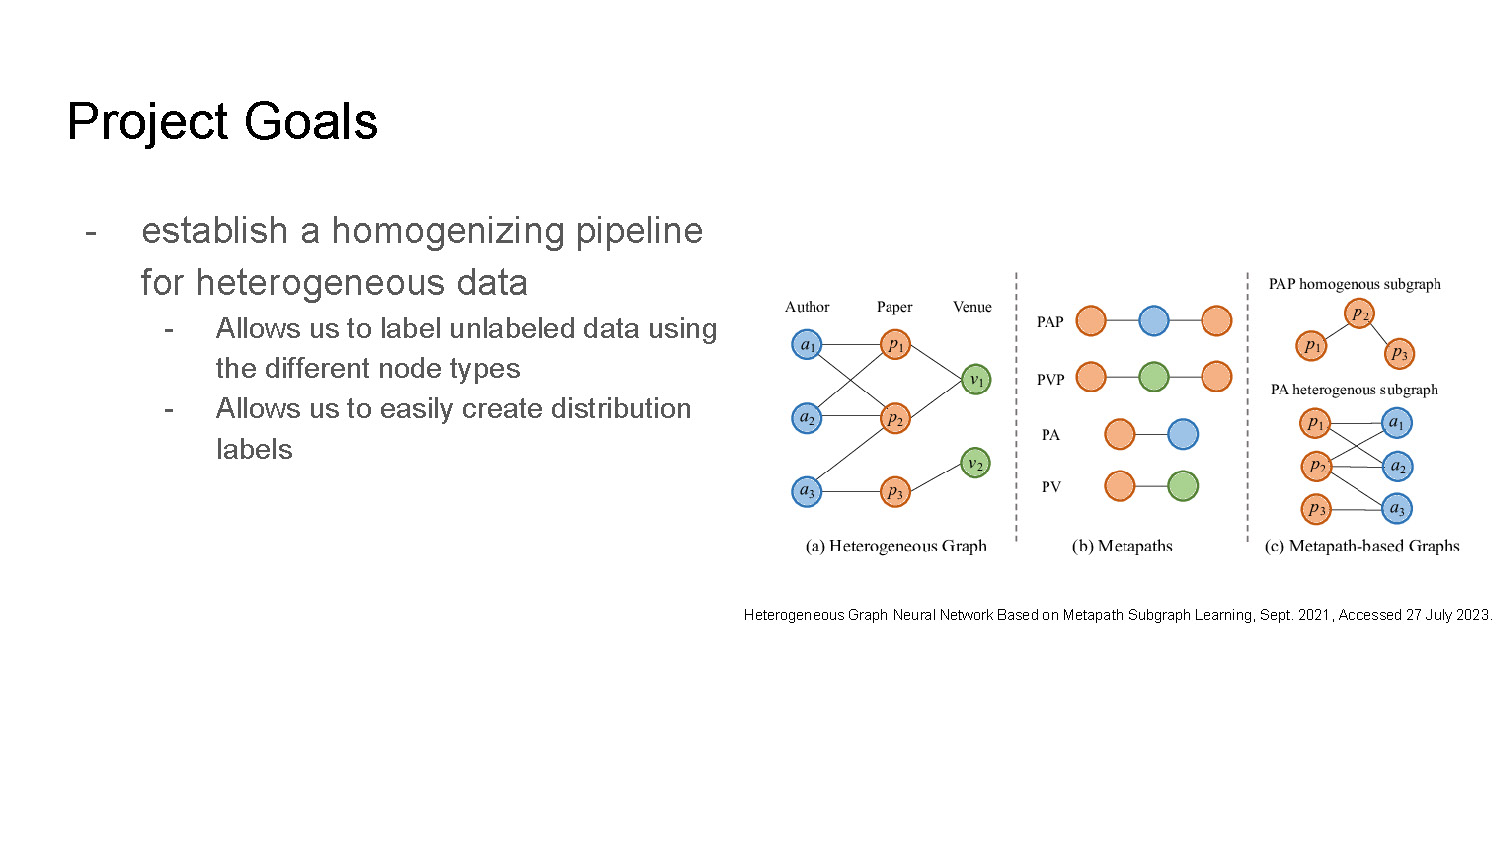
Project Goals
- establish a homogenizing pipeline for heterogeneous data
- Allows us to label unlabeled data using the different node types
- Allows us to easily create distribution labels
The slide shows three diagrams of connected circles labeled (a) "Heterogeneous Graph," (b) "Metapaths," and (c) "Metapath-based Graphs." The diagrams show circles with labels like "a_1," "p_1," and "v_1," connected by lines. Diagram (a) shows connections between "Author," "Paper," and "Venue" nodes. Diagram (c) shows "PAP homogeneous subgraph" and "PA heterogeneous subgraph."
Heterogeneous Graph Neural Network Based on Metapath Subgraph Learning, Sept. 2021, Accessed 27 July 2023.
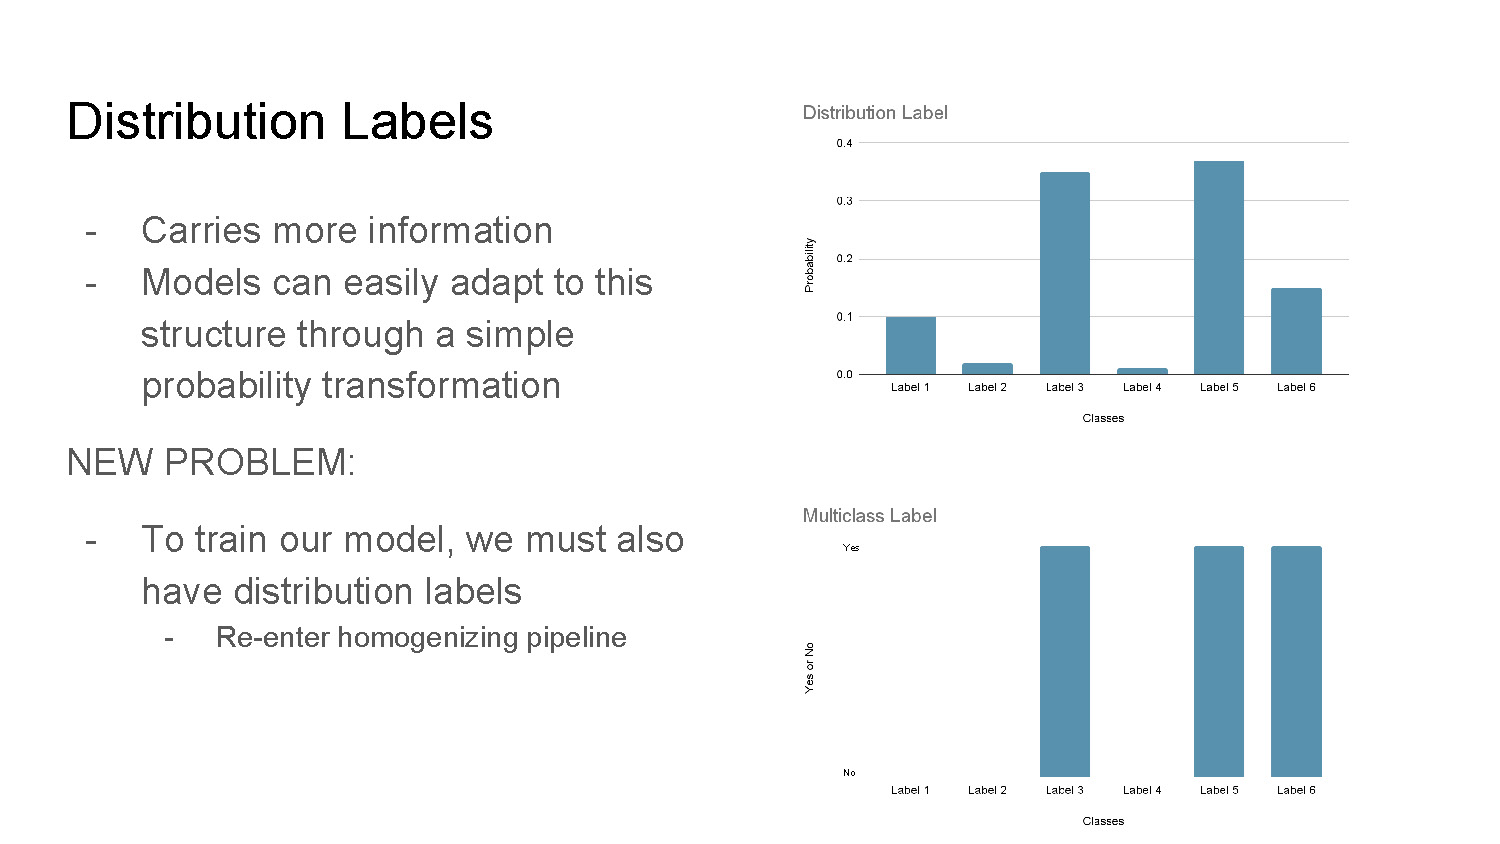
Distribution Labels
- Carries more information
- Models can easily adapt to this structure through a simple probability transformation
NEW PROBLEM:
- To train our model, we must also have distribution labels
- Re-enter homogenizing pipeline
The slide contains two bar charts. The top chart is titled "Distribution Label" and shows six blue bars with varying heights, labeled "Label 1" to "Label 6" on the x-axis and "Probability" on the y-axis. The bottom chart, titled "Multiclass Label," displays three blue bars of equal height at "Label 3," "Label 5," and "Label 6." The y-axis is labeled "Yes or No."
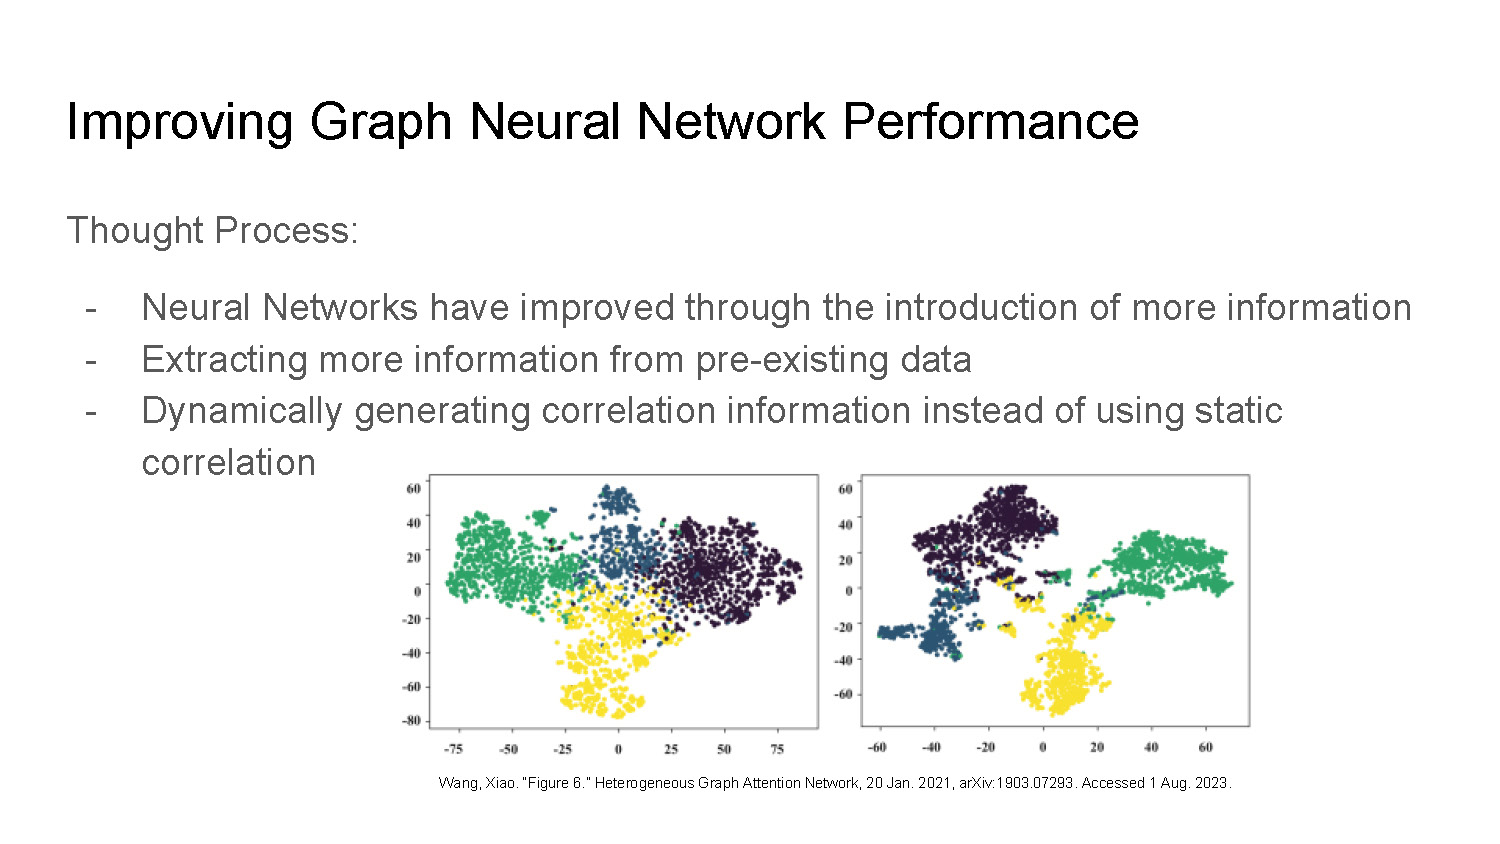
Improving Graph Neural Network Performance
Thought Process:
- Neural Networks have improved through the introduction of more information
- Extracting more information from pre-existing data
- Dynamically generating correlation information instead of using static correlation
Wang, Xiao. “Figure 6.” Heterogeneous Graph Attention Network, 20 Jan. 2021, arXiv:1903.07293. Accessed 1 Aug. 2023.
The bottom section of the slide shows two scatter plots side-by-side. Both plots have clusters of colored dots (green, yellow, and blue/purple) and are labeled with numbers on the x and y axes. The clusters of dots show distinct groupings.
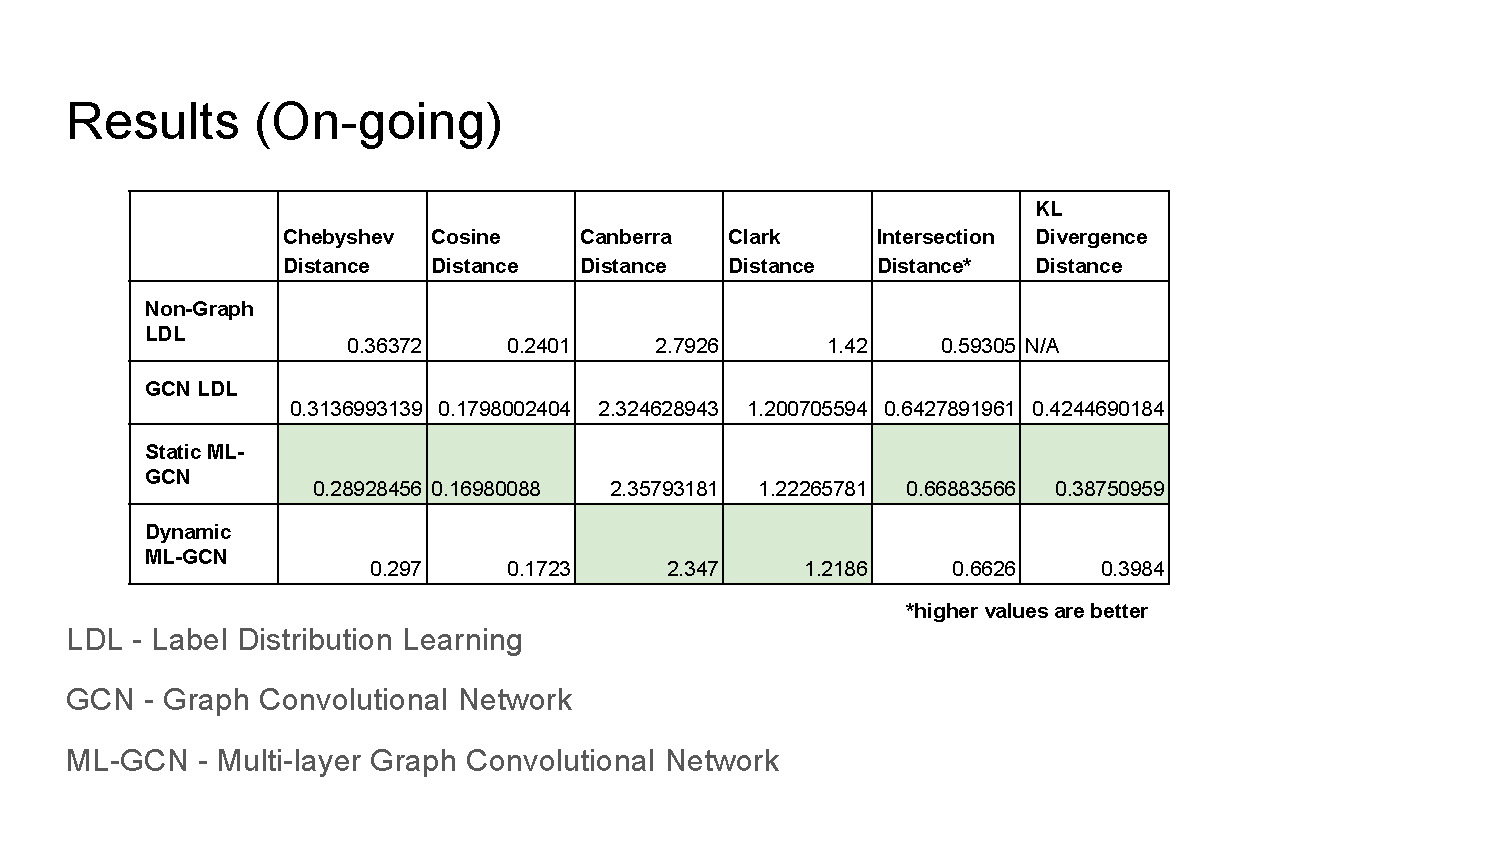
Results (On-going)
| Chebyshev Distance | Cosine Distance | Canberra Distance | Clark Distance | Intersection Distance* | KL Divergence Distance | |
|---|---|---|---|---|---|---|
| Non-Graph LDL | 0.36372 | 0.2401 | 2.7926 | 1.42 | 0.59305 | N/A |
| GCN LDL | 0.3136993139 | 0.1798002404 | 2.324628943 | 1.200705594 | 0.6427891961 | 0.4244690184 |
| Static ML-GCN | 0.28928456 | 0.16980088 | 2.35793181 | 1.22265781 | 0.66883566 | 0.38750959 |
| Dynamic ML-GCN | 0.297 | 0.1723 | 2.347 | 1.2186 | 0.6626 | 0.3984 |
*higher values are better
LDL - Label Distribution Learning
GCN - Graph Convolutional Network
ML-GCN - Multi-layer Graph Convolutional Network

Acknowledgements
Thanks to the I-SENSE Program for making this summer experience possible
Thanks to Dr. Zhu and Yufei Jin for guiding me throughout the summer
Citations
[1] - Newman-Toker DE. Diagnostic Errors in the Emergency Department: A Systematic Review. Comparative Effectiveness Review No. 258. Agency for Healthcare Research and Quality; December 2022. DOI: 10.23970/AHRQEPCCER258
[2] - Hughes JP, Rees S, Kalindjian SB, Philpott KL. Principles of early drug discovery. Br J Pharmacol. 2011 Mar;162(6):1239-49. doi: 10.1111/j.1476-5381.2010.01127.x. PMID: 21091654; PMCID: PMC3058157.
[3] - “Drunk Driving vs. Drowsy Driving vs. Distracted Driving.” Meirowitz & Wasserberg, LLP, 20 June 2023, www.samndan.com/drunk-vs-drowsy-vs-distracted-driving/.
[4] - “Food Waste and Food Rescue.” Feeding America, www.feedingamerica.org/our-work/reduce-food-waste. Accessed 1 Aug. 2023.
Geng, Xin, and Rongzi Ji. “Label Distribution Learning.” 2013 IEEE 13th International Conference on Data Mining Workshops, 2013, https://doi.org/10.1109/icdmw.2013.19.
Shi, Min, et al. “MLNE: Multi-Label Network Embedding.” IEEE Transactions on Neural Networks and Learning Systems, vol. 31, no. 9, Sept. 2020, pp. 3682–95. IEEE Xplore, https://doi.org/10.1109/TNNLS.2019.2945869.
Wang, Xiao, et al. Heterogeneous Graph Attention Network. arXiv:1903.07293, arXiv, 20 Jan. 2021. arXiv.org, http://arxiv.org/abs/1903.07293.

End of Presentation
Click the right arrow to return to the beginning of the slide show.
For a downloadable version of this presentation, email: I-SENSE@FAU.