Bio Robotics: Wearable Prosthetics
Bio Robotics: Wearable Prosthetics
Presented by Jocelyn Daniel, Biotechnology, University of Central Florida
and Daniela Delgado,
Computer Science, Middlebury College
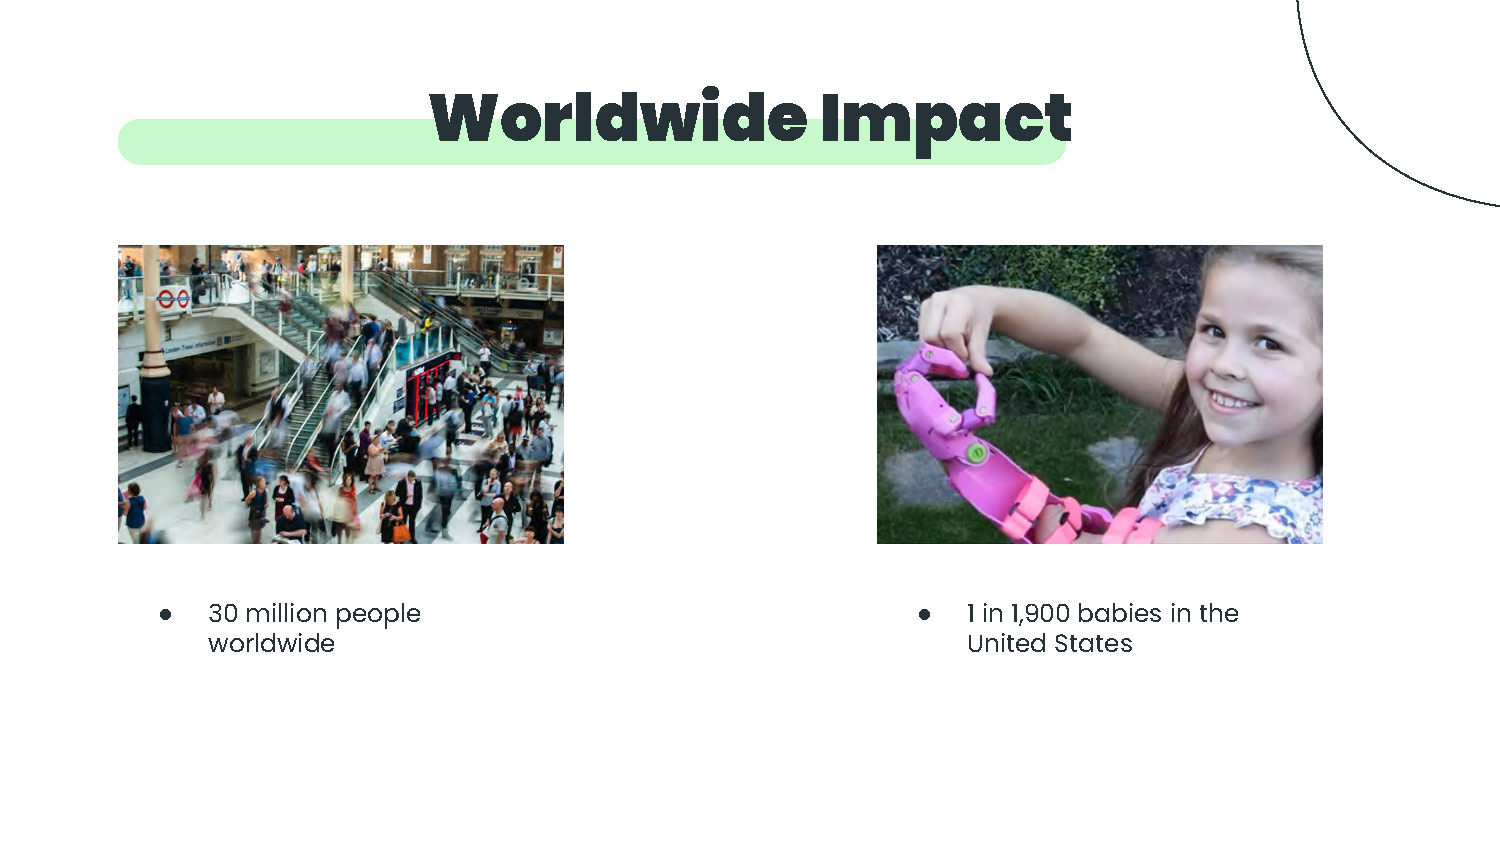
Worldwide Impact
- 30 million people worldwide
- 1 in 1,900 babies in the United States
Focused Impact
Create an economical and environmentally friendly wearable device that is up to date with today's technology
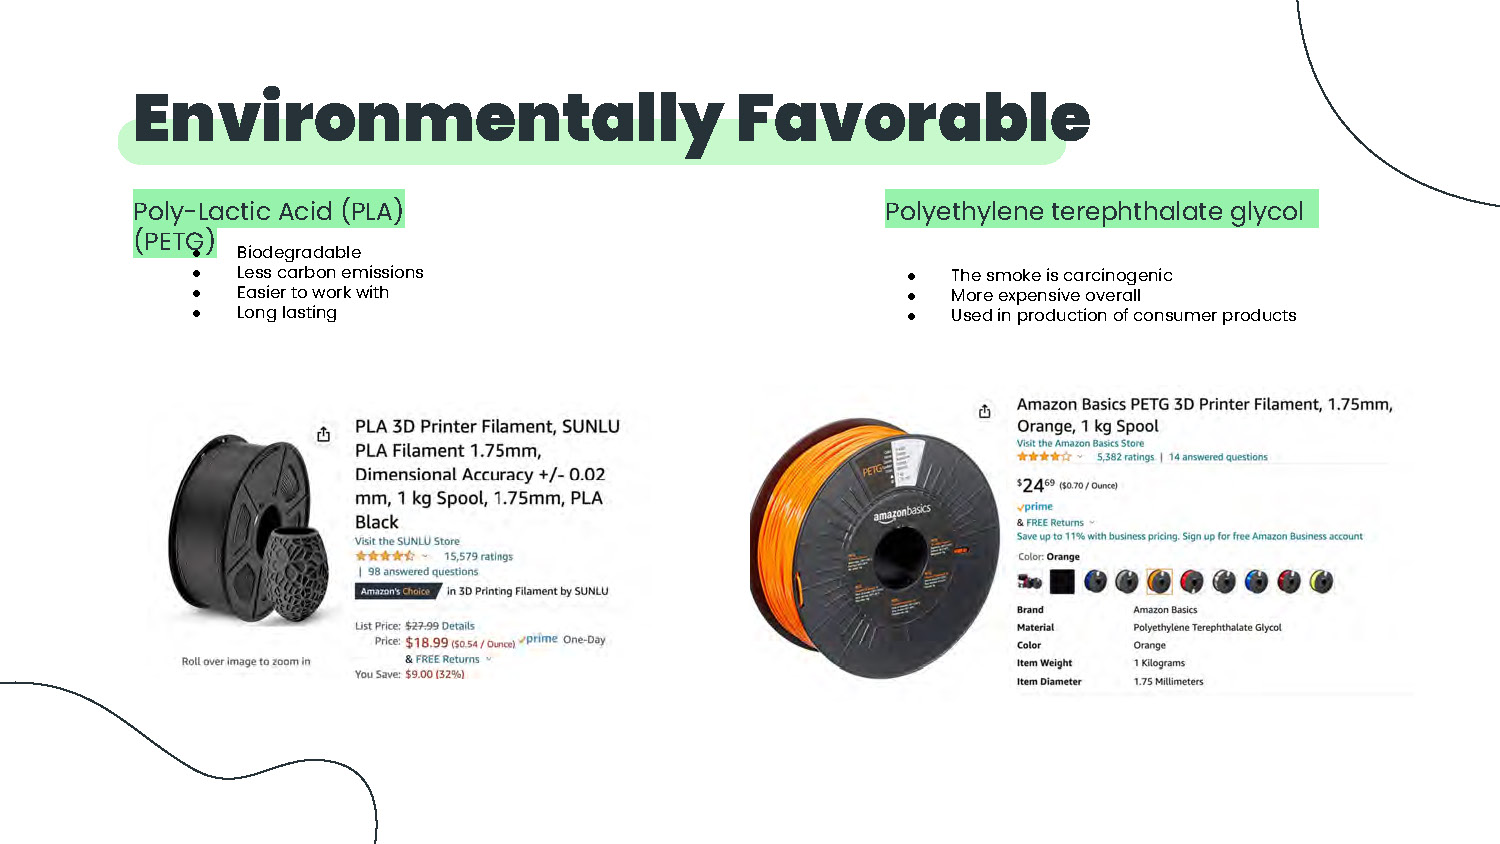
Environmentally Favorable
Poly-Lactic Acid (PLA)
- Biodegradable
- Less carbon emissions
- Easier to work with
Polyethylene terephthalate glycol (PETG)
- Long lasting
- The smoke is carcinogenic
- More expensive overall
- Used in production of consumer products
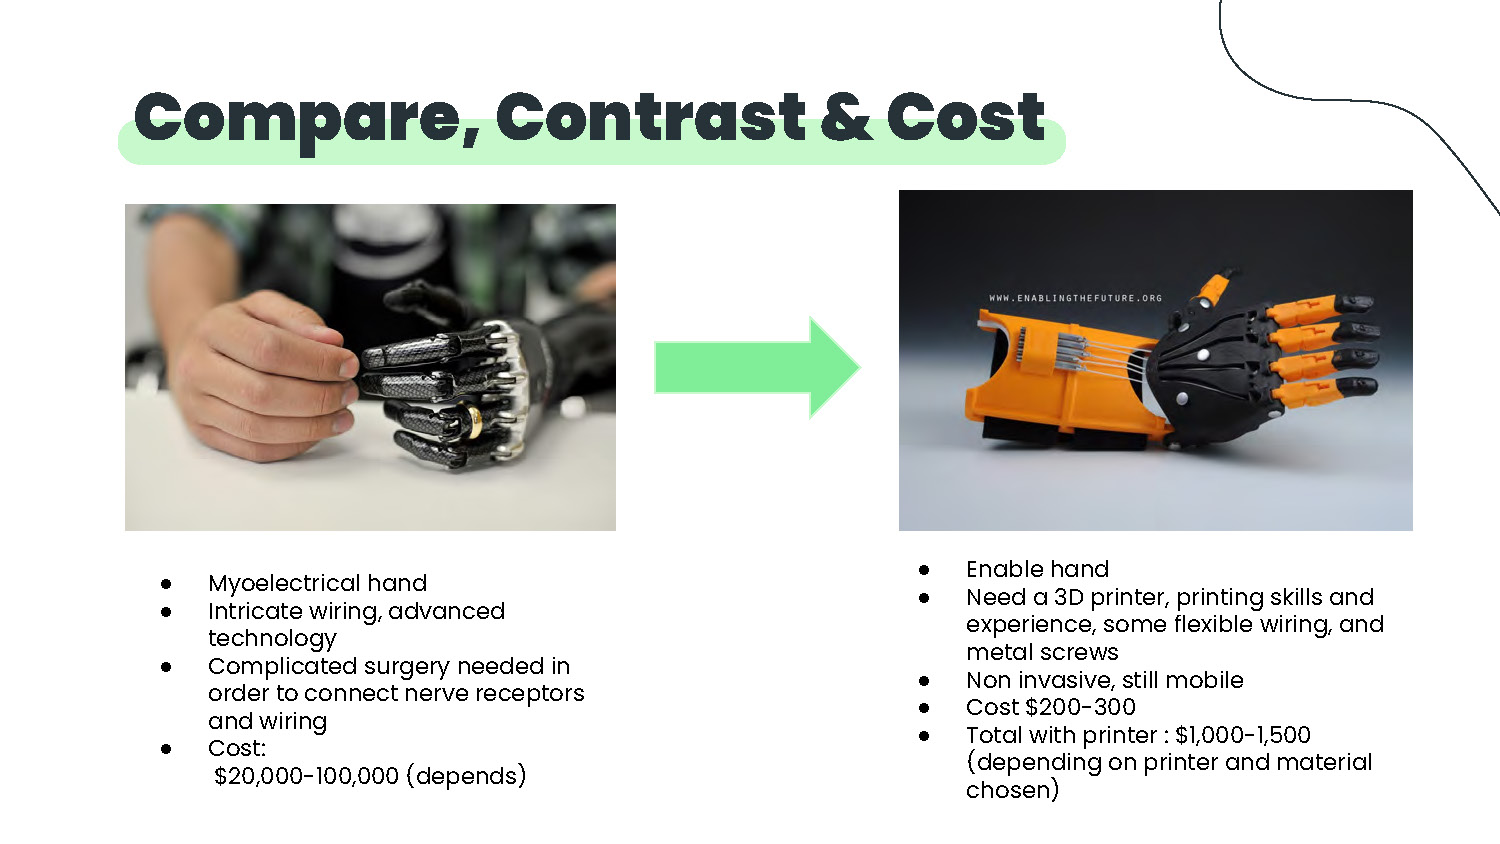
Compare, Contrast & Cost
Myoelectrical hand
- Intricate wiring, advanced technology
- Complicated surgery needed in order to connect nerve receptors and wiring
- Cost: $20,000-100,000 (depends)
Enable hand
- Need a 3D printer, printing skills and experience, some flexible wiring, and metal screws
- Non invasive, still mobile
- Cost $200-300
- Total with printer: $1,000-1,500 (depending on printer and material chosen)
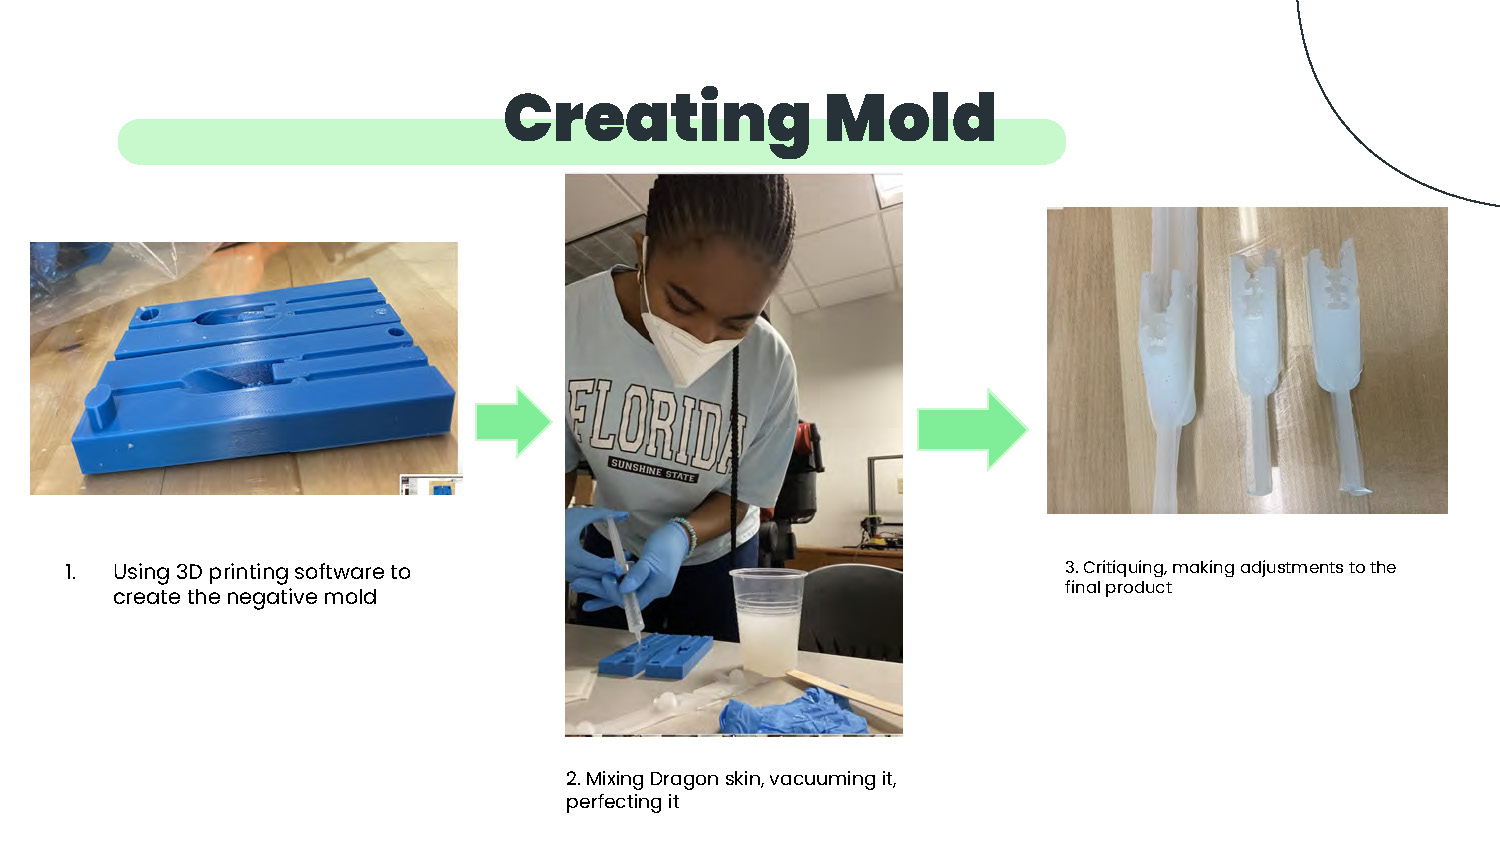
Creating Mold
- Using 3D printing software to create the negative mold
- Mixing Dragon skin, vacuuming it, perfecting it
- Critiquing, making adjustments to the final product
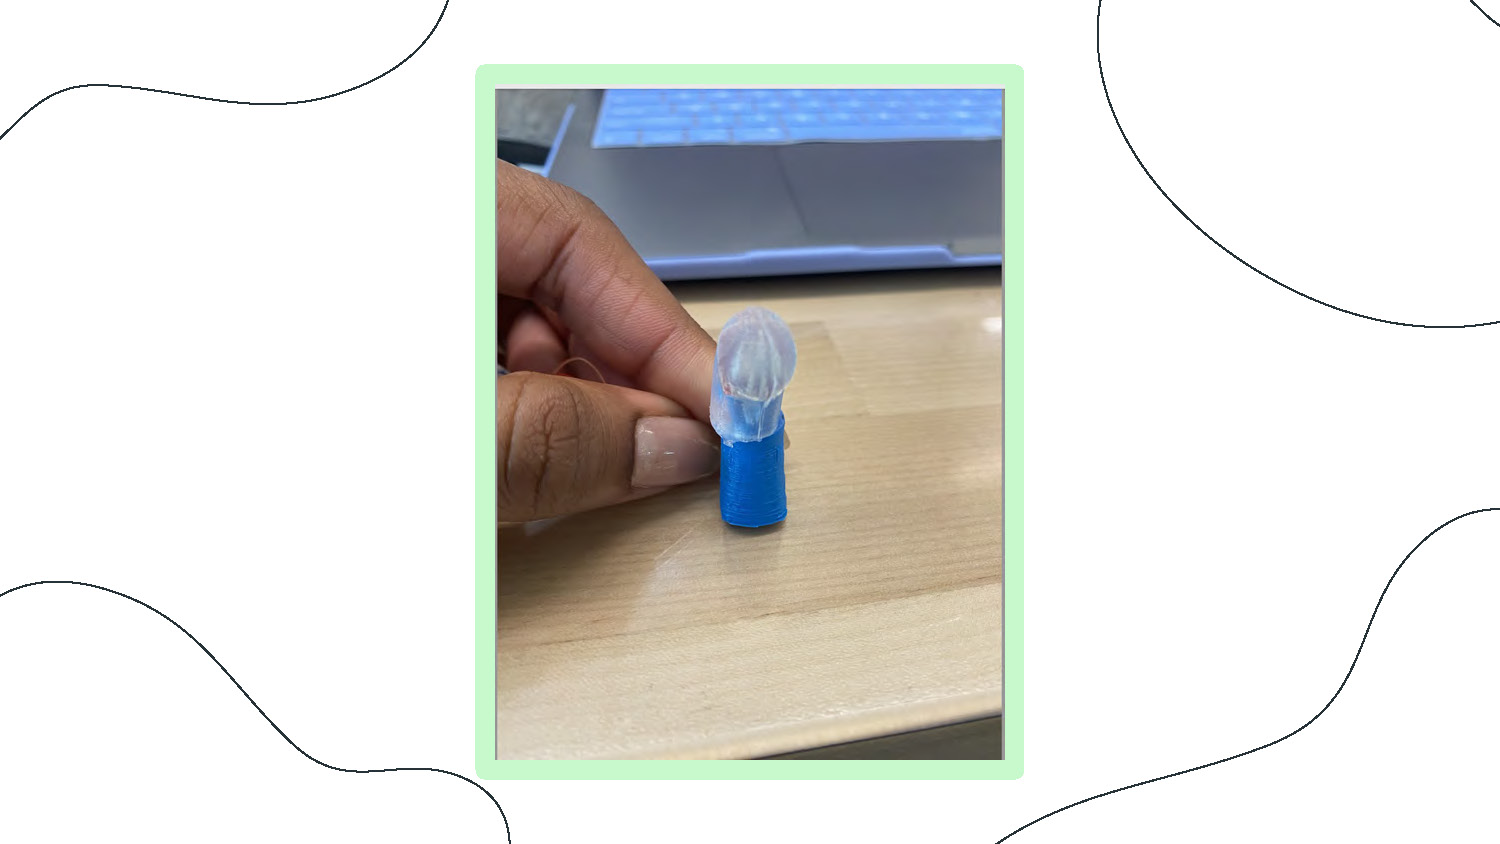
A person's hand with manicured fingernails holds a small, two-part object. The object consists of a translucent, frosted top piece shaped like a dome with a wavy bottom edge, and a solid blue cylindrical base. The hand is holding the blue base between the thumb and index finger. The object is positioned over a light-colored wooden surface, with a laptop keyboard and a black cord partially visible in the blurred background. The image is taken at a slight downward angle, focusing on the hand and the object.
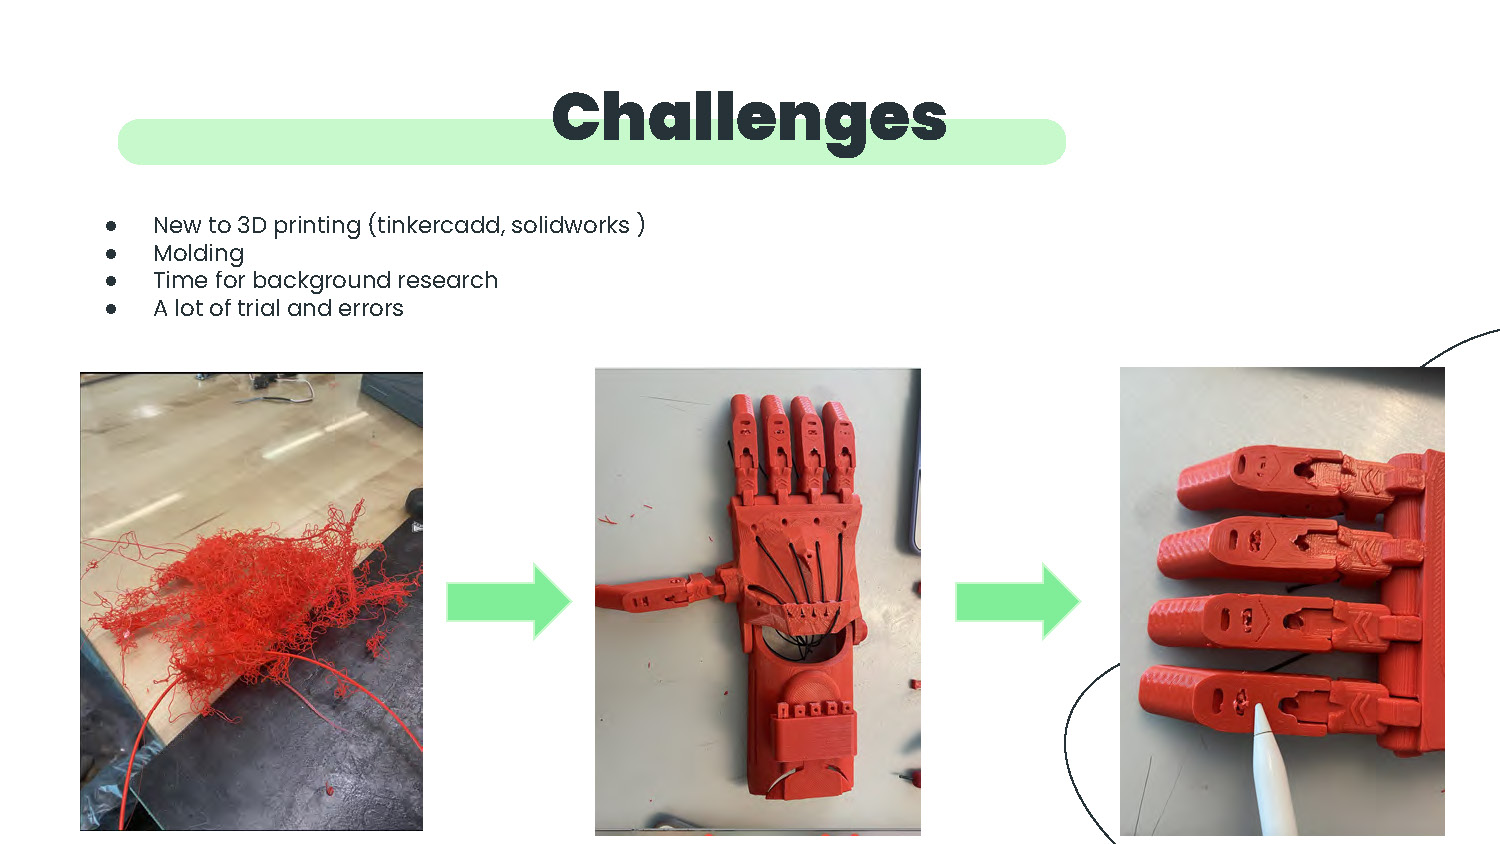
Challenges
- New to 3D printing (tinkercadd, solidworks)
- Molding
- Time for background research
- A lot of trial and errors
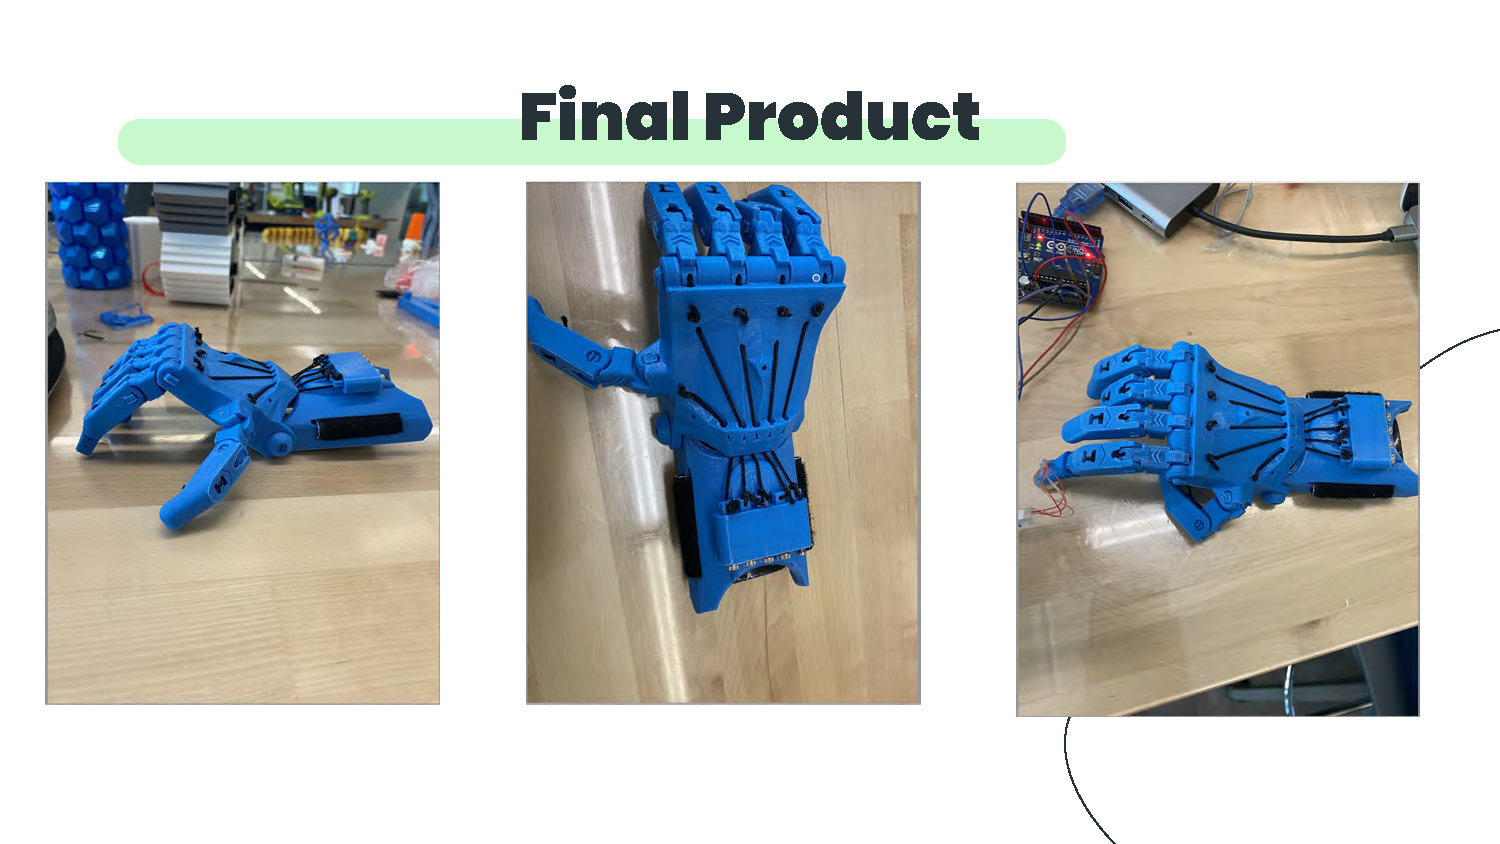
Final Product
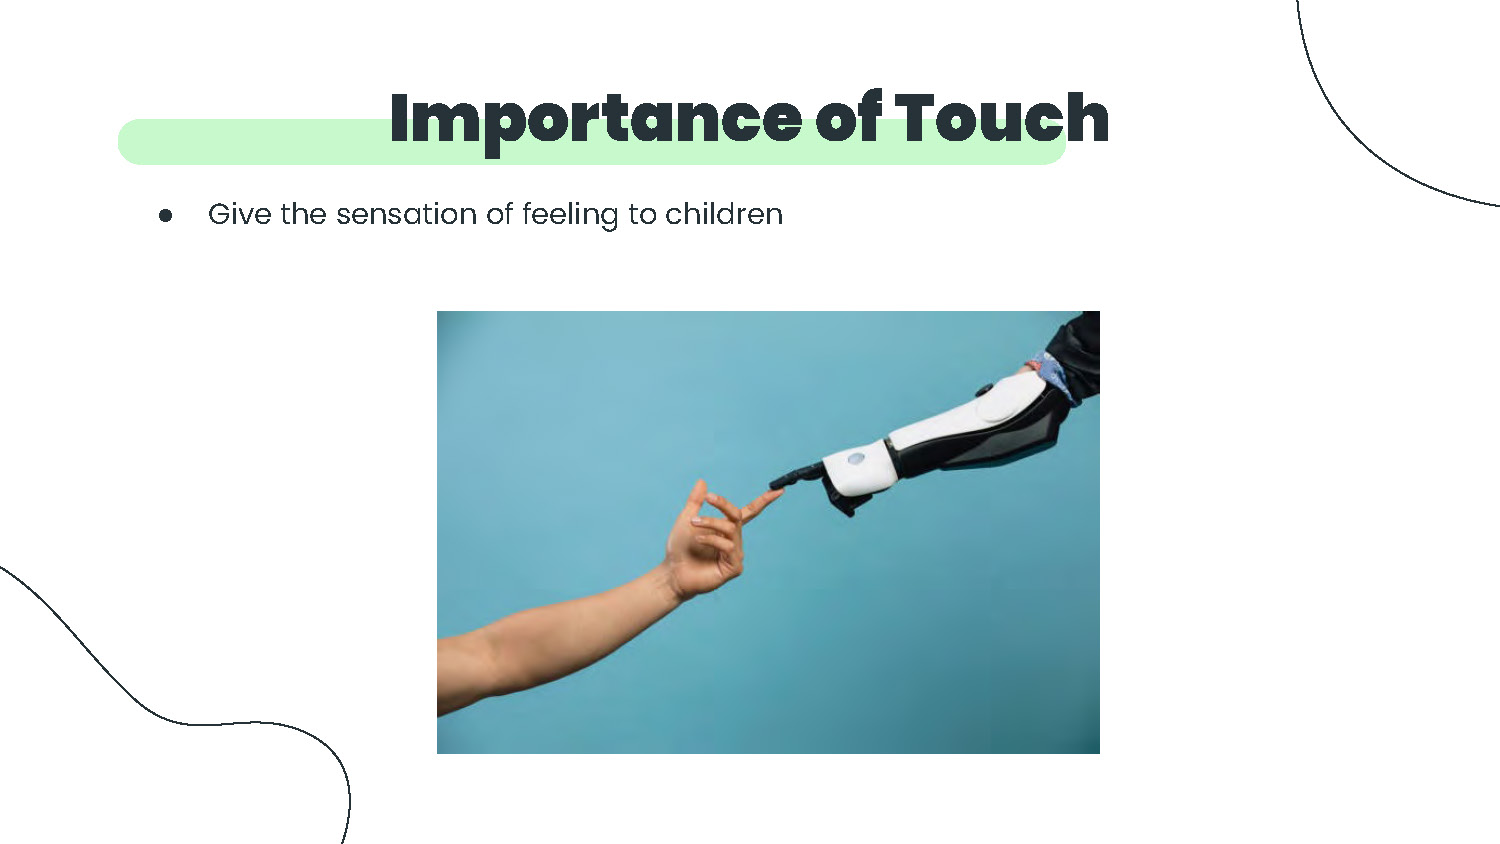
Importance of Touch
Give the sensation of feeling to children
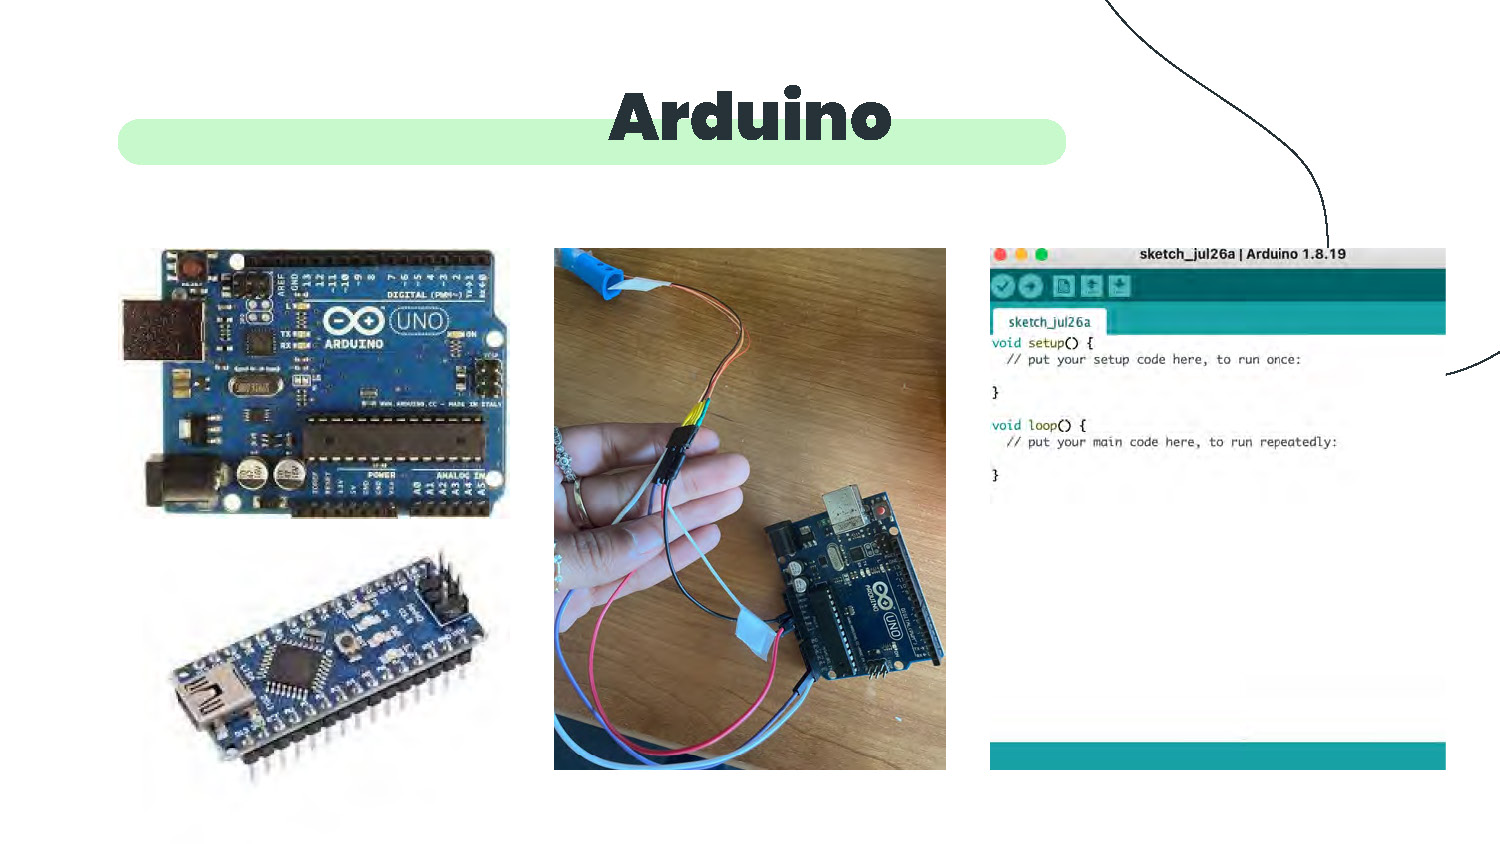
Arduino
- Top-left: a rectangular blue printed circuit board with USB connector on the left, multiple headers along the top and right edges, and white printed markings including the word “UNO.”
- Bottom-left: a smaller blue rectangular circuit board with a micro USB connector at one end and a row of pins along both long edges.
- Center: a photograph of a hand holding several insulated jumper wires and a small black connector; the wires run to a blue circuit board positioned on a wooden surface.
- Right: a screenshot of a software window showing an editor with the text “sketch_jul26a” and two empty functions labeled “void setup() { }” and “void loop() { }”.
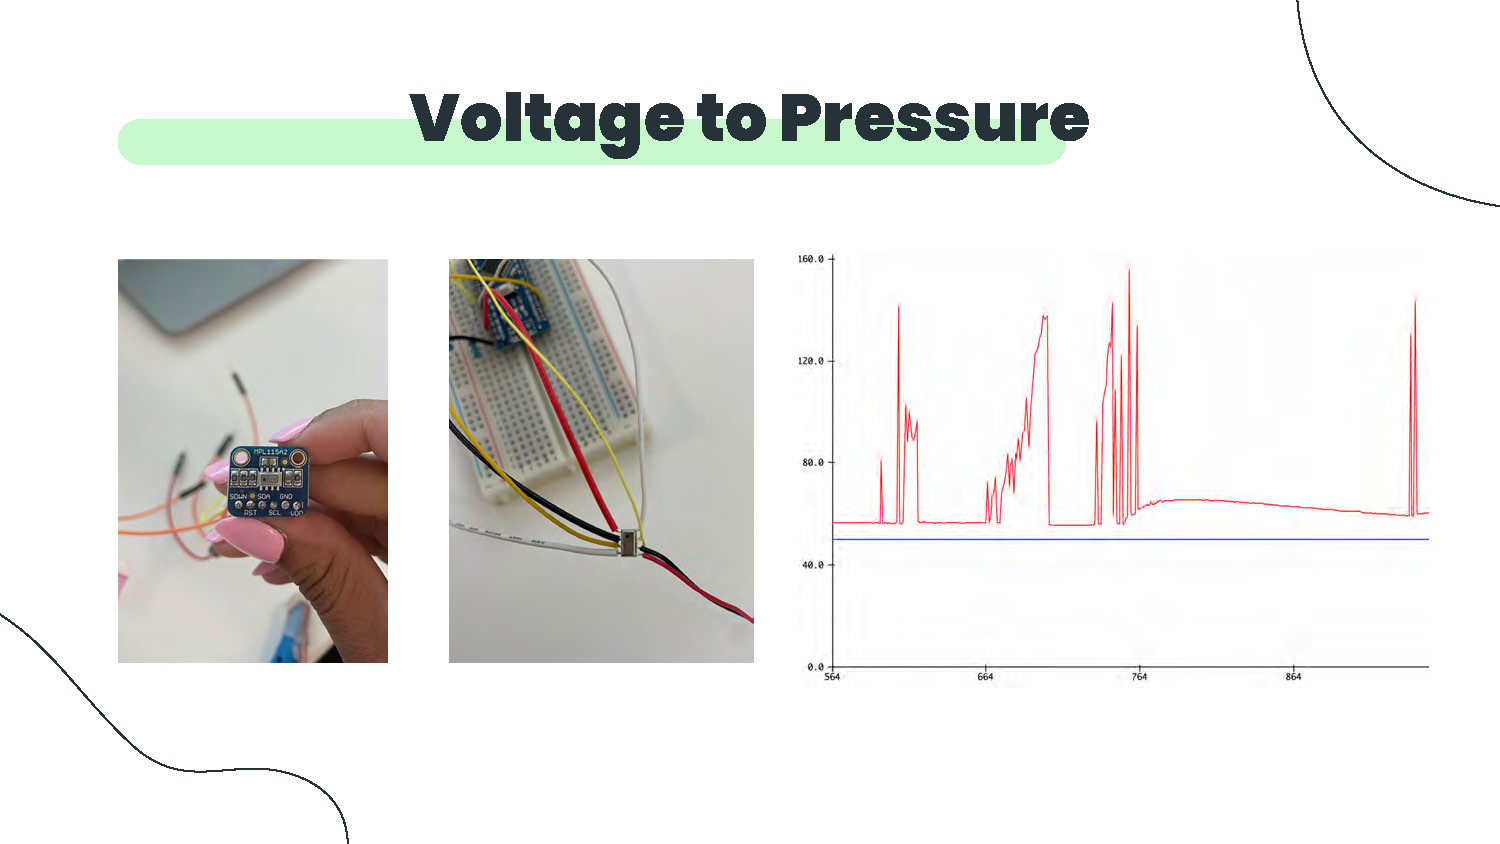
Voltage to Pressure
The image shows three main elements arranged horizontally:
Left photo: A hand holding a small electronic sensor or module with a blue circuit board. The device appears to have multiple pins and components mounted on it. Colored wires (red, yellow, black) are connected to the device.
Center photo: A white breadboard with various colored wires (red, yellow, black, white) inserted into it. The wires appear to be making connections across different rows of the breadboard.
Right graph: A line chart with a red plotted line showing data points. The x-axis appears to span from approximately 554 to 854, while the y-axis ranges from 0 to approximately 160. The line shows several peaks of varying heights, with the highest peaks reaching around 140-150 on the y-axis.
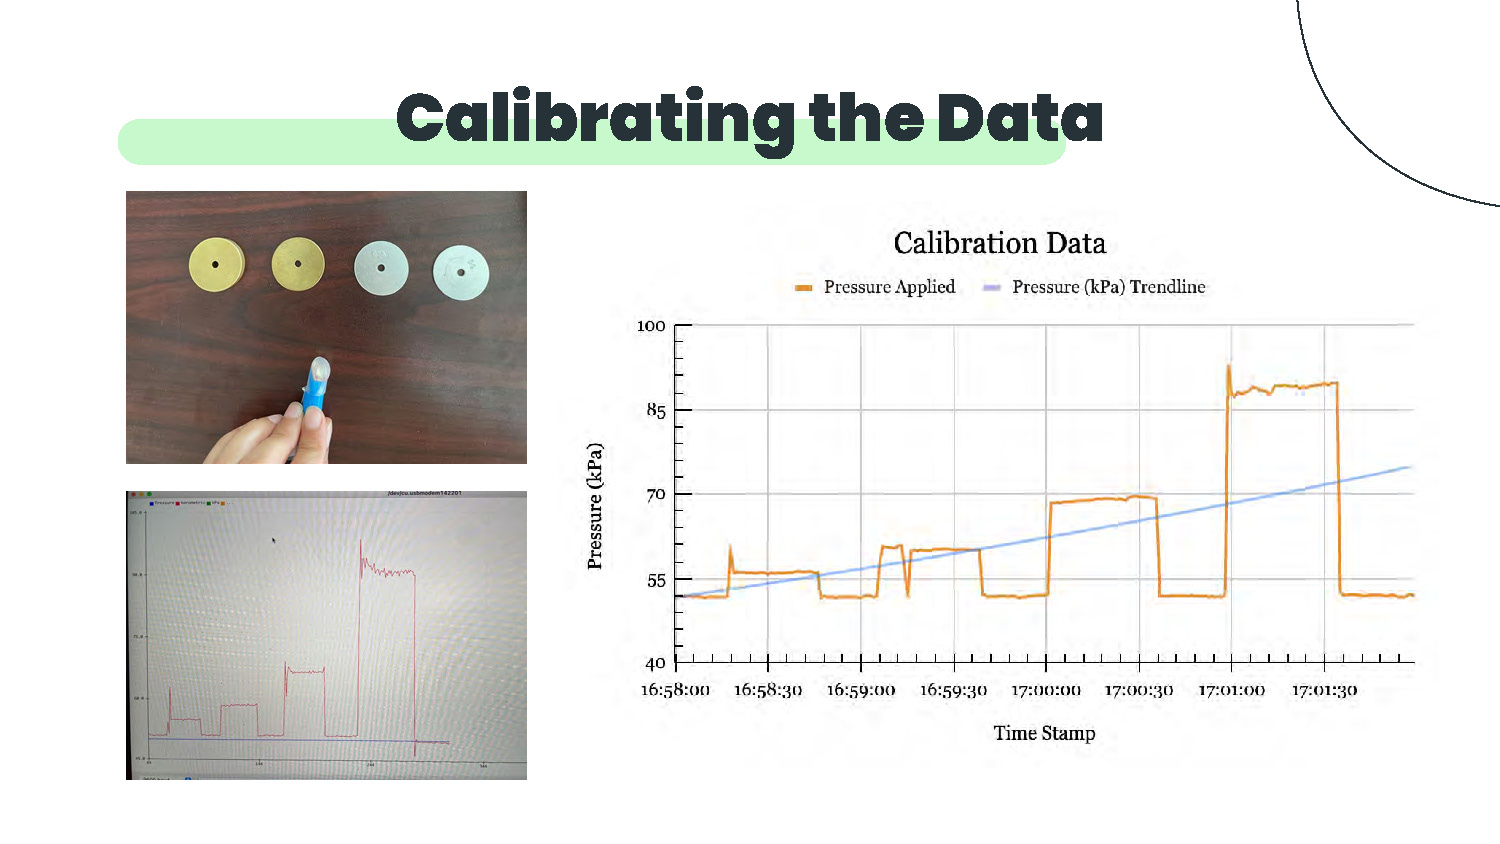
Calibrating the Data
The image shows three main elements:
Top left photo: Four circular discs arranged in a 2x2 grid on a dark wooden surface. Two discs appear yellow/gold colored and two appear light blue/cyan colored. Each disc has a small dark center hole. A hand is visible holding a blue cylindrical object.
Bottom left photo: A computer screen displaying what appears to be a data plotting or graphing software interface. The screen shows a grid with red line plots forming rectangular step patterns at different levels.
Right graph: A chart titled "Calibration Data" with a legend indicating "Pressure Applied" (orange line) and "Pressure (kPa) Trendline" (blue line). The x-axis shows time stamps ranging from approximately 16:58:00 to 17:01:30. The y-axis shows pressure values from 40 to 100 kPa. The orange line shows step-like patterns with plateaus at different pressure levels, while the blue line shows a gradual upward trend.
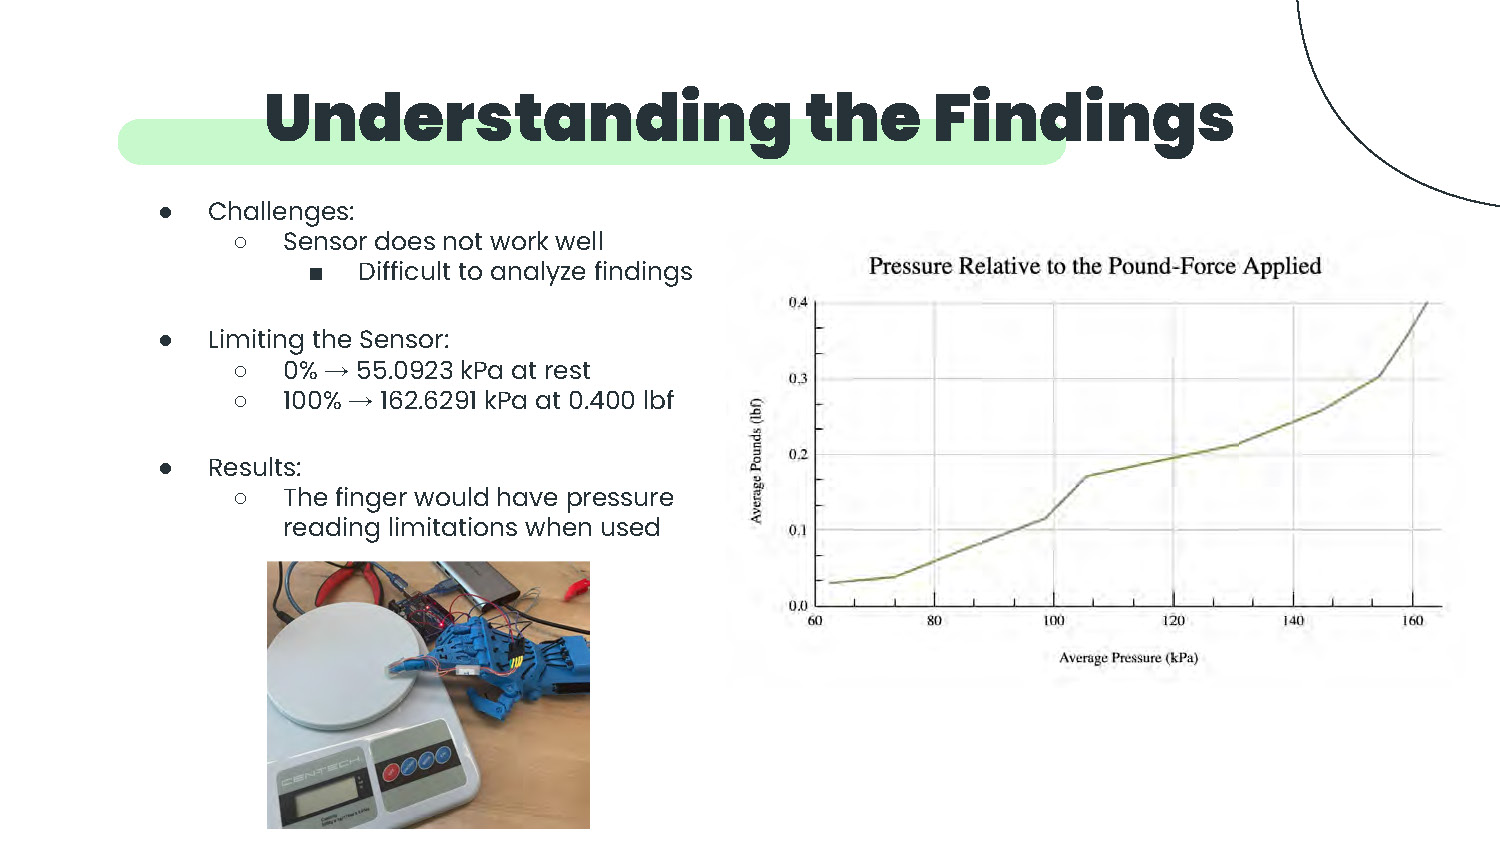
Understanding the Findings
Challenges:
- Sensor does not work well
- Difficult to analyze findings
Limiting the Sensor:
- 0% → 55.0923 kPa at rest
- 100% → 162.6291 kPa at 0.400 lbf
Results:
- The finger would have pressure reading limitations when used
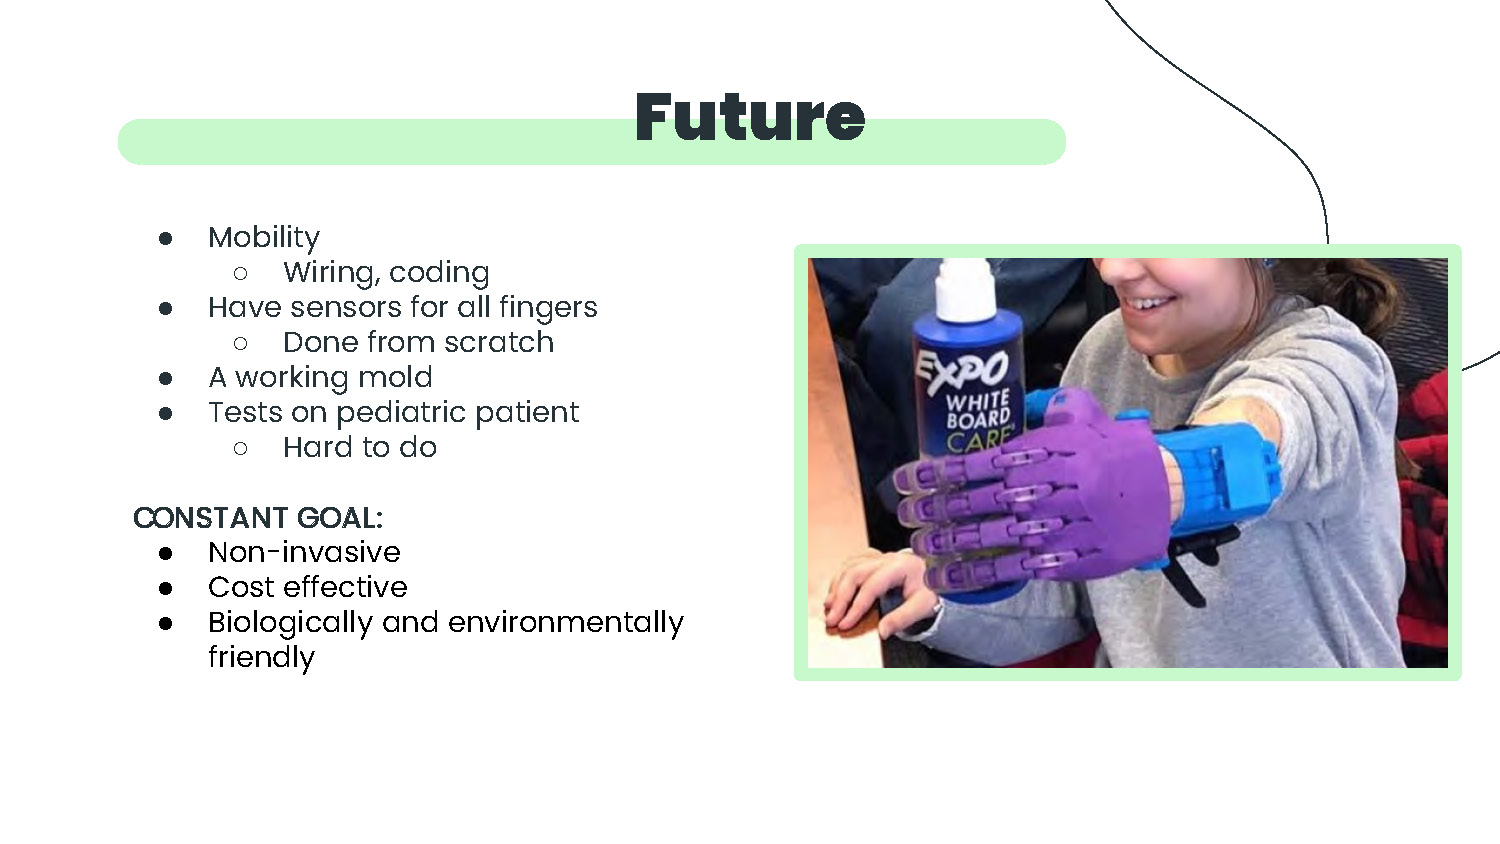
Future
- Mobility
- Wiring, coding
- Have sensors for all fingers
- Done from scratch
- A working mold
- Tests on pediatric patient
- Hard to do
CONSTANT GOAL:
- Non-invasive
- Cost effective
- Biologically and environmentally friendly
References
- https://www.nationwidechildrens.org/family-resources-education/700childrens/2018/04/limb-loss-adapting-to-the-challenges-and-hitting-milestones
- https://cdn.thingiverse.com/assets/09/62/11/29/80/RAPTOR_assembly_instructions_R1.2.pdf
- https://www.3dprintingspot.com/post/petg-vs-pla-main-pros-cons-of-both
- https://media.istockphoto.com/photos/human-and-robotic-hand-touching-picture-id1149086253?k=20&m=1149086253&s=612x612&w=0&h=XciFpCuOAlvMlcJ2ar_yr9-mejm2F9N72p-mSkbcMWo=
- https://www.gmelectronic.com/data/product/1024_1024/pctdetail.774-024.1.jpg
- https://cdn.shoplightspeed.com/shops/642375/files/29464252/800x800x3/arduino-uno-r3-development-board.jpg
- https://mcopro.com/blog/resources/arm-hand-prosthetics/#:~:text=How%20much%20does%20a%20prosthetic,the%20latest%20myoelectric%20arm%20technology.
- https://www.vmcdn.ca/f/files/airdrietoday/import/24/2018/05/GT-20180130-RVW0302-301309985-AR.jpeg

End of Presentation
Click the right arrow to return to the beginning of the slide show.
For a downloadable version of this presentation, email: I-SENSE@FAU.