Deep Learning-Based Algal Bloom Prediction for Lake Okeechobee Using Multi-Source Data Fusion
REU Scholar: Lindsay Steis
REU Mentors: Dr. Yufei Tang & Yingqi Feng
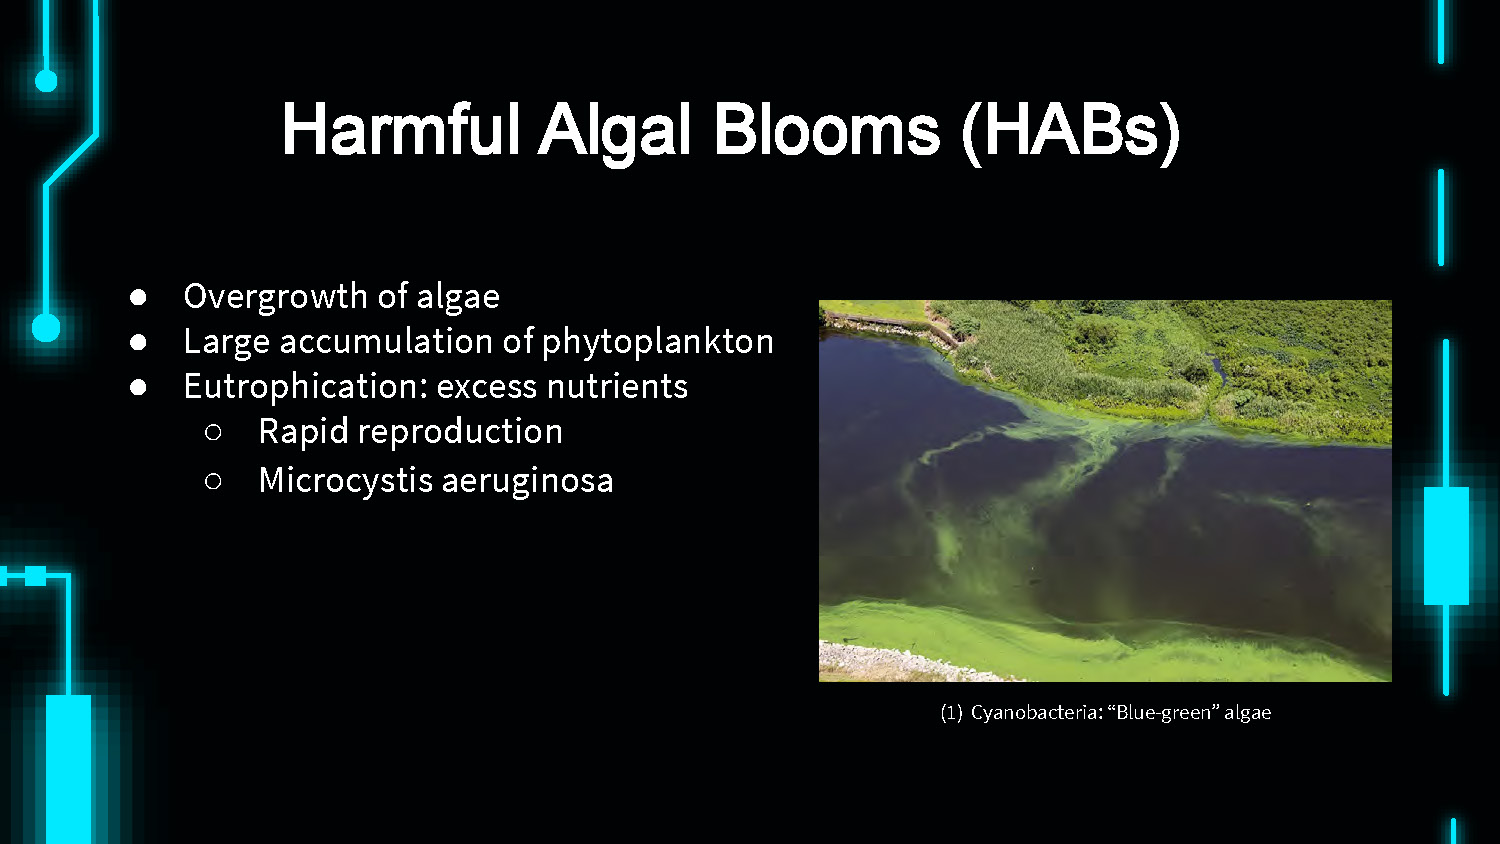
Harmful Algal Blooms (HABs)
- Overgrowth of algae
- Large accumulation of phytoplankton
- Eutrophication: excess nutrients
- Rapid reproduction
- Microcystis aeruginosa
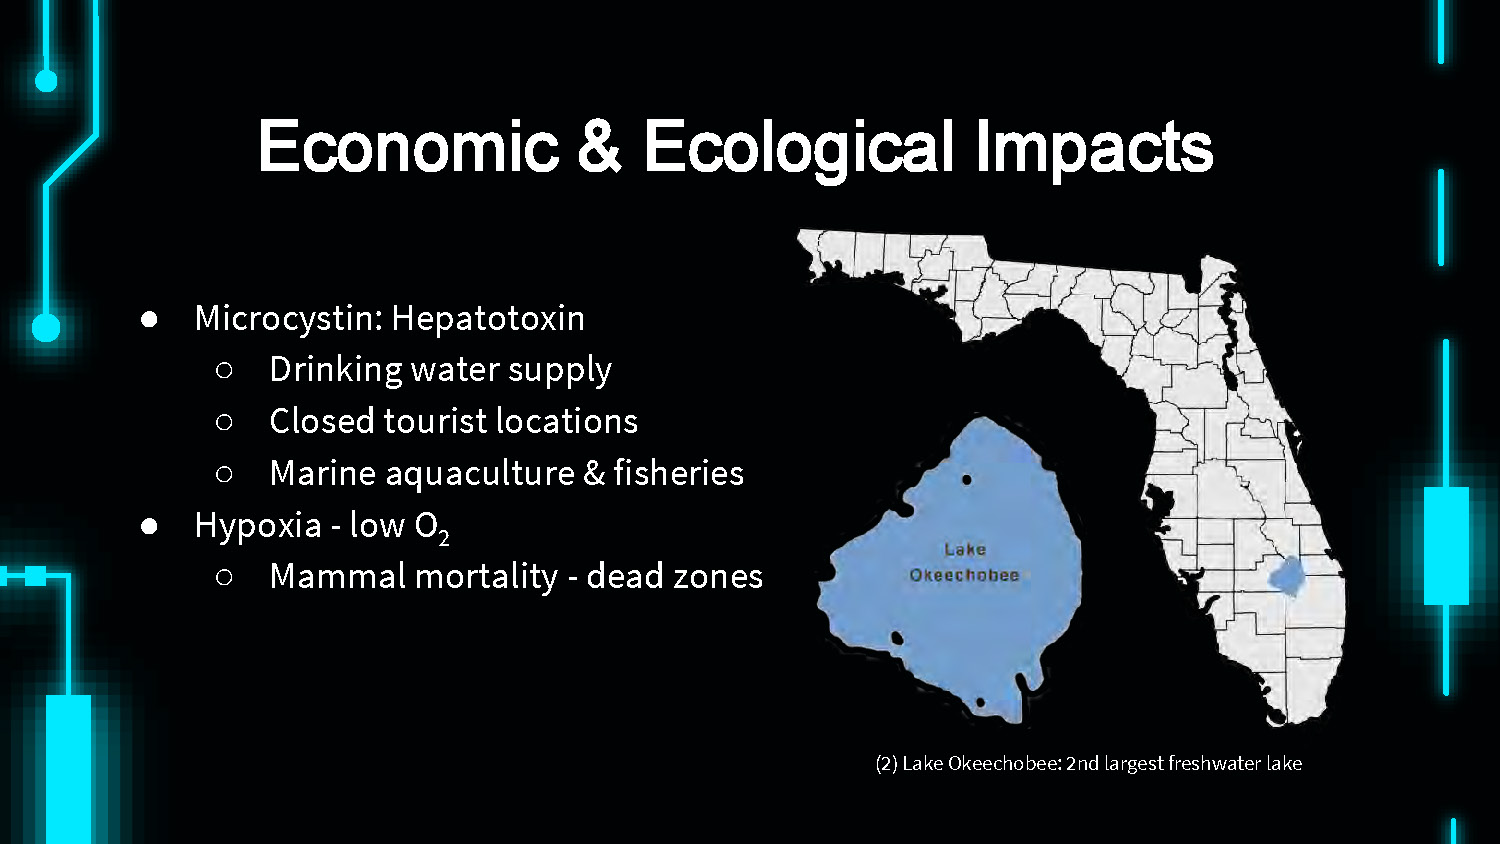
Economic & Ecological Impacts
- Microcystin: Hepatotoxin
- Drinking water supply
- Closed tourist locations
- Marine aquaculture & fisheries
- Hypoxia - low O2
- Mammal mortality - dead zones
Maps showing Lake Okeechobee: 2nd largest freshwater lake
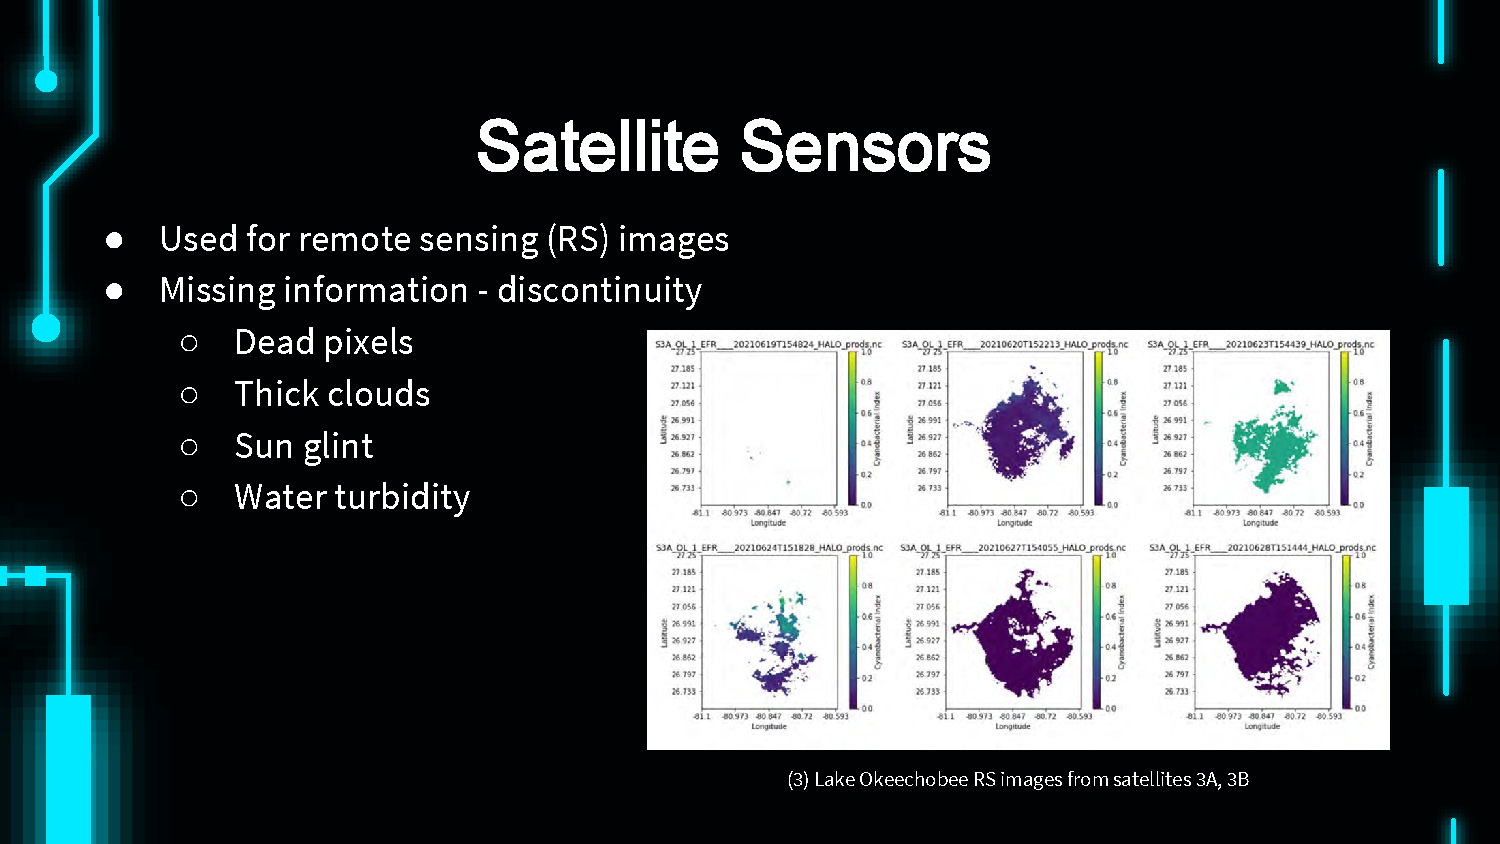
Satellite Sensors
- Used for remote sensing (RS) images
- Missing information - discontinuity
- Dead pixels
- Thick clouds
- Sun glint
- Water turbidity
(3) Lake Okeechobee set of six RS images from satellites 3A, 3B
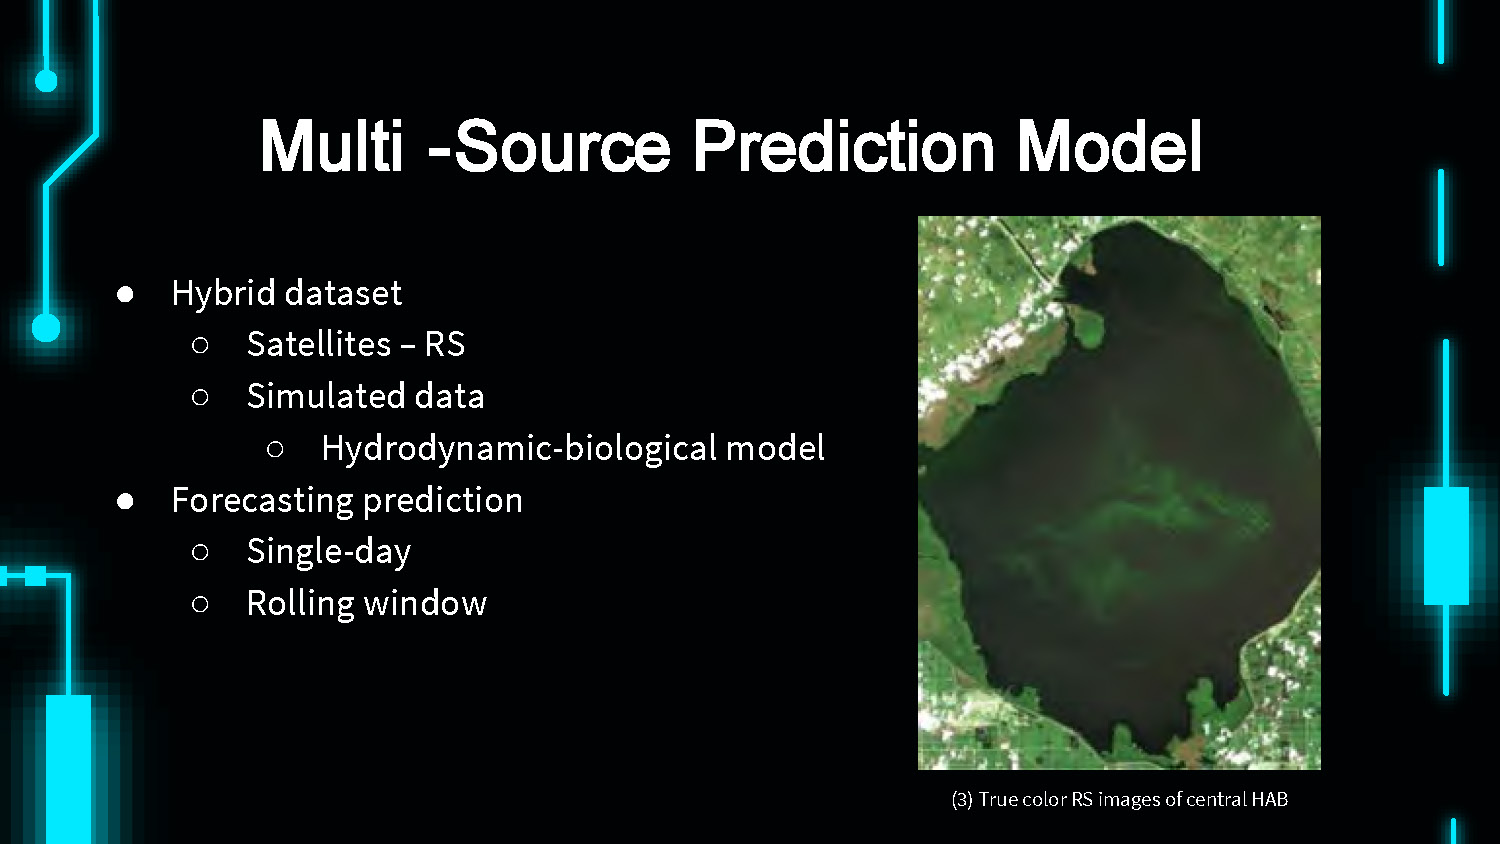
Multi-Source Prediction Model
- Hybrid dataset
- Satellites – RS
- Simulated data
- Hydrodynamic-biological model
- Forecasting prediction
- Single-day
- Rolling window
(3) True color RS image of central HAB
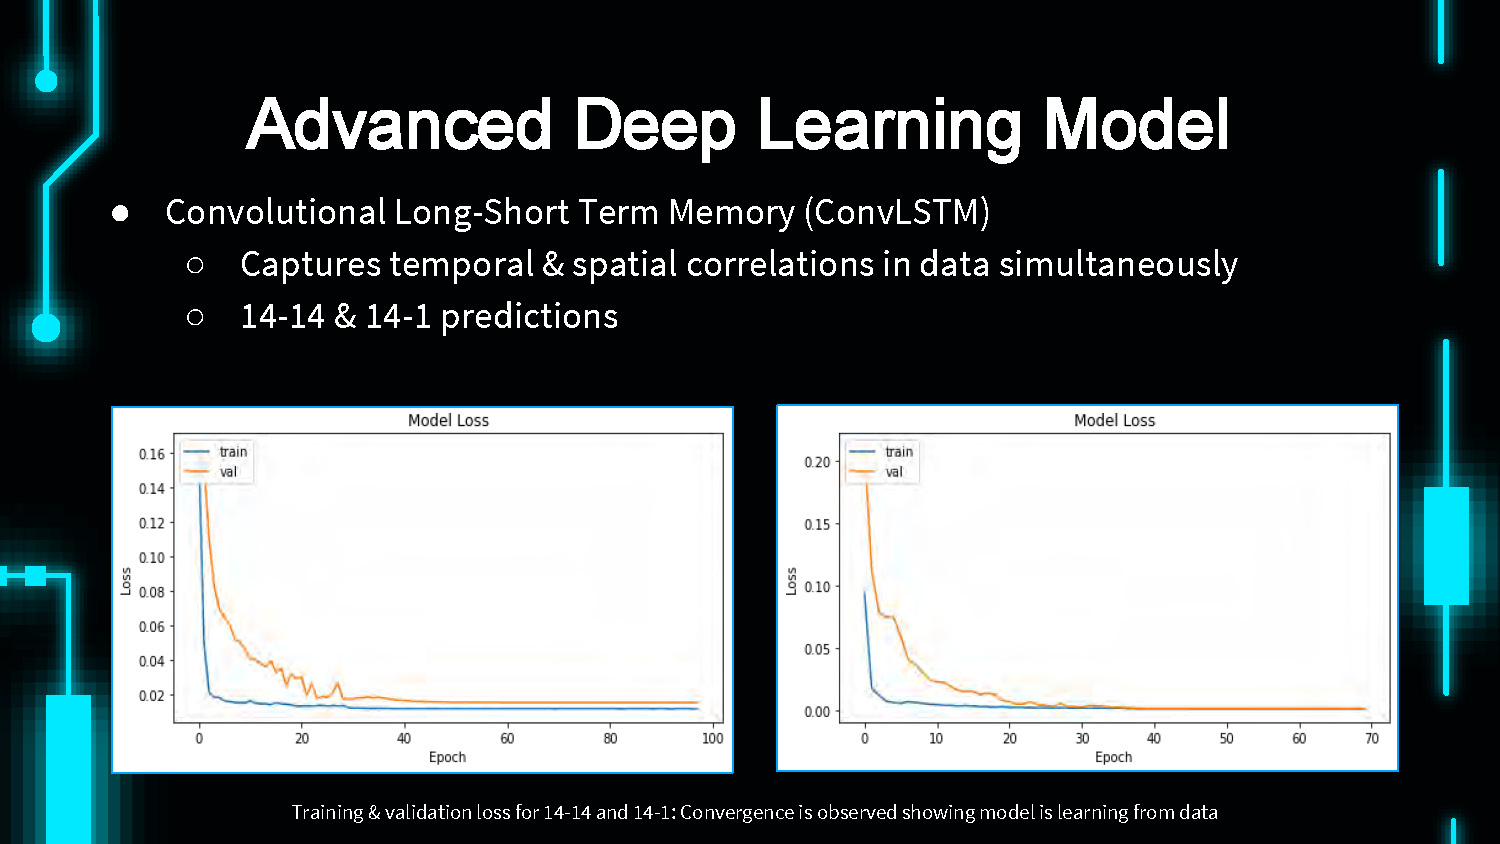
Advanced Deep Learning Model
- Convolutional Long-Short Term Memory (ConvLSTM)
- Captures temporal & spatial correlations in data simultaneously
- 14-14 & 14-1 predictions
Two graphs showing Training & validation loss for 14-14 and 14-1: Convergence is observed showing model is learning from data
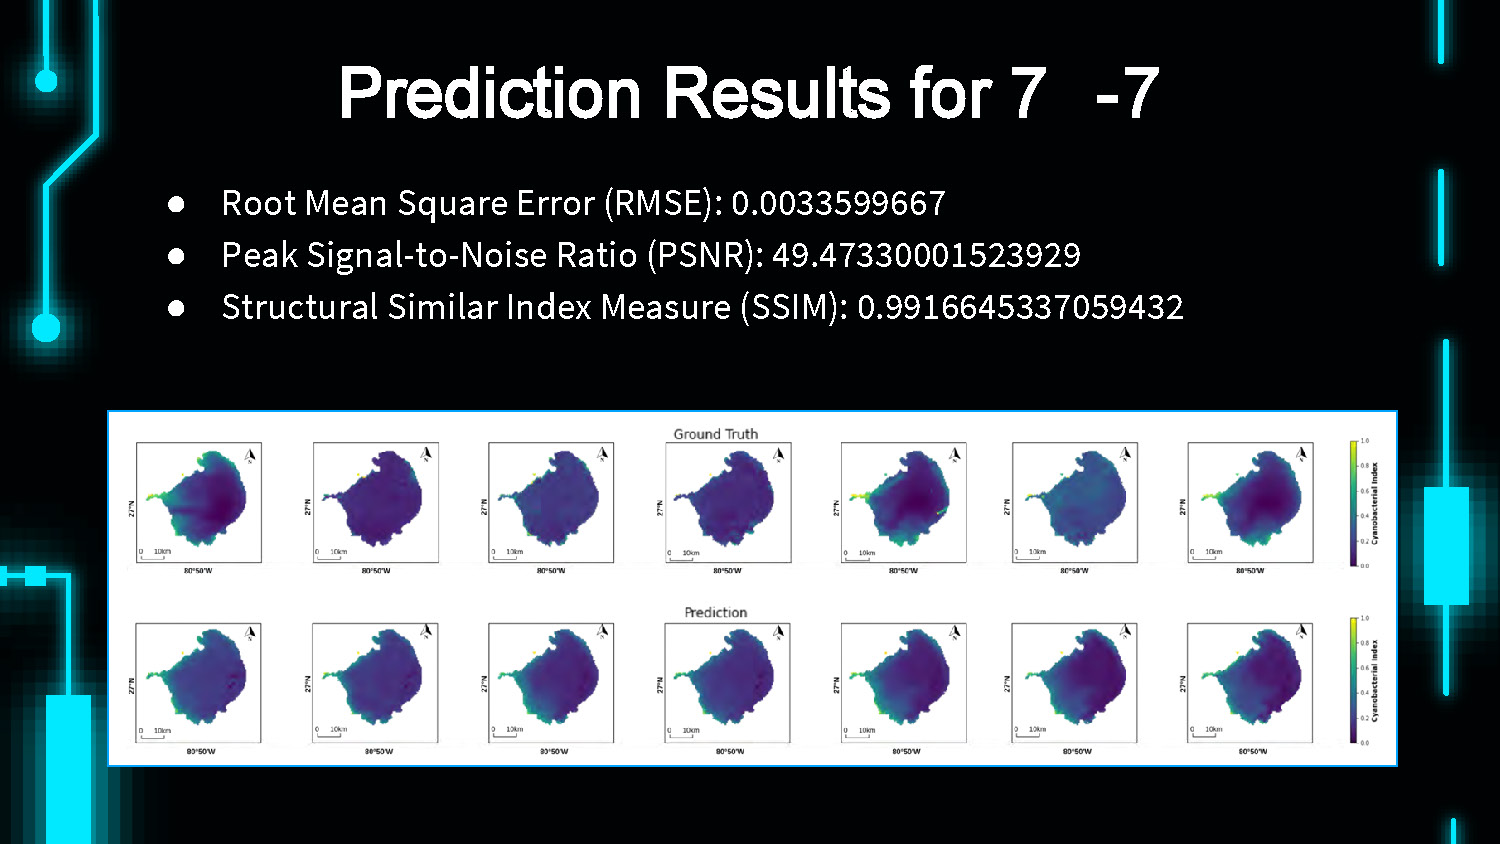
Prediction Results for 7-7
- Root Mean Square Error (RMSE): 0.0033599667
- Peak Signal-to-Noise Ratio (PSNR): 49.47330001523929
- Structural Similar Index Measure (SSIM): 0.9916645337059432
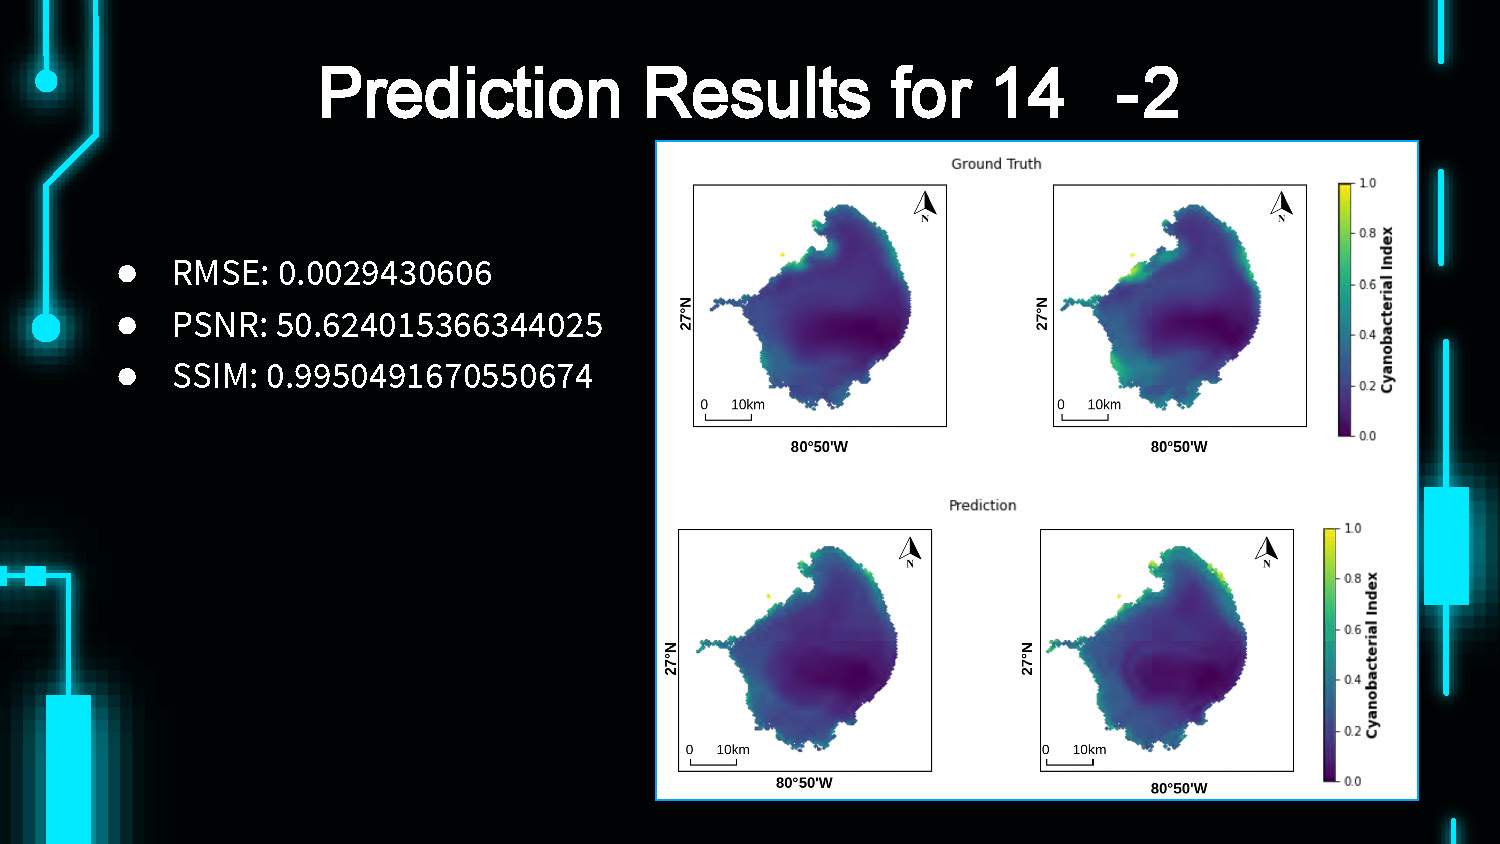
Prediction Results for 14-2
- RMSE: 0.0029430606
- PSNR: 50.624015366344025
- SSIM: 0.9950491670550674
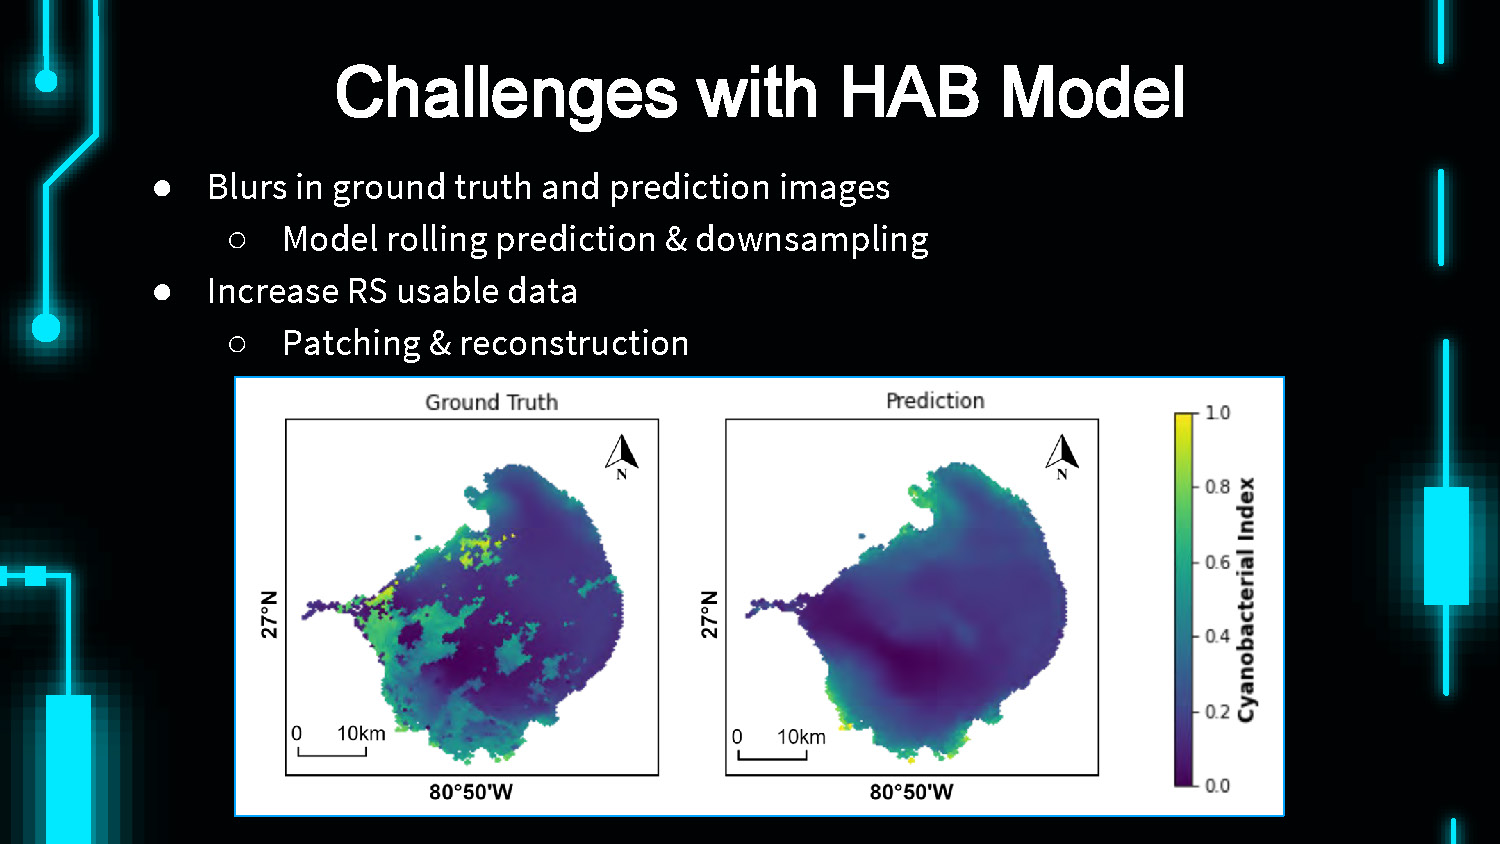
Challenges with HAB Model
- Blurs in ground truth and prediction images
- Model rolling prediction & downsampling
- Increase RS usable data
- Patching & reconstruction
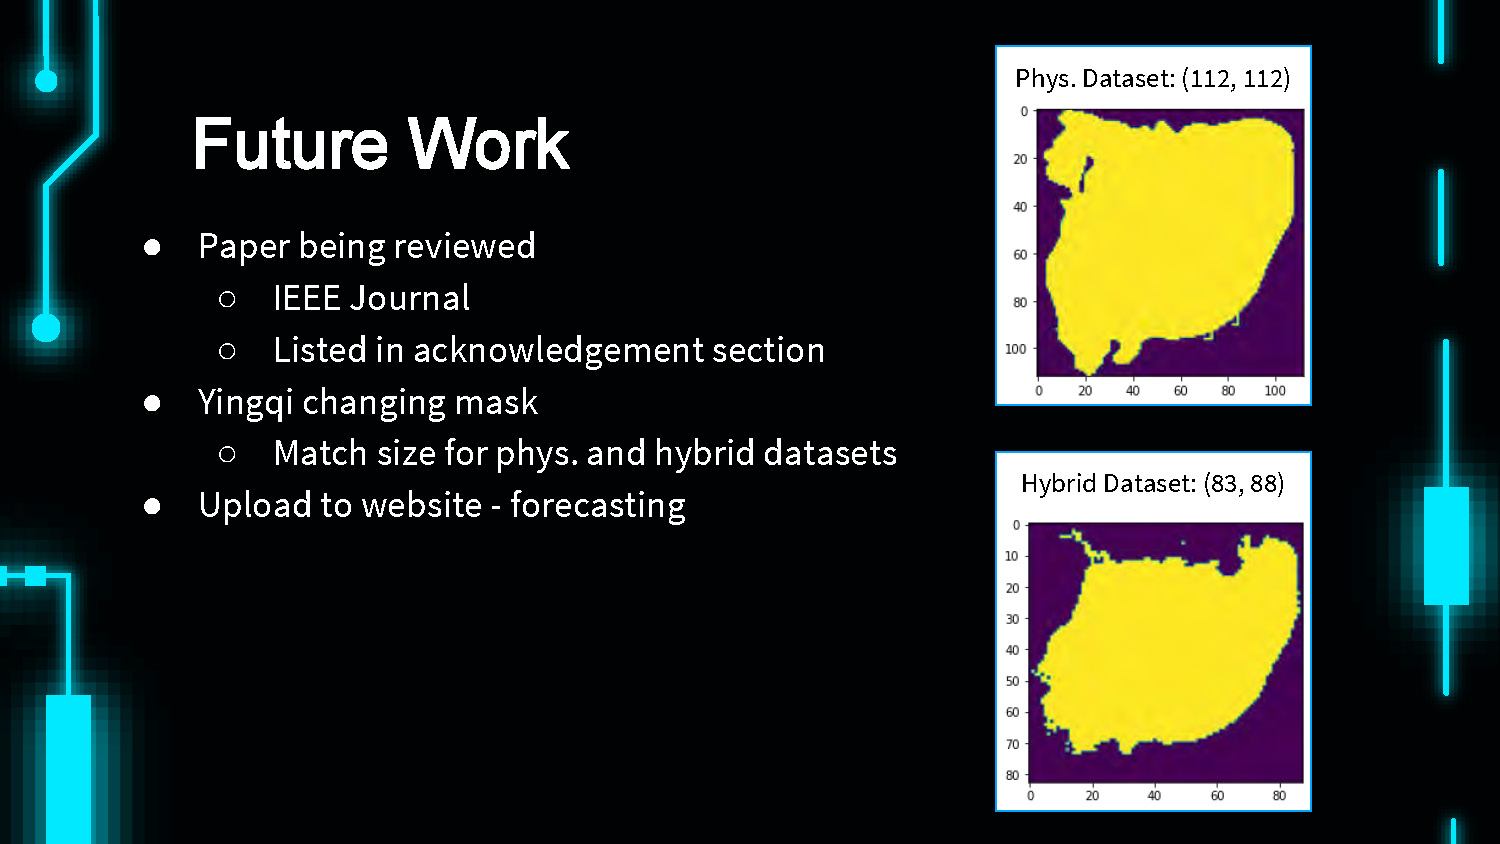
Future Work
- Paper being reviewed
- IEEE Journal
- Listed in acknowledgement section
- Yingqi changing mask
- Match size for phys. and hybrid datasets
- Upload to website - forecasting
Image: Hybrid Dataset: (83, 88)
Image: Phys. Dataset: (112, 112)

THANKS!
Questions?
References
(1) Galoustain, G. (2020, August). FAU awarded $2.2 million to monitor algal blooms in Lake Okeechobee. Florida Atlantic University. https://www.fau.edu/newsdesk/articles/habs-lake-okeechobee.php
(2) Lake Okeechobee Aquatic Plant Management Interagency Task Force. (2021). University Of Georgia - Center For Invasive Species And Ecosystem Health. https://www.floridainvasives.org/okeechobee/about/
(3) Tang, Y., Feng, Y., Fung, S., Ruiz Xomchuk, V., Jiang, M., Moore, T., & Beckler, J. (2022, July). Deep learning-based algal bloom prediction for Lake Okeechobee using multi-source data fusion. IEEE Journal of Selected Topics in Applied Earth Observations and Remote Sensing, 1-13. *Under review*

End of Presentation
Click the right arrow to return to the beginning of the slide show.
For a downloadable version of this presentation, email: I-SENSE@FAU.