Wearable Sensors and Data Analytics (Samsung Watch App) & (Diary App)
Christopher Chi
Dr. Behnaz Ghoraani
Introduction
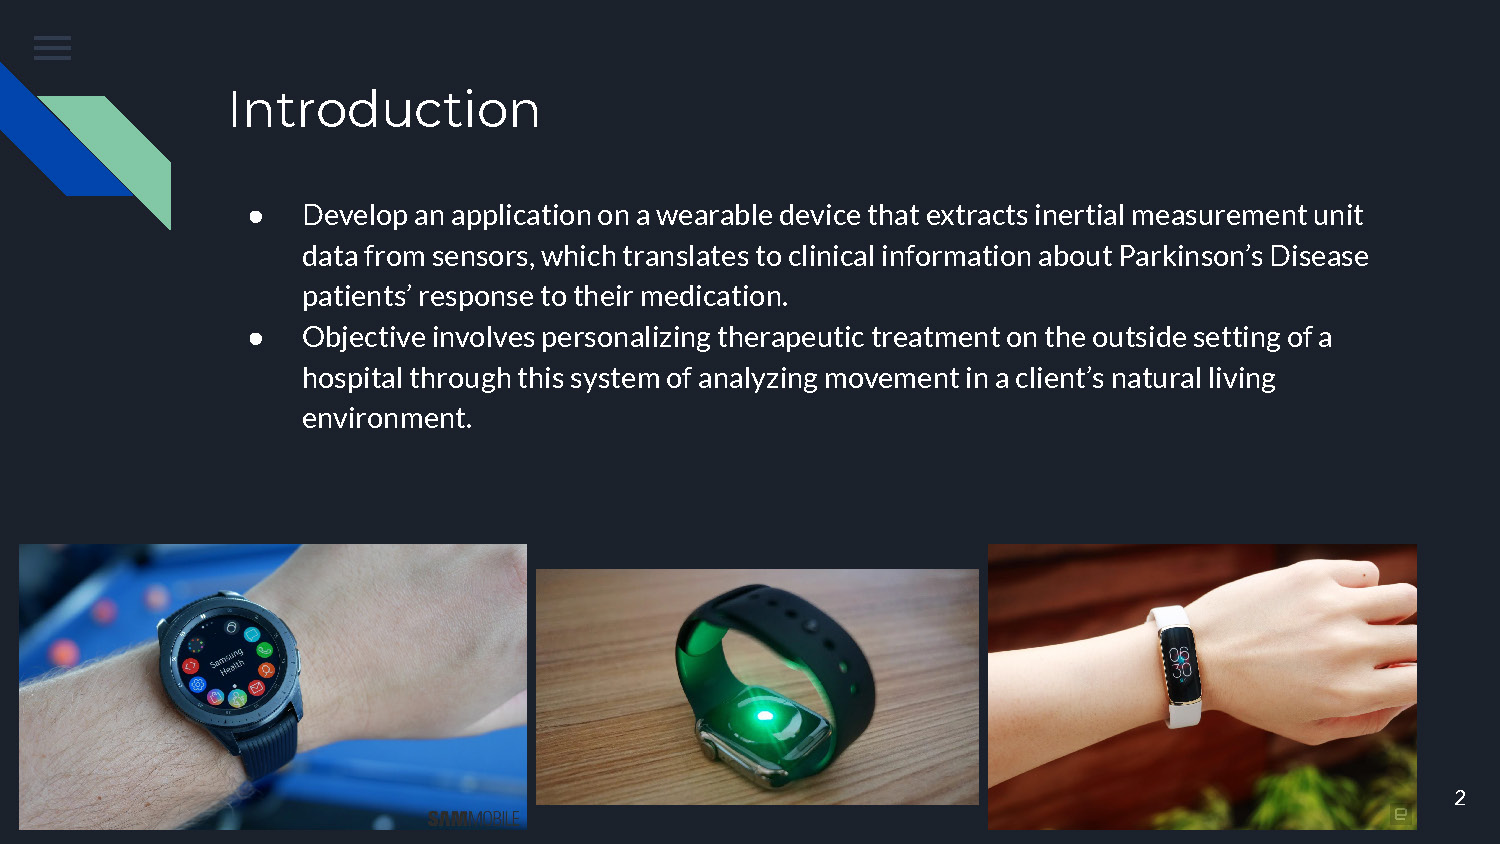
- Develop an application on a wearable device that extracts inertial measurement unit data from sensors, which translates to clinical information about Parkinson's Disease patients' response to their medication.
- Objective involves personalizing therapeutic treatment on the outside setting of a hospital through this system of analyzing movement in a client's natural living environment.
SAMSUNG Watch
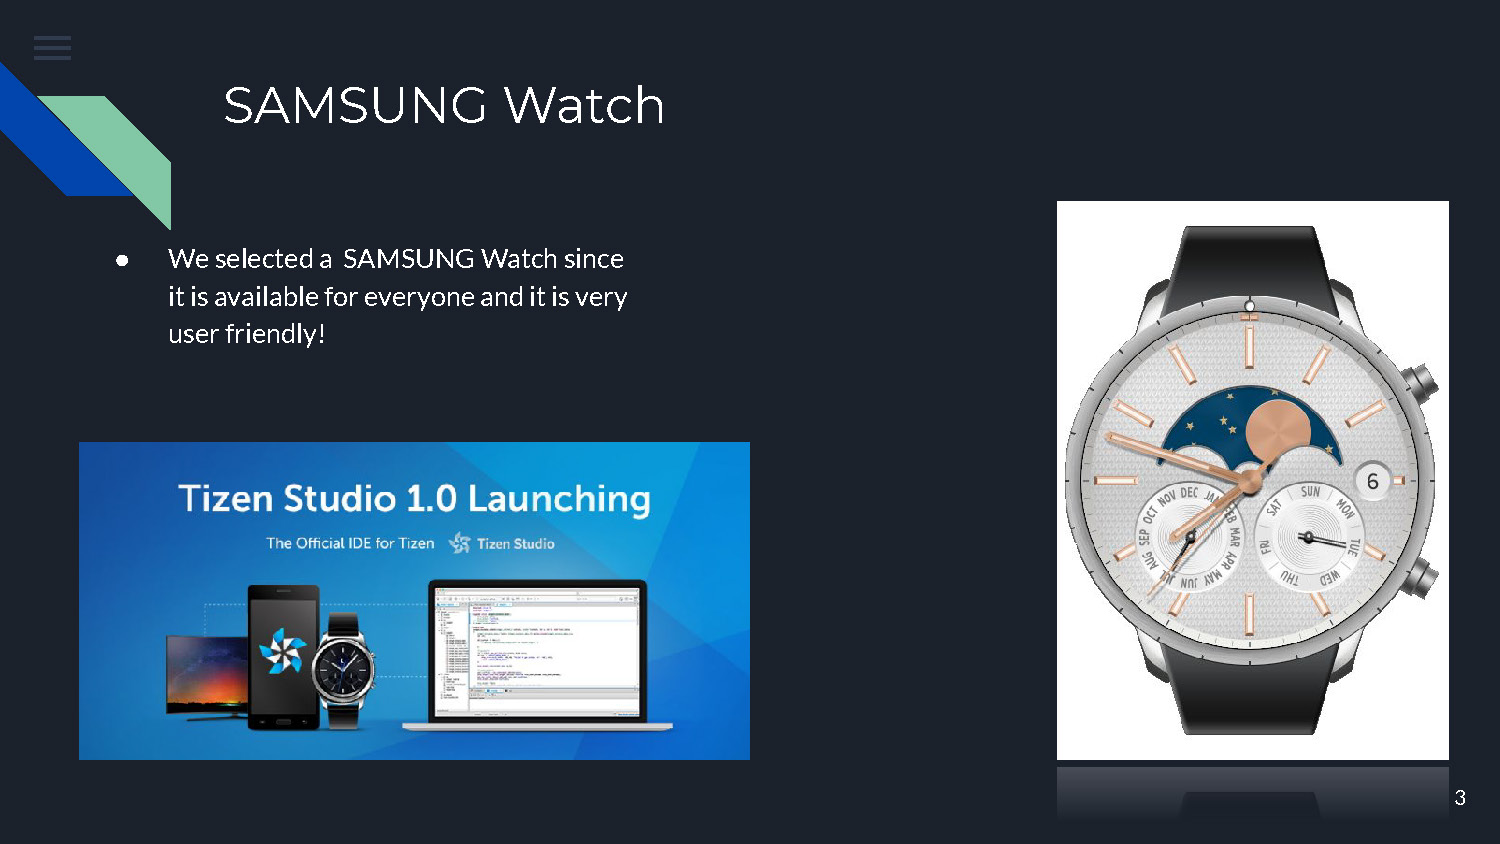
- We selected a SAMSUNG Watch since it is available for everyone and it is very user friendly!
Data
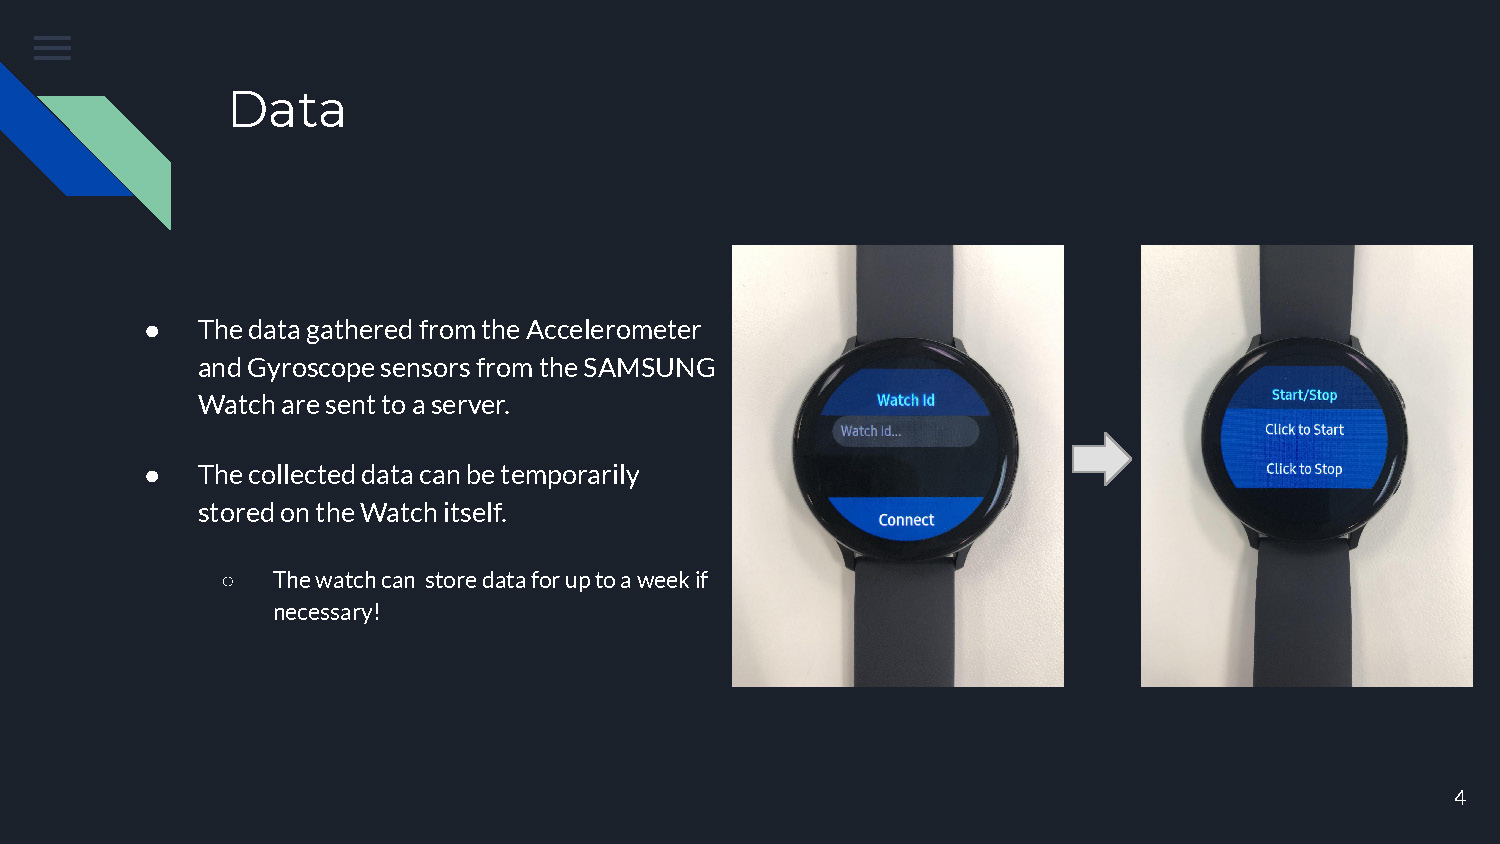
- The data gathered from the Accelerometer and Gyroscope sensors from the SAMSUNG Watch are sent to a server.
- The collected data can be temporarily stored on the Watch itself.
- The watch can store data for up to a week if necessary!
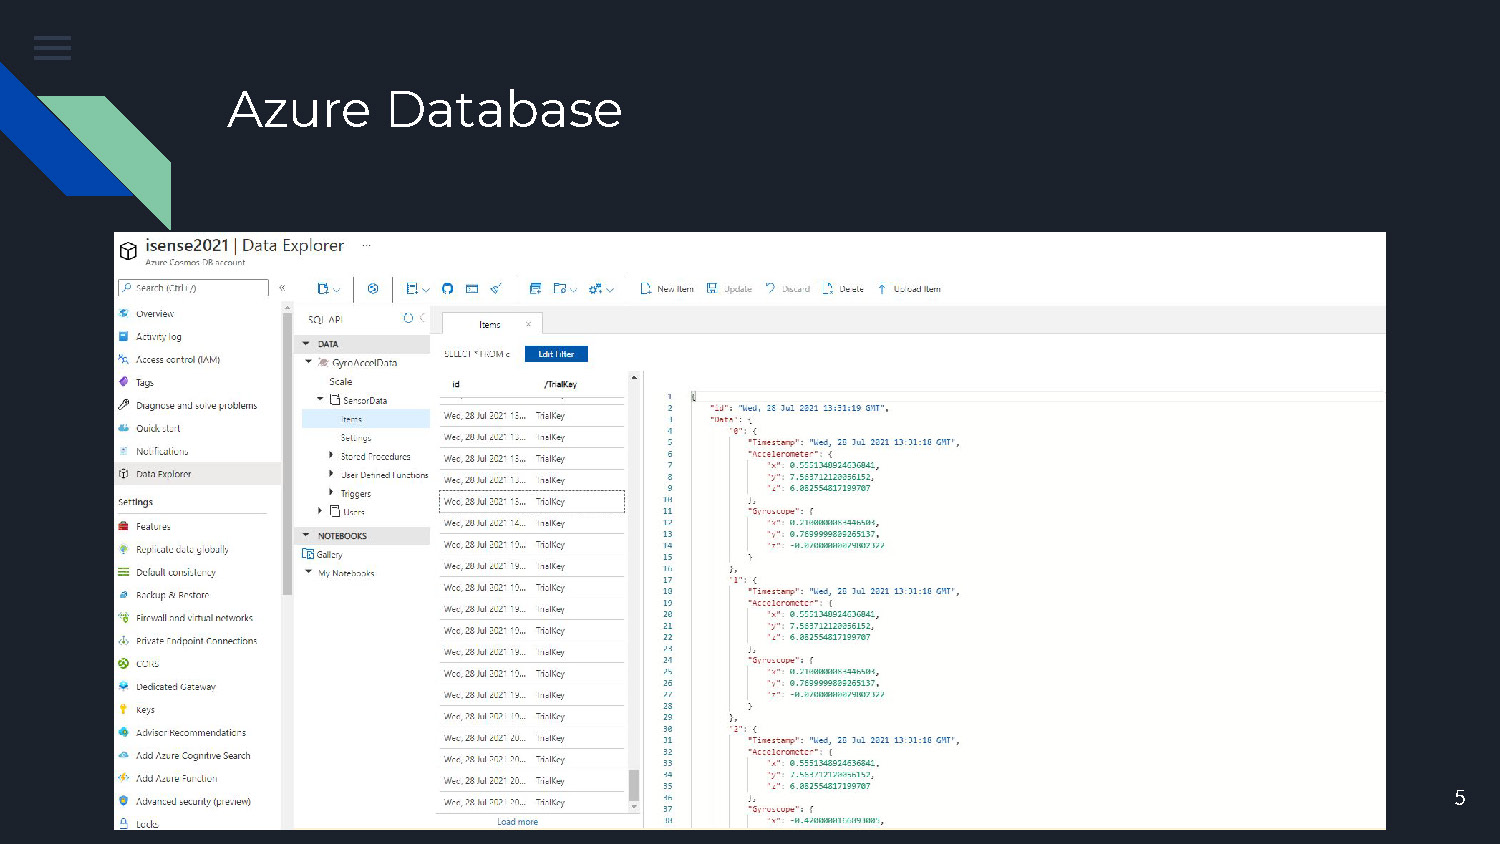
Azure Database
This slide shows the integration with Microsoft Azure Database for storing and managing the collected sensor data from the wearable devices.
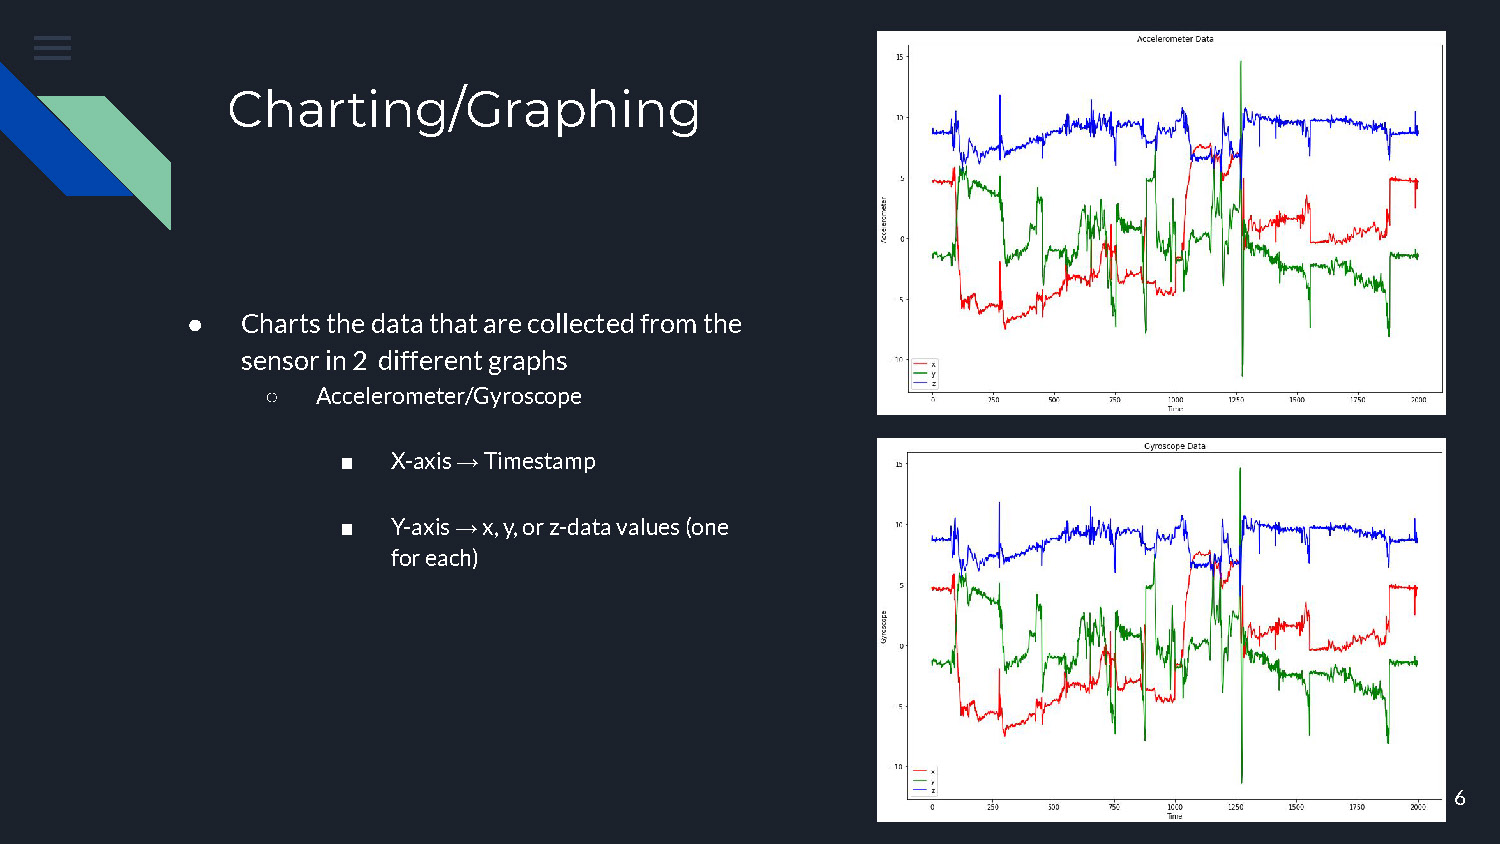
Charting/Graphing
- Charts the data that are collected from the sensor in 2 different graphs
- Accelerometer/Gyroscope
- X-axis → Timestamp
- Y-axis → x, y, or z-data values (one for each)
- Accelerometer/Gyroscope
Slide shows data visualization through two charts showing accelerometer and gyroscope readings with timestamp and coordinate axes
Challenges
- Ensuring there was no drop loss in the data as it was being collected/sent
- Storing the data locally after losing connection to Wifi
- Implementing an efficient method of sending data to the server with a frequency of 100 Hz without crashing the application
Wearable Sensors and Data Analytics (Diary App)
About
- Develop a mobile application that allows elderly people to answer the following questions relating to their physical condition, medication, and how well the sensor performed throughout their day.
- Exhibit their daily activities and evaluate the severity of their condition, whether they are improving, regressing, or staying neutral.
Authentication
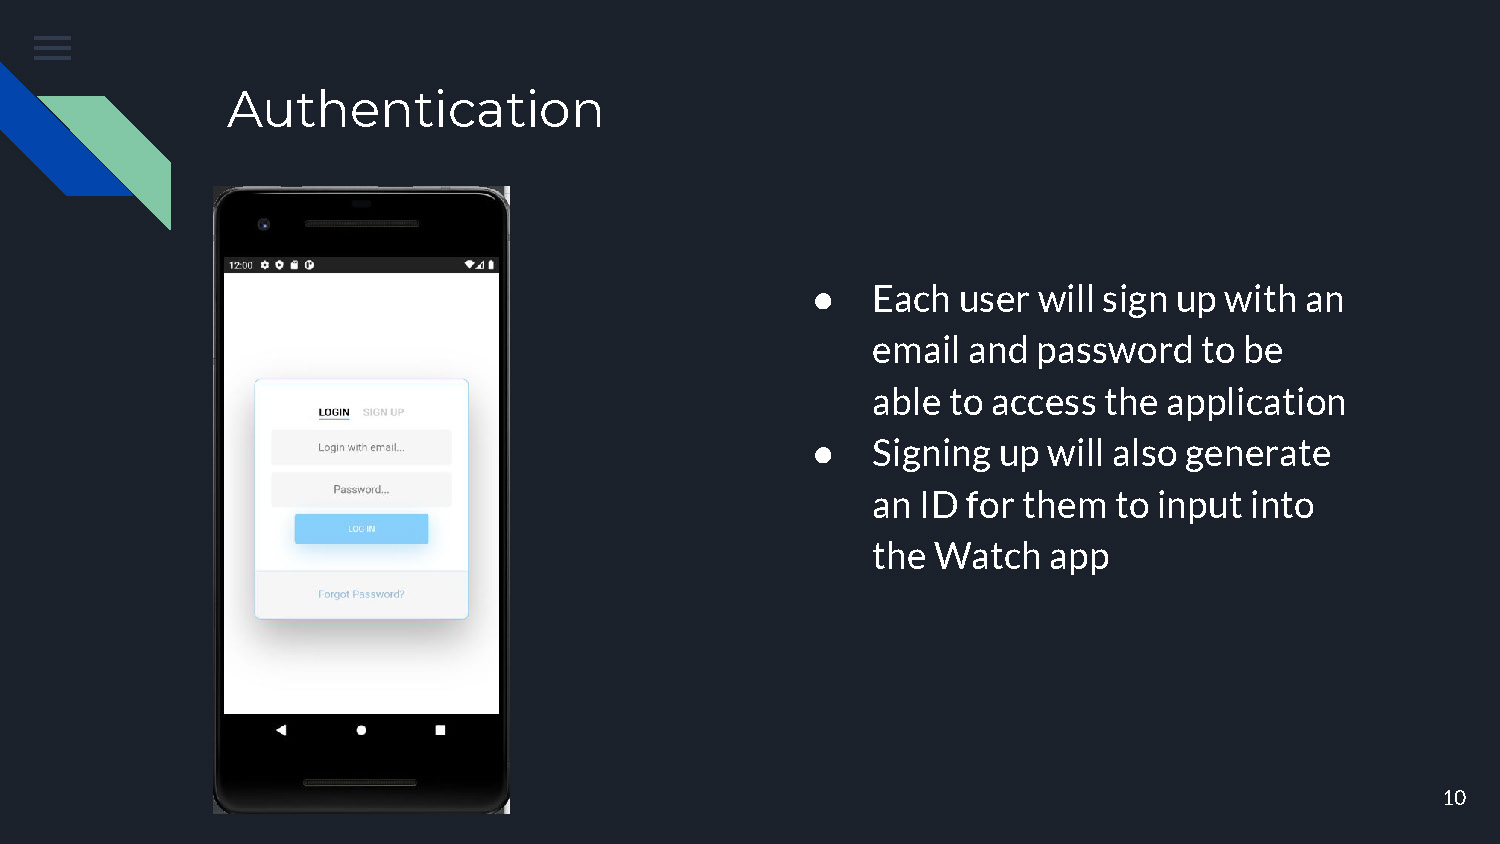
- Each user will sign up with an email and password to be able to access the application
- Signing up will also generate an ID for them to input into the Watch app
Design
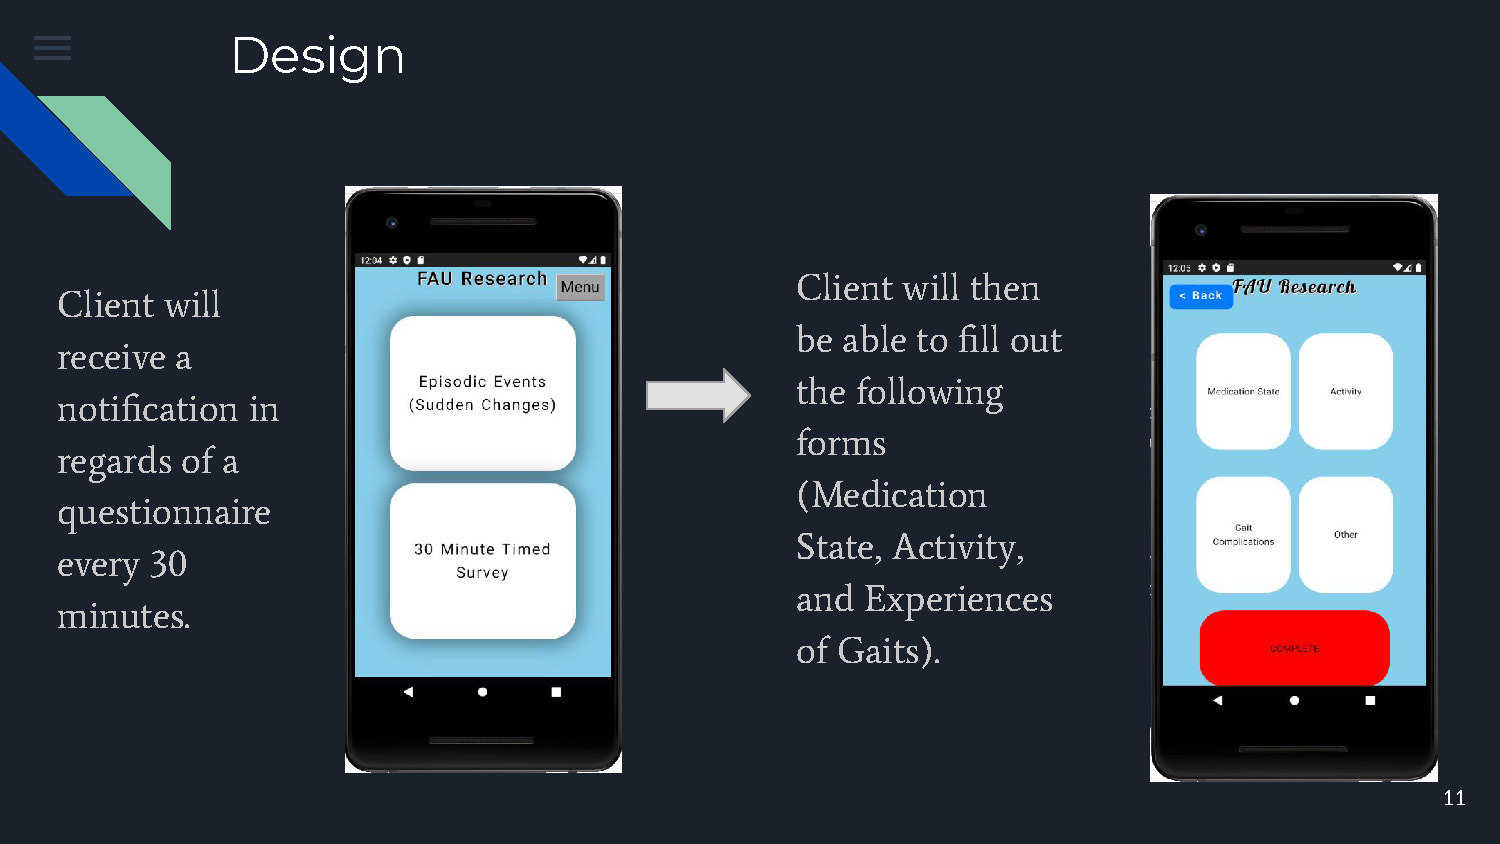
Client will receive a notification in regards of a questionnaire every 30 minutes.
Client will then be able to fill out the following forms (Medication State, Activity, and Experiences of Gaits).
Example
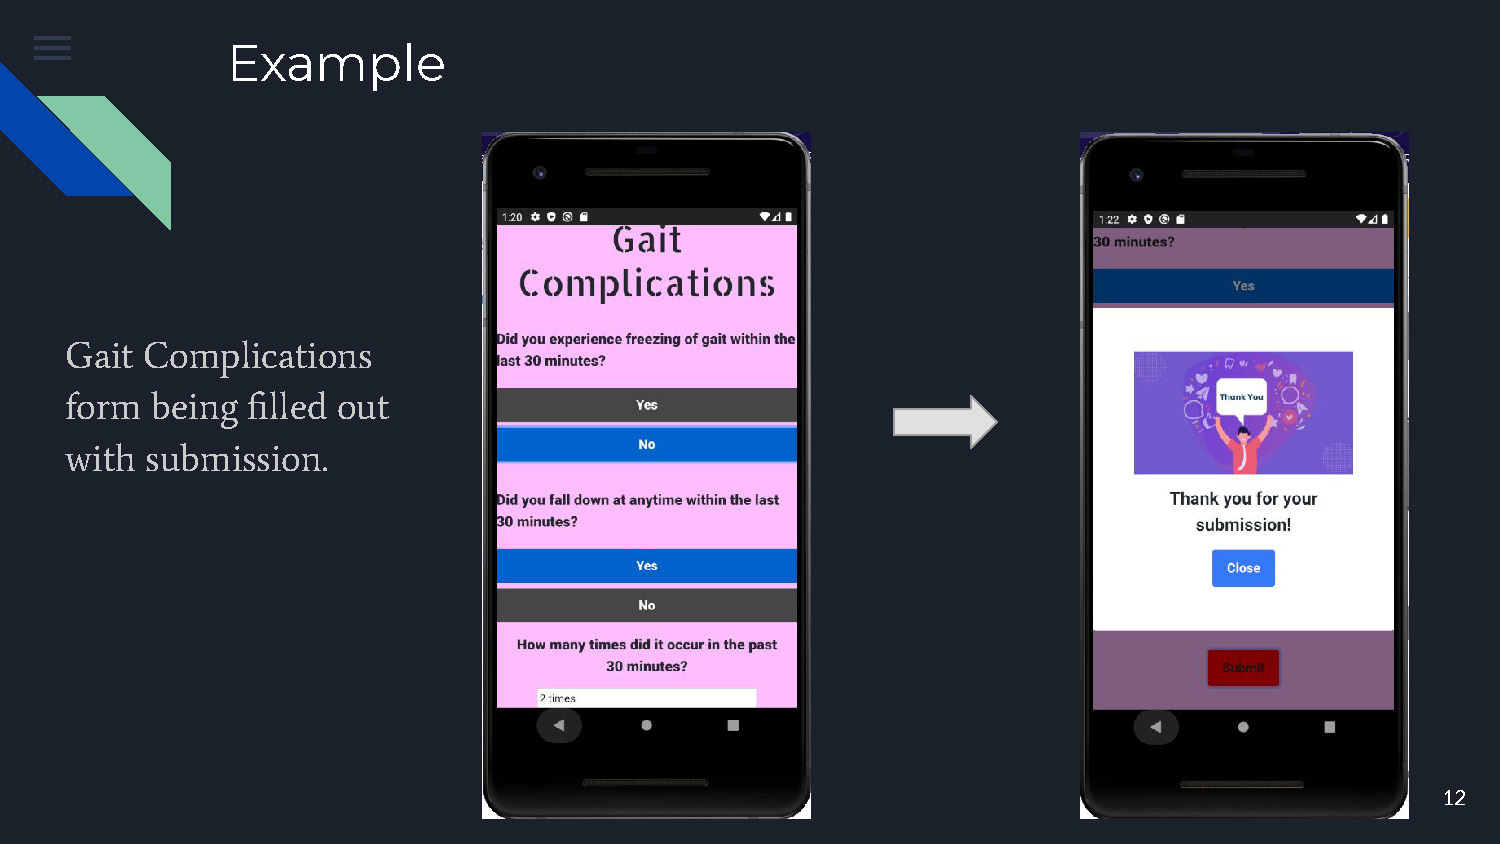
Gait Complications form being filled out with submission.
This slide shows a practical example of the mobile application interface where users can input information about their gait complications and submit the form.
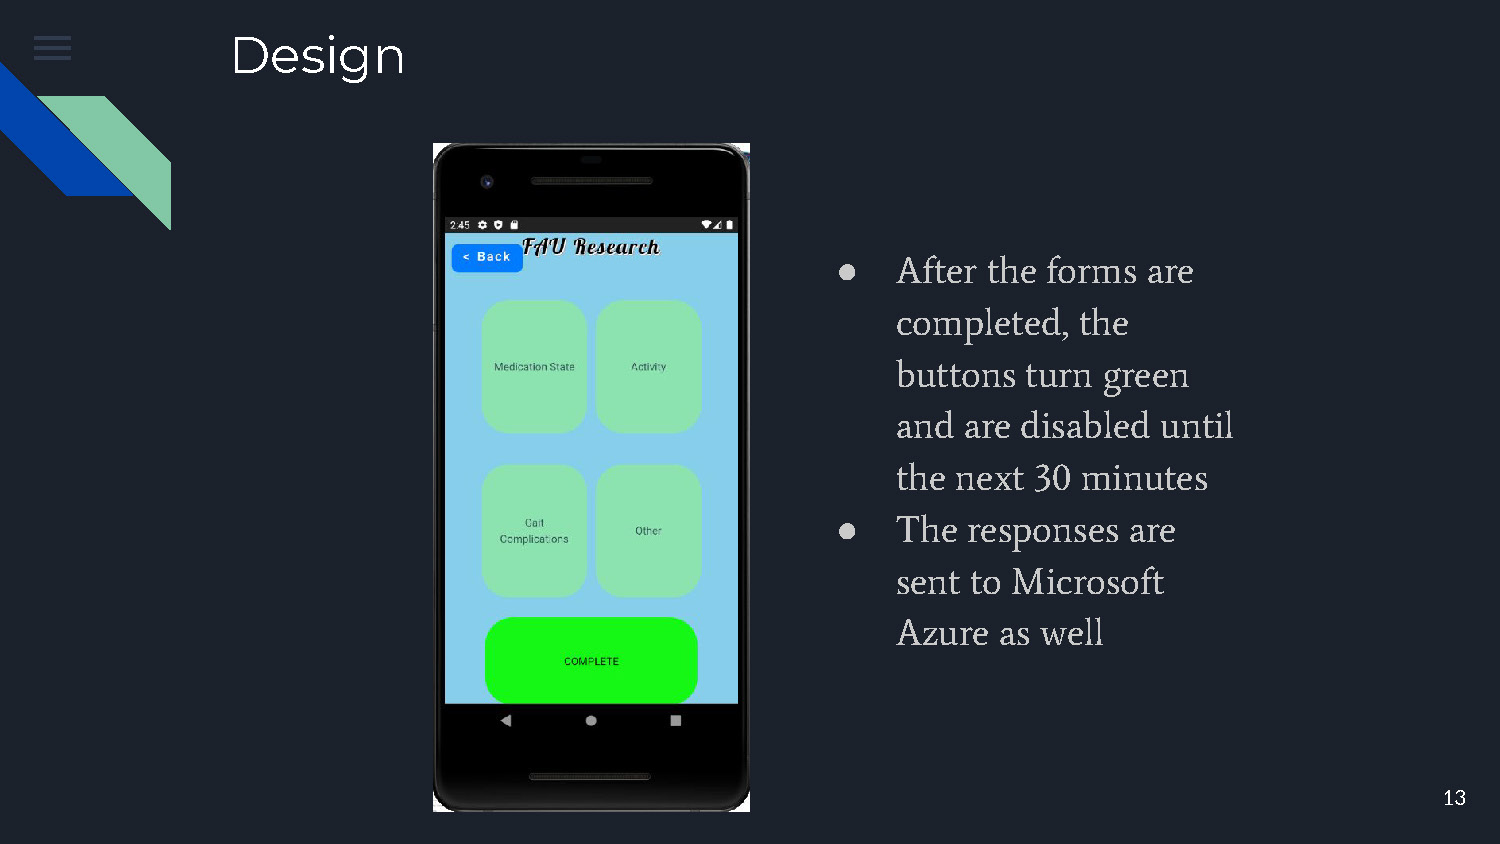
Design
- After the forms are completed, the buttons turn green and are disabled until the next 30 minutes
- The responses are sent to Microsoft Azure as well
Conclusion & Future Work
- Develop an efficient system of collecting critical information of a patient diagnosed with Parkinson's Disease
- Perform trial runs with using the watch and mobile application for the entire duration of the day
- Ensure the Watch application does not crash

Thank you!

End of Presentation
Click the right arrow to return to the beginning of the slide show.
For a downloadable version of this presentation, email: I-SENSE@FAU.