Soft Sensors and Actuators for Wearables to Assist People with Disabilities
Mentor: Erik Engeberg, PhD
Acknowledgments: Maohua Lin, Rudy Paul, Darryl Dieujuste, Moaed Abd
Scholar: James Jones
Home Institution: Boise State University
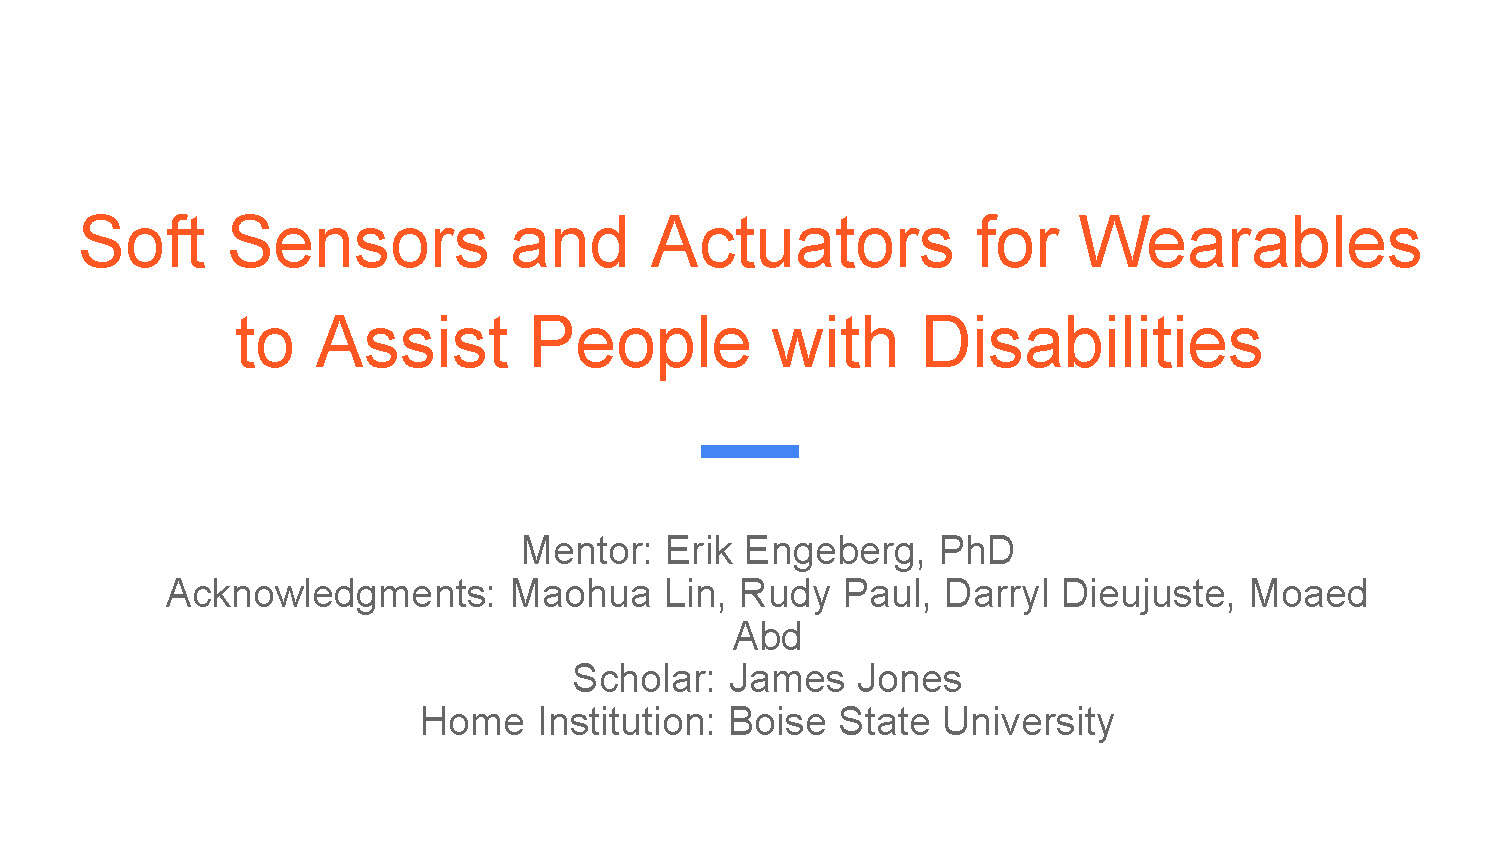
Wearable Soft Robotic Actuator
Fig. 1. Bare Exoskeleton
Fig. 2. Exoskeleton worn on Hand
This slide displays two images showing the soft robotic actuator device - first as a bare exoskeleton structure, and second demonstrating how it is worn on a human hand.
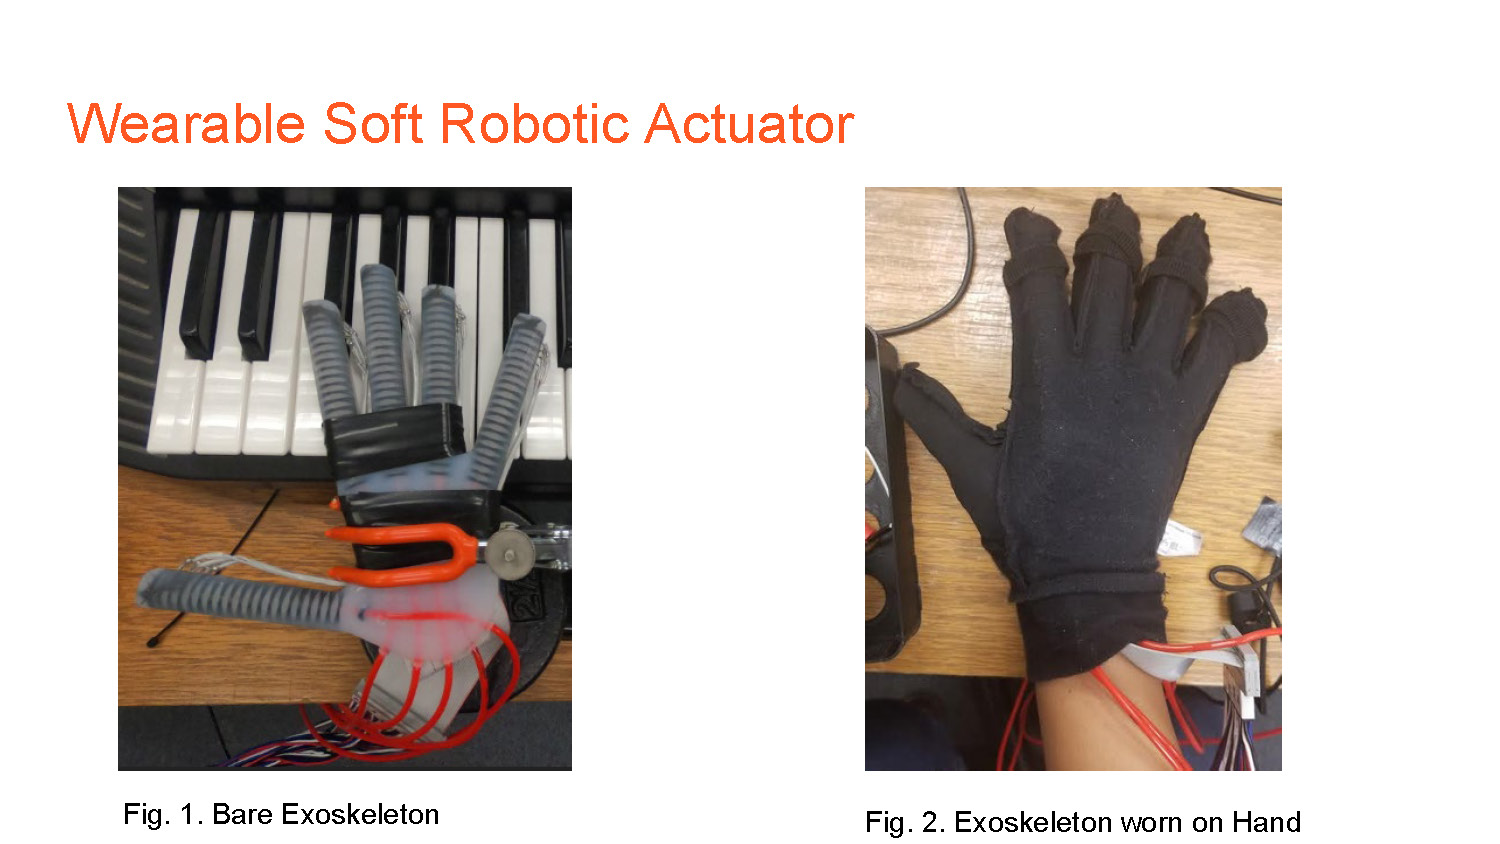
Myo Armband
Fig. 3. Tatarian, K., et al., (2018).
This slide shows the Myo Armband, which is a wearable sensor device used for electromyography (EMG) signal detection.
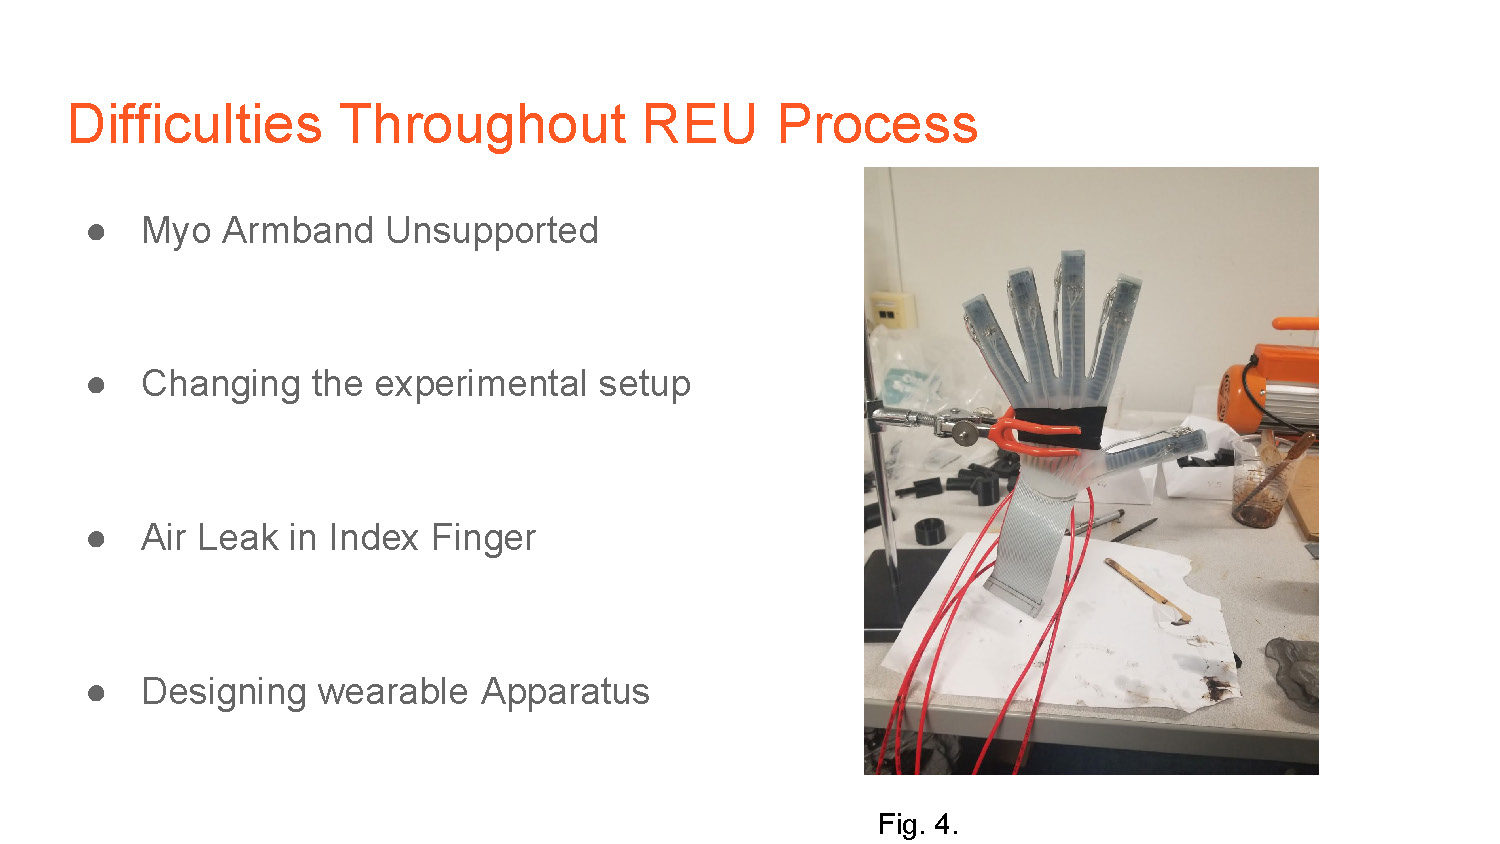
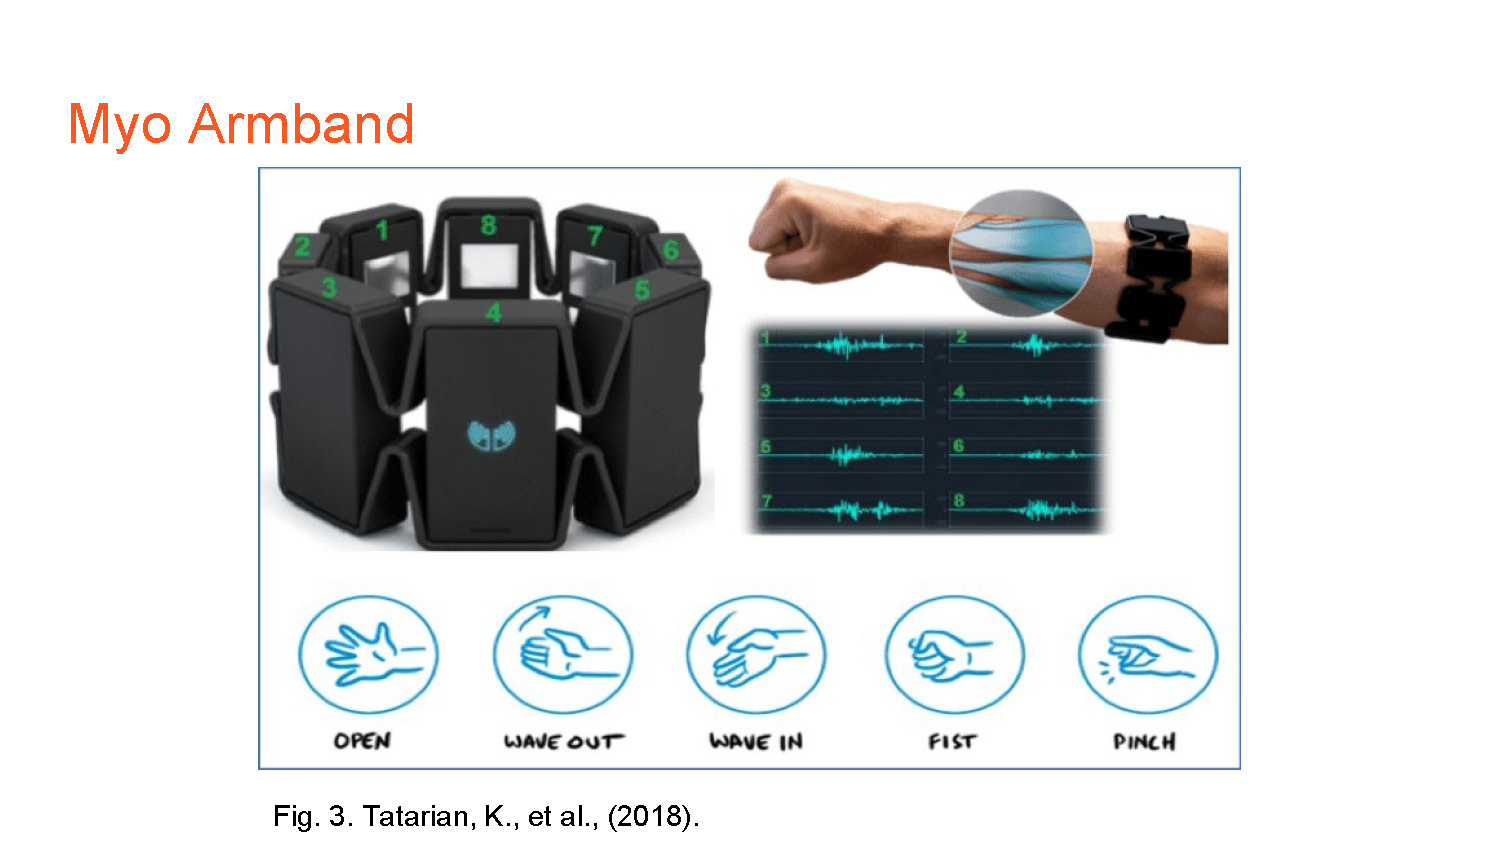
Difficulties Throughout REU Process
- Myo Armband Unsupported
- Changing the experimental setup
- Air Leak in Index Finger
- Designing wearable Apparatus
Results
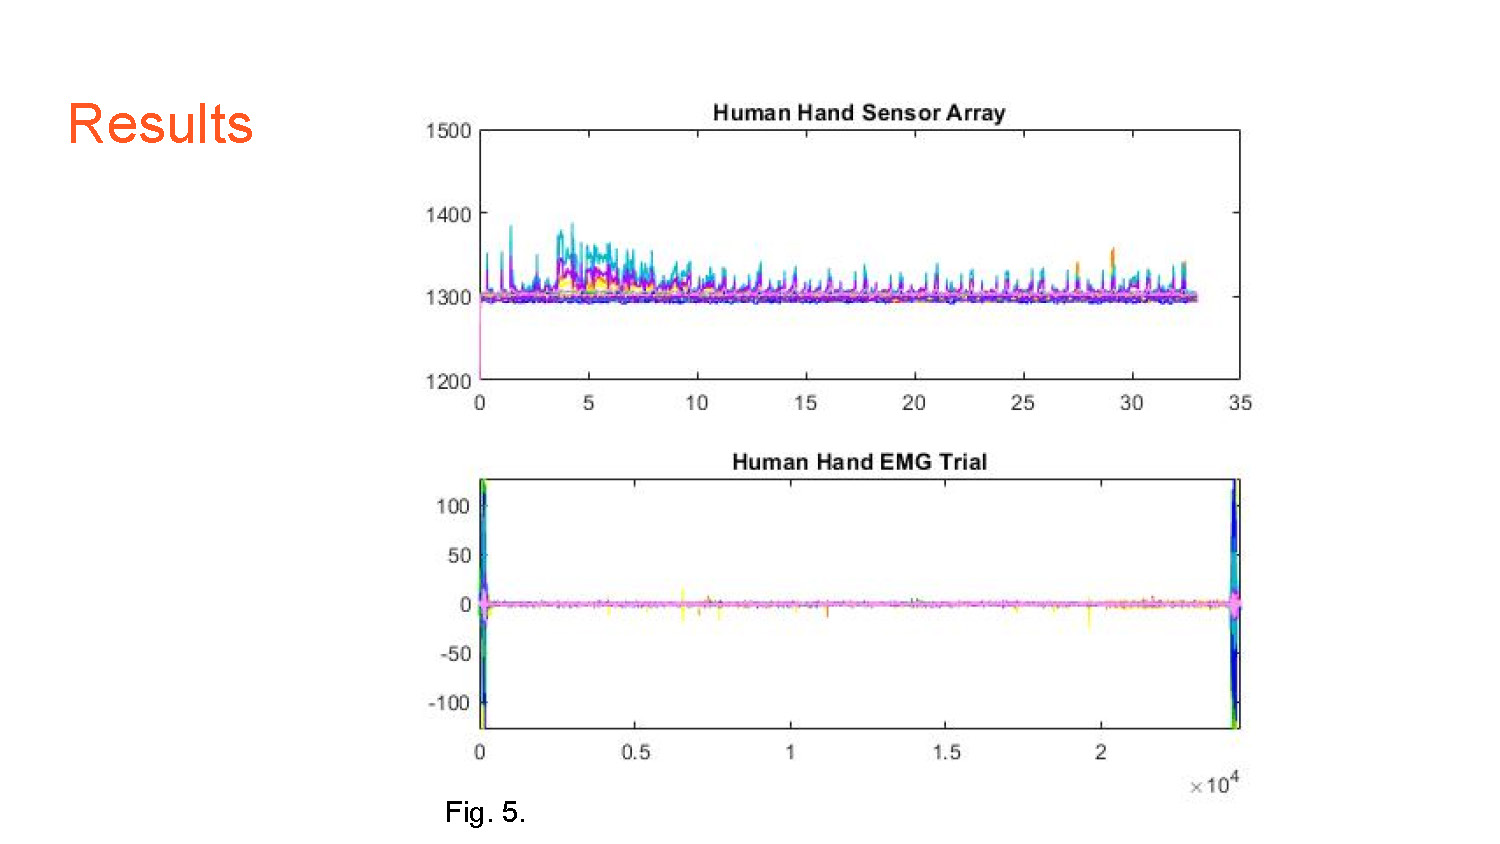
Figure 5:
Two Graphs: The top plot, "Human Hand Sensor Array," shows multiple colored lines fluctuating between 1200 and 1400 on the Y-axis over a time period of 0 to 35 on the X-axis. The bottom plot, "Human Hand EMG Trial," displays multiple colored lines ranging from -100 to 100 on the Y-axis over a time period of 0 to 2 multiplied by 104 on the X-axis.
Results
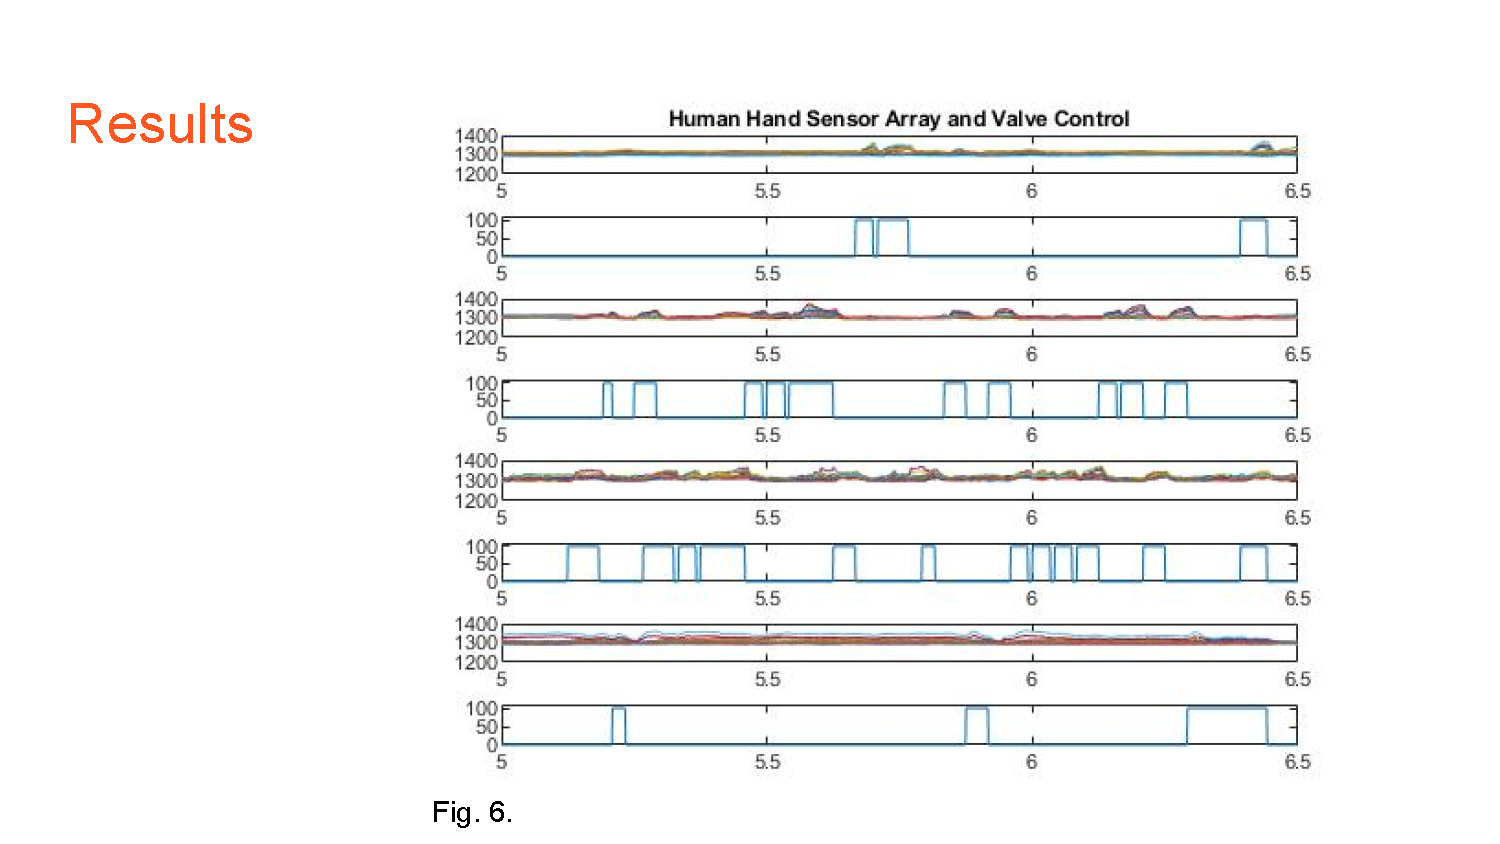
Figure 6:
Titled "Human Hand Sensor Array and Valve Control," this figure consists of four pairs of plots stacked vertically. Each pair has a top plot showing multiple colored lines fluctuating between 1200 and 1400 on the Y-axis, and a bottom plot with a blue line that's either at 0 or 100 on the Y-axis. The X-axis for all eight plots is labeled from 5 to 6.5.
Results
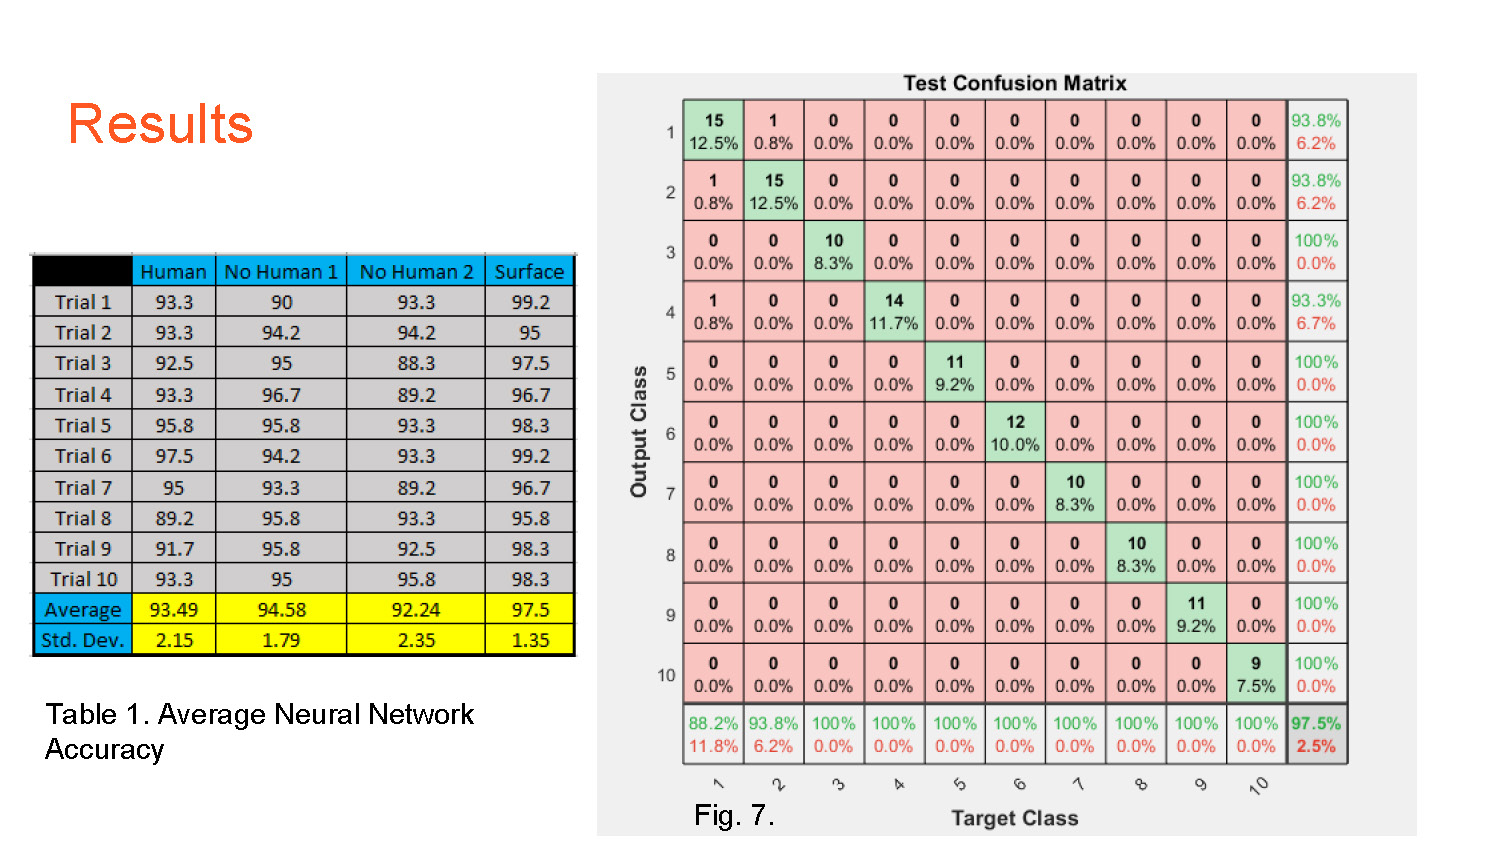
Figure 7:
This figure presents a table and a matrix. The table, "Table 1. Average Neural Network Accuracy," has four columns: "Human," "No Human 1," "No Human 2," and "Surface." It contains data for ten trials and rows for "Average" and "Std. Dev." The matrix, "Test Confusion Matrix," is a 10x10 grid with rows labeled "Output Class" and columns labeled "Target Class." The cells contain numbers and percentages, with some cells highlighted in green.
Applications and Further Research
Video 1.
This slide contains a blank placeholder for a video with a video icon in the bottom left corner.
References
1. Tatarian, Karen & Couceiro, Micael & Ribeiro, Eduardo & Faria, Diego. (2018). Stepping-stones to Transhumanism: An EMG-controlled Low-cost Prosthetic Hand for Academia. 10.1109/IS.2018.8710489.

End of Presentation
Click the right arrow to return to the beginning of the slide show.
For a downloadable version of this presentation, email: I-SENSE@FAU.