Physics Informed Domain Adaptation

By: Greg Tystahl
Advised by: Dr. Tang and Yu Huang
Background
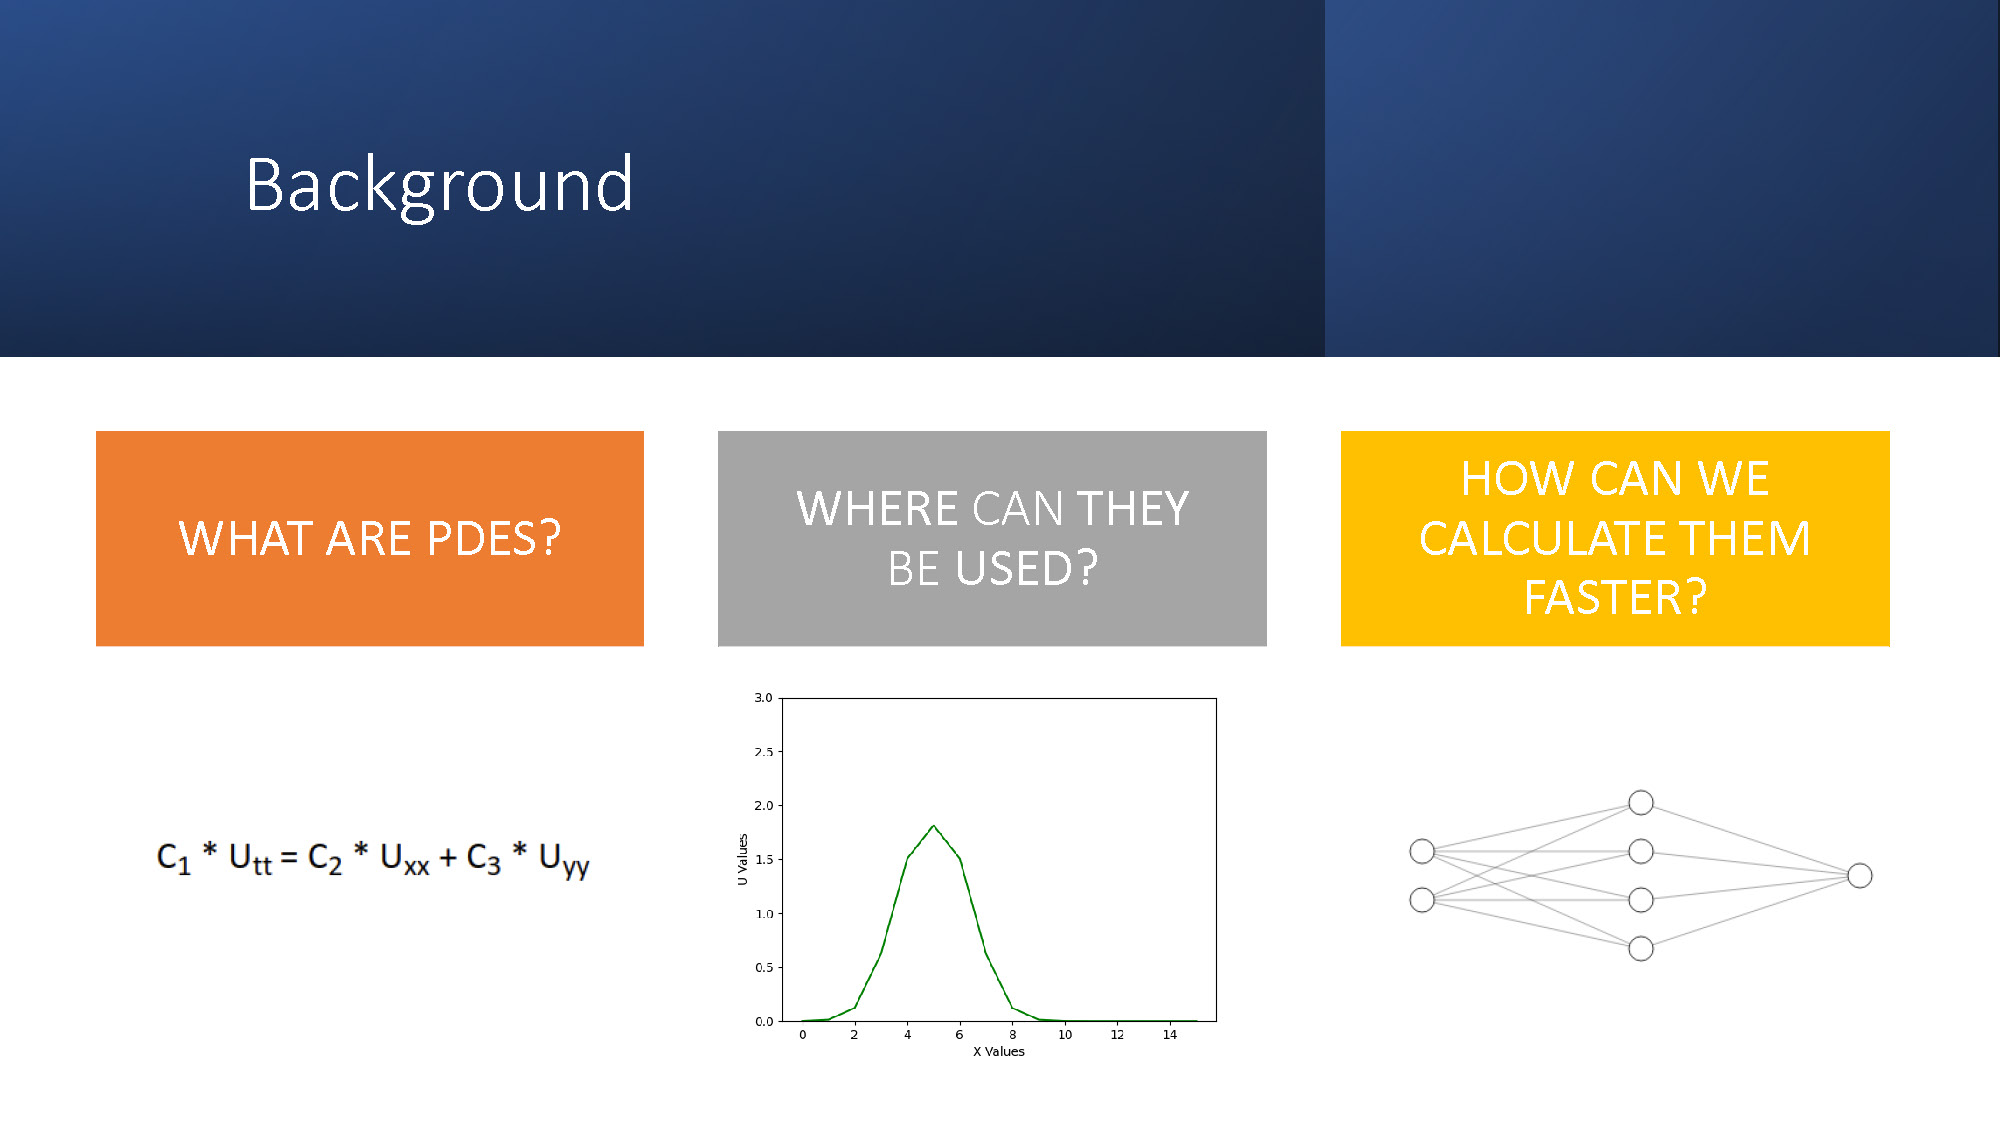
WHAT ARE PDES?
C1 * Utt = C2 * Uxx + C3 * Uyy
WHERE CAN THEY BE USED?
HOW CAN WE CALCULATE THEM FASTER?

Purpose
Pinns require data to be trained
What if we can train them with different domain data?
Literature Method
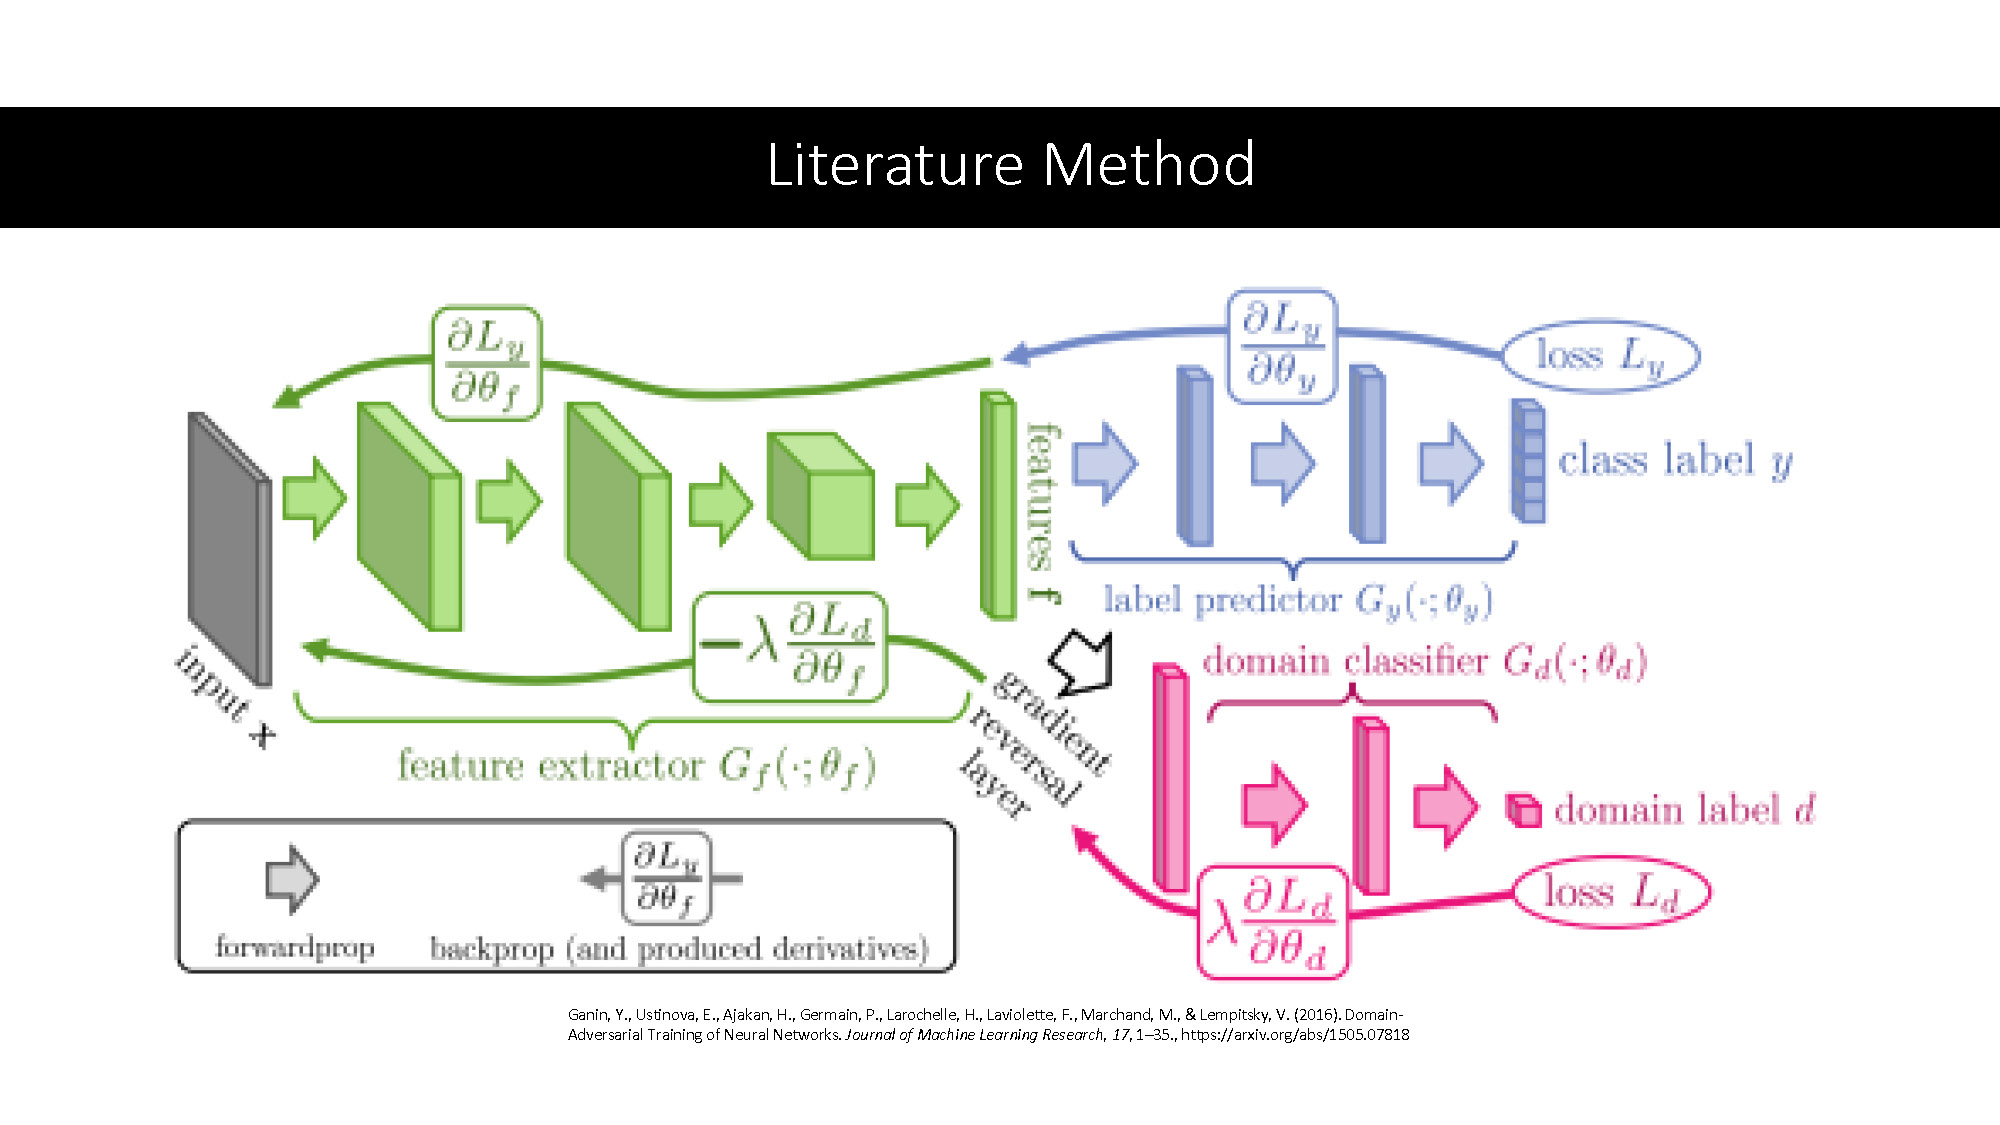
A flowchart illustrating a deep learning model. The chart is made up of colored blocks and arrows that show data flow and various mathematical notations like partial derivatives ($\frac{\partial L_y}{\partial \theta_f}$, $\frac{\partial L_y}{\partial \theta_y}$, etc.) and loss functions ($L_y$, $L_d$). The blocks are labeled "input x", "feature extractor", "features f", "label predictor", "class label y", "domain classifier", and "domain label d". A "gradient reversal layer" is depicted as an arrow with a label. The text at the bottom provides a citation: "Ganin, Y., Ustinova, E., Ajakan, H., Germain, P., Larochelle, H., Laviolette, F., Marchand, M., & Lempitsky, V. (2016). Domain-Adversarial Training of Neural Networks. Journal of Machine Learning Research, 17, 1–35. https://arxiv.org/abs/1510.07618".
Proposed Method
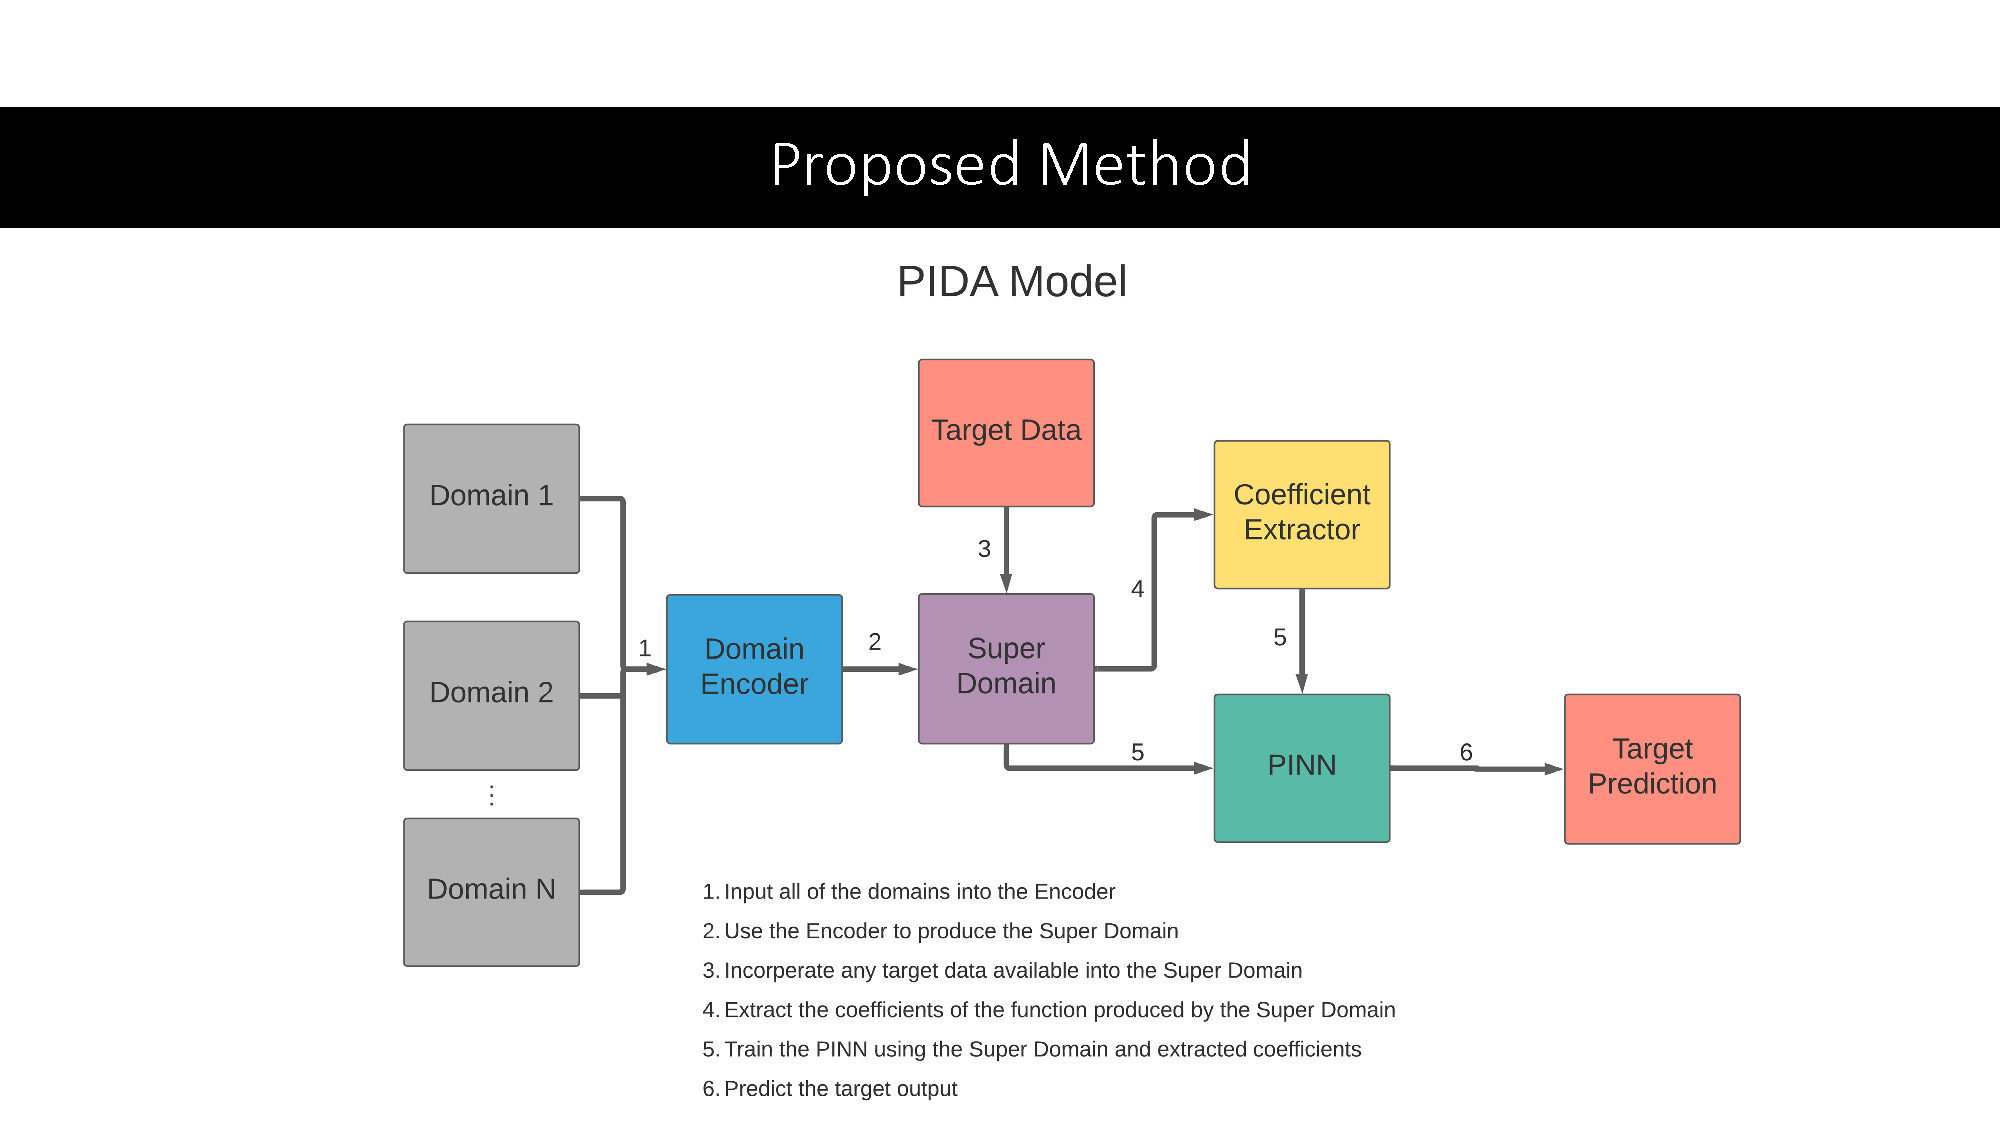
A diagram of a "PIDA Model". The diagram consists of labeled rectangular blocks with arrows connecting them. The blocks are labeled "Domain 1", "Domain 2", "Domain N", "Domain Encoder", "Super Domain", "Target Data", "Coefficient Extractor", "PINN", and "Target Prediction". The arrows are numbered 1 through 6, and a numbered list below the diagram provides a description for each step. The list is as follows: "1. Input all of the domains into the Encoder", "2. Use the Encoder to produce the Super Domain", "3. Incorporate any target data available into the Super Domain", "4. Extract the coefficients of the function produced by the Super Domain", "5. Train the PINN using the Super Domain and extracted coefficients", "6. Predict the target output".
Initial Results
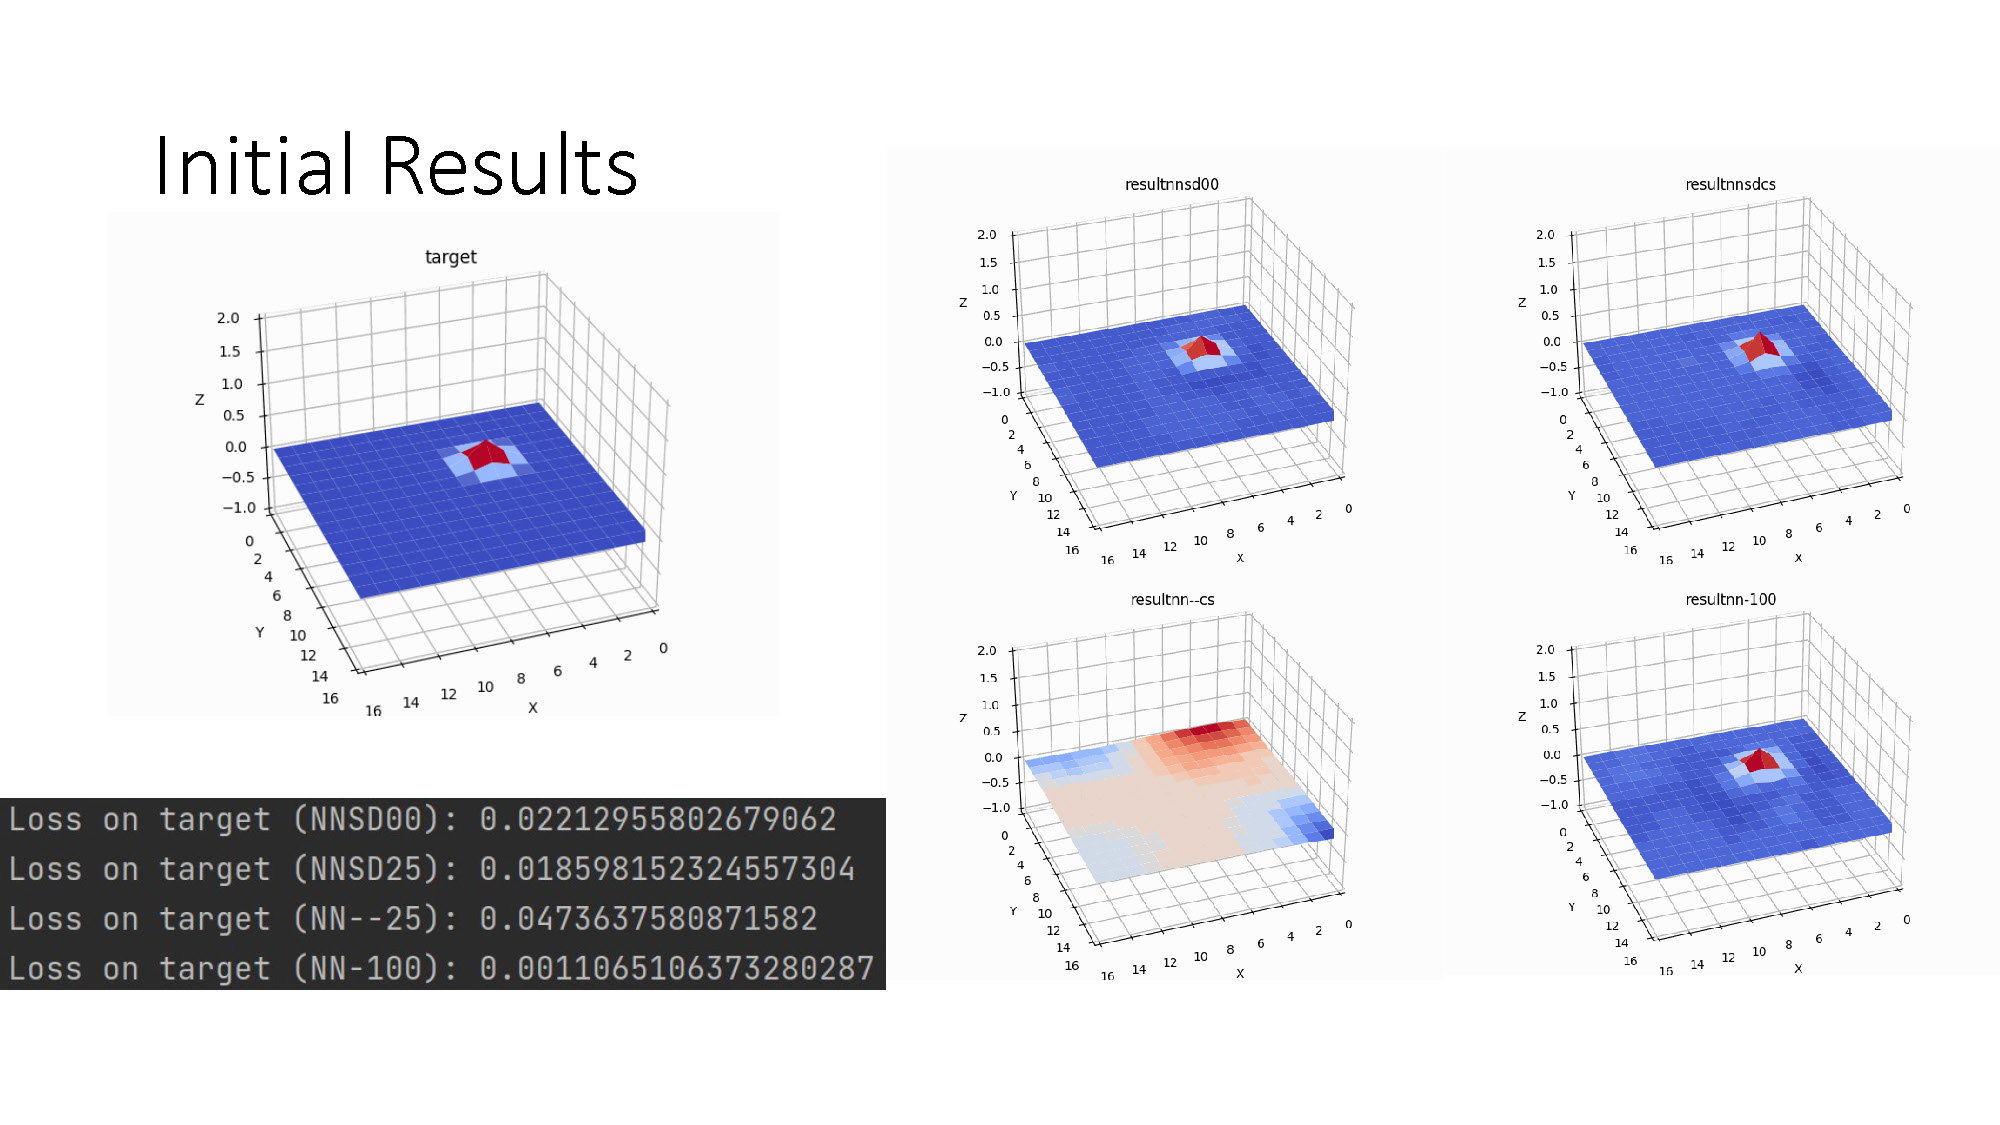
A set of five 3D graphs and a text box with numerical data. The graph in the top left is titled "target" and shows a flat blue and red square surface with a small, raised red cube in the center. The remaining four graphs, titled "result-nsd00", "result-nsd25", "result-nn-cs", and "result-nn-100", also display 3D surfaces with varying color patterns and raised sections. All five graphs have x, y, and z axes labeled with numbers. Below the graphs is a text box containing four lines of text, each starting with "Loss on target" followed by parenthetical text and a numerical value. For example, the first line reads: "Loss on target (NNSD00): 0.02212955882679062".
Where to go next
- Improve the way the target data is incorporated into the super domain
- Do more tests on differing amounts of target data available
- Choose domains that have coefficients similar to the target domain

End of Presentation
Click the right arrow to return to the beginning of the slide show.
For a downloadable version of this presentation, email: I-SENSE@FAU.