Marine Hydrokinetic Turbine Optimization through Control Co-Design
Presenter: Austin Snyder
Advisors: Dr. Yufei Tang, Arezoo Hasankhani
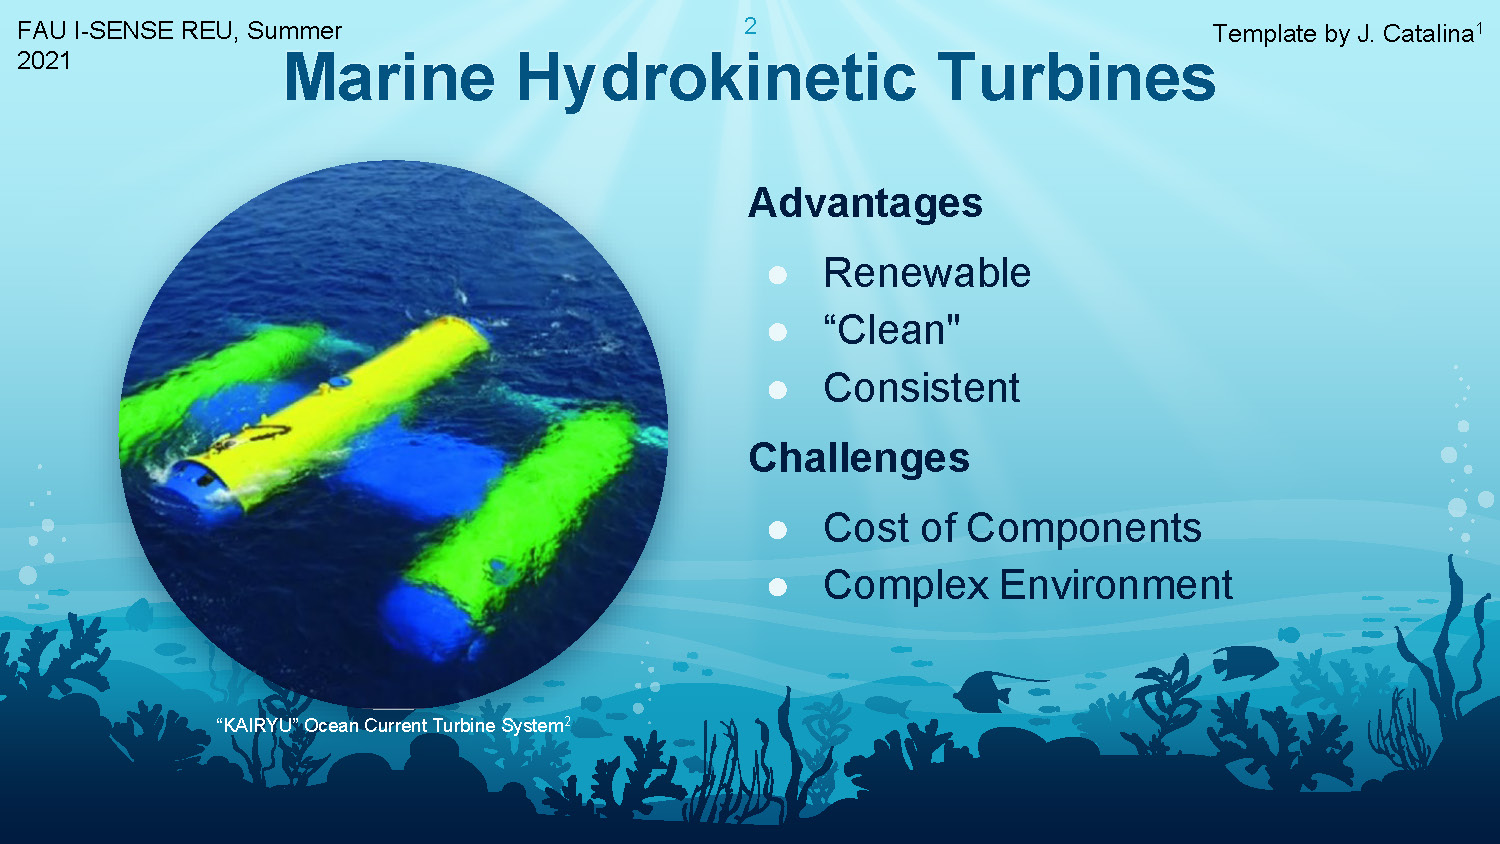
Marine Hydrokinetic Turbines
Advantages
- Renewable
- "Clean"
- Consistent
Challenges
- Cost of Components
- Complex Environment
Image of "KAIRYU" Ocean Current Turbine System
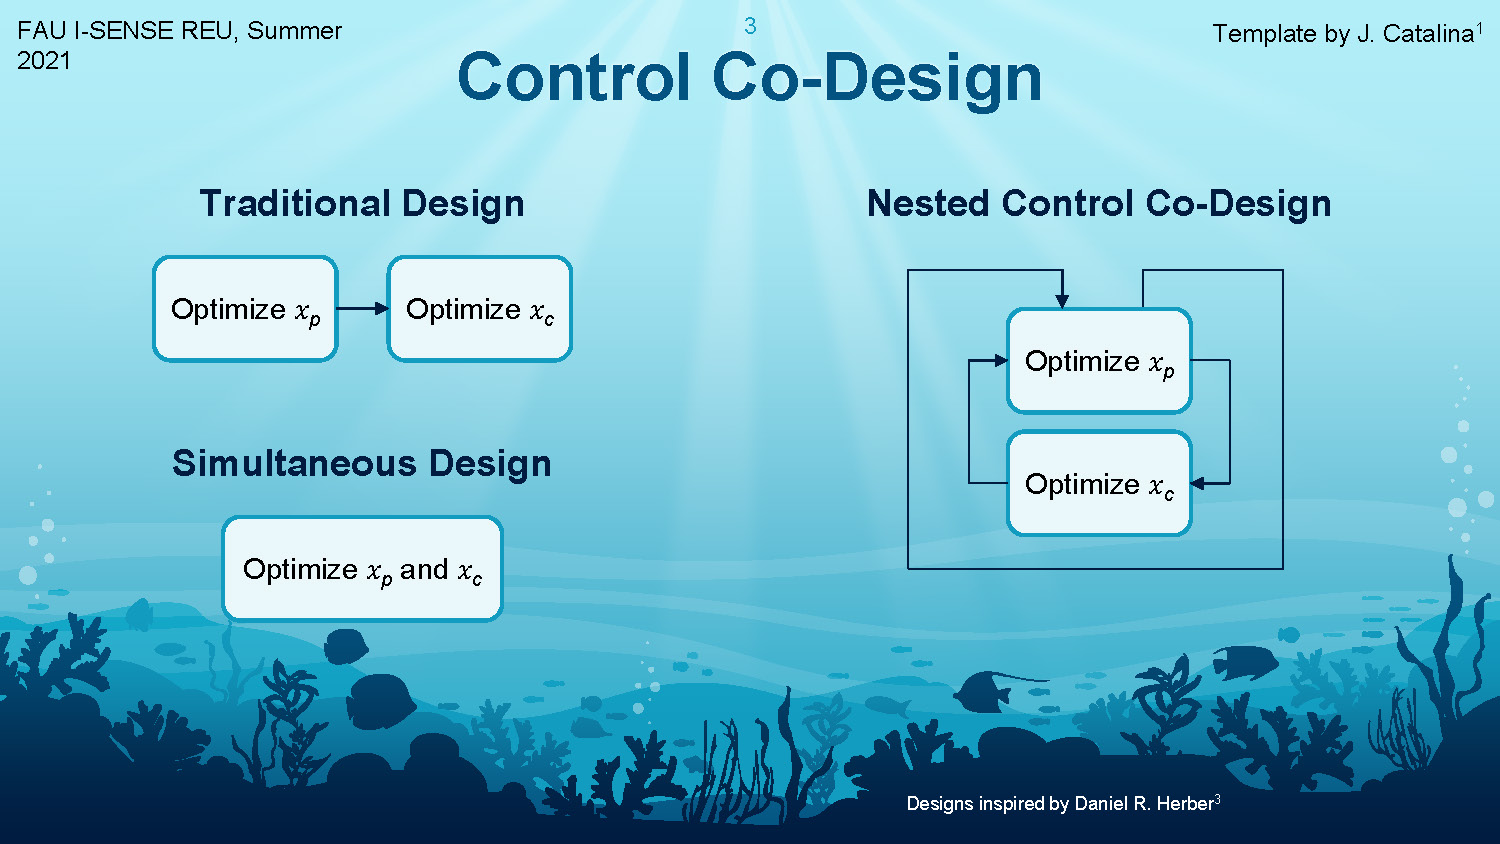
Control Co-Design
Three optimization approaches are shown in flowchart format:
Traditional Design
Sequential process: Optimize xp, then Optimize xc
Nested Control Co-Design
Nested process: Optimize xc, then Optimize xp
Simultaneous Design
Concurrent process: Optimize xp and xc simultaneously
Designs inspired by Daniel R. Herber
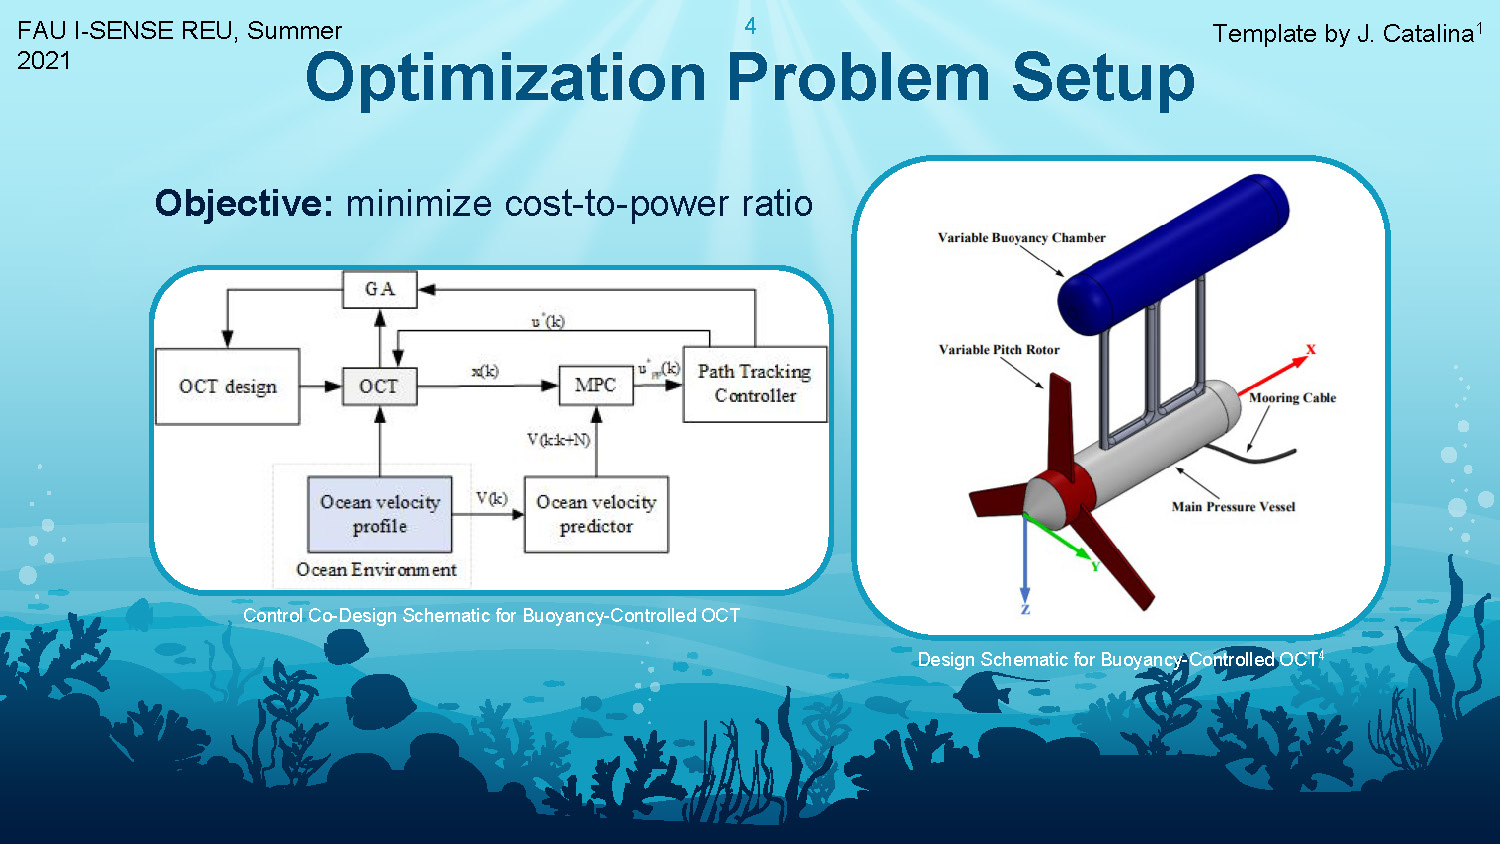
Optimization Problem Setup
Objective: minimize cost-to-power ratio
Control Co-Design Schematic for Buoyancy-Controlled OCT
System control diagram illustrating the control co-design approach for the buoyancy-controlled ocean current turbine.
Design Schematic for Buoyancy-Controlled OCT
Technical diagram showing the ocean current turbine design with buoyancy control system.
Preliminary Results
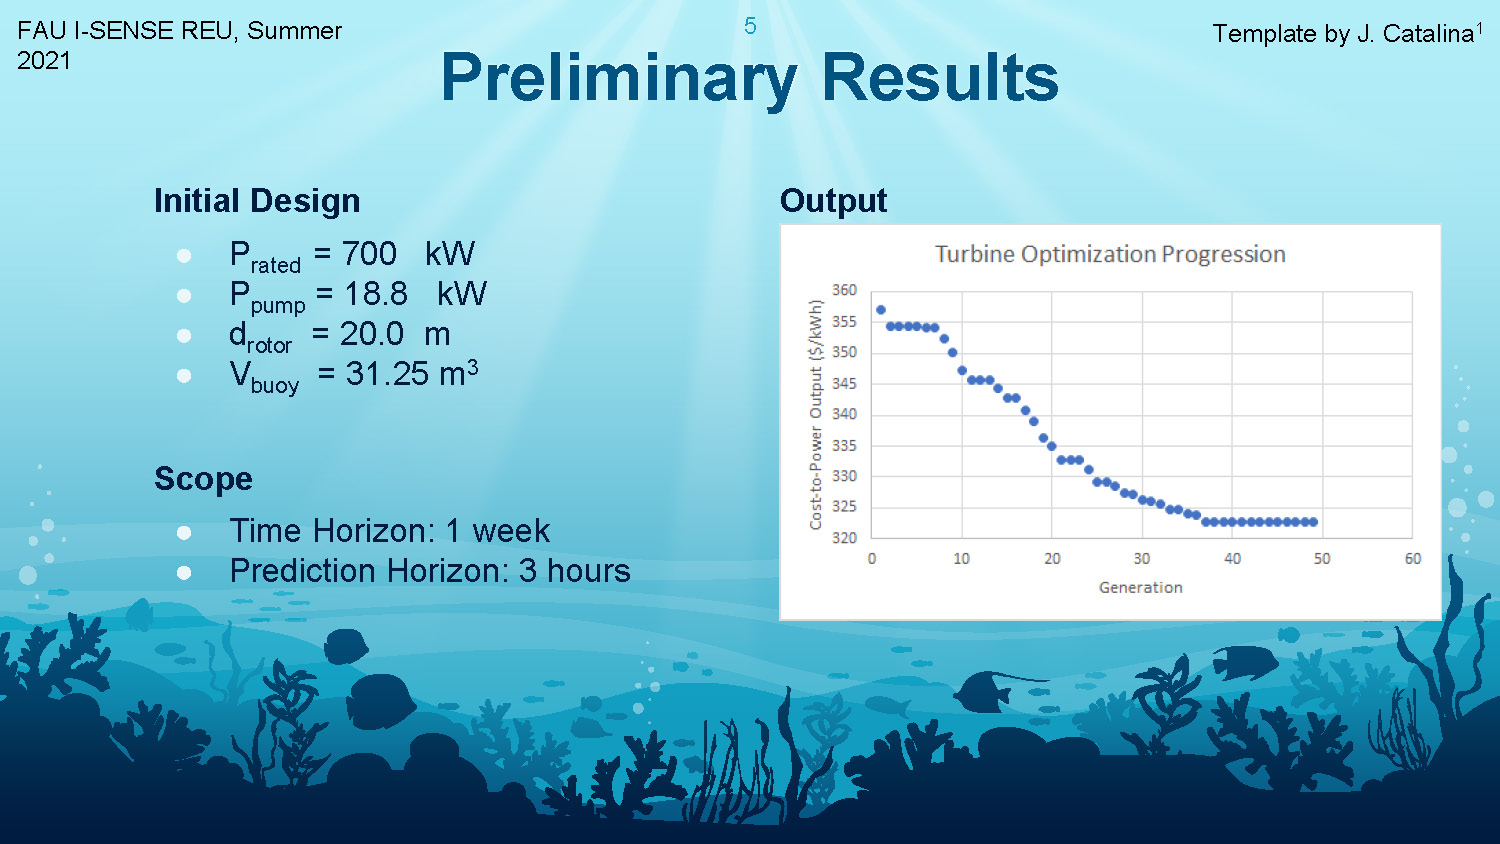
Initial Design
- Prated = 700 kW
- Ppump = 18.8 kW
- drotor = 20.0 m
- Vbuoy = 31.25 m3
Scope
- Time Horizon: 1 week
- Prediction Horizon: 3 hours
Output
Graph showing optimization results and performance metrics over time.
Conclusions & Next Steps
Future Plans
- ACC Paper Submission
- Generalized Application
Ongoing Work
- Reduce Time Complexity
- Linear Model Approximations
- Standardize Cost & Weight
Image: ACC 2022 Logo
References
[1] Catalina, J. (n.d.). Blue Ocean. Slides Carnival; Piensa en Pixels. https://www.slidescarnival.com/thaisa-free-presentation-template/10437
[2] Dodo, Y., et al. (2019). Development and Design of a Floating Type Ocean Current Turbine System. Practical Design of Ships and Other Floating Structures, 732–755. https://doi.org/https://doi.org/10.1007/978-981-15-4680-8_49
[3] Herber, D. R. Control Co-design Direct Transcription Solution Strategies: Overview and Challenges [PowerPoint slides]. Department of Systems Engineering, Colorado State University. https://www.engr.colostate.edu/~drherber/files/IDADS-Herber.pdf
[4] Hasankani, A., et al. (Unpublished). Modeling and Numerical Simulation of a Buoyancy Controlled Ocean Current Turbine
[5] American Control Conference (2022). [American Control Conference 2022 Logo]. Retrieved from https://acc2022.a2c2.org/

End of Presentation
Click the right arrow to return to the beginning of the slide show.
For a downloadable version of this presentation, email: I-SENSE@FAU.