RSSI as a Long-Term Localization Metric
Research presented by Nathan Hurtig, Maren Sorber, and Artemis Pados under the guidance of Dr. Jason Hallstrom.
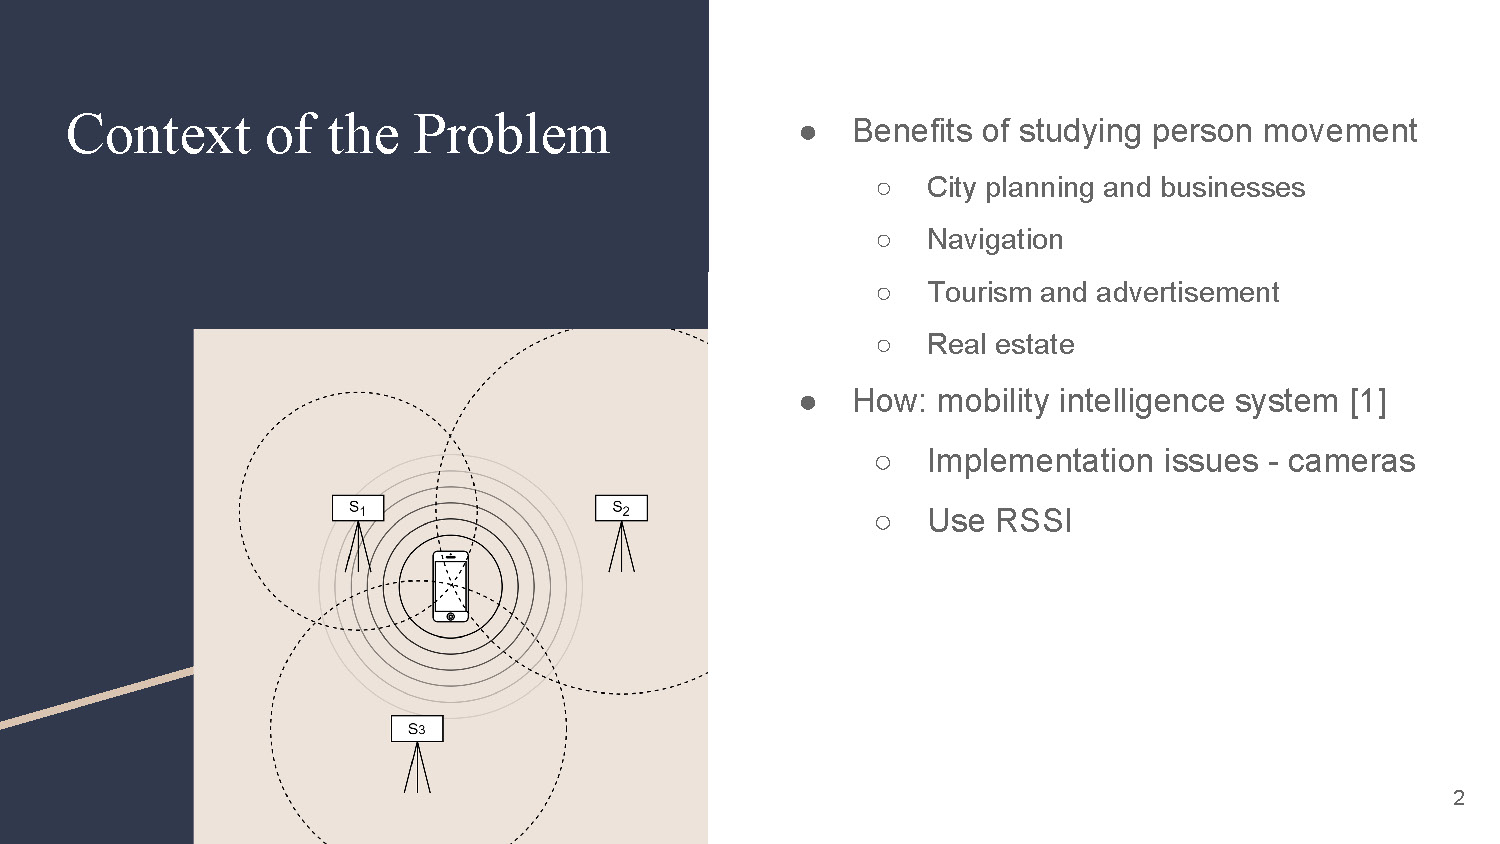
Context of the Problem
Benefits of studying person movement
- City planning and businesses
- Navigation
- Tourism and advertisement
- Real estate
How: mobility intelligence system [1]
- Implementation issues - cameras
- Use RSSI
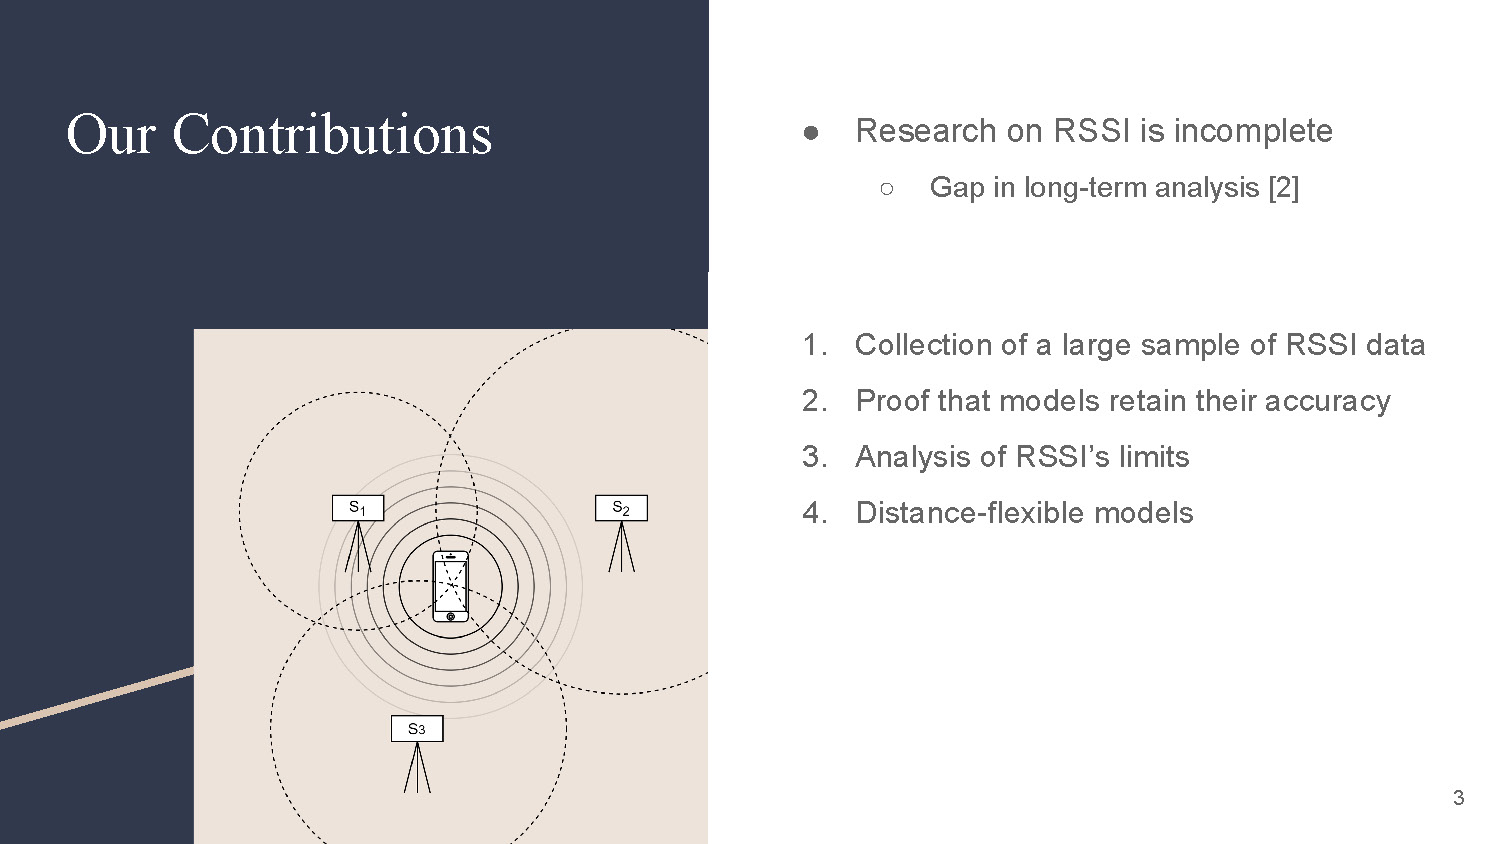
Our Contributions
Research on RSSI is incomplete
Gap in long-term analysis [2]
- Collection of a large sample of RSSI data
- Proof that models retain their accuracy
- Analysis of RSSI's limits
- Distance-flexible models
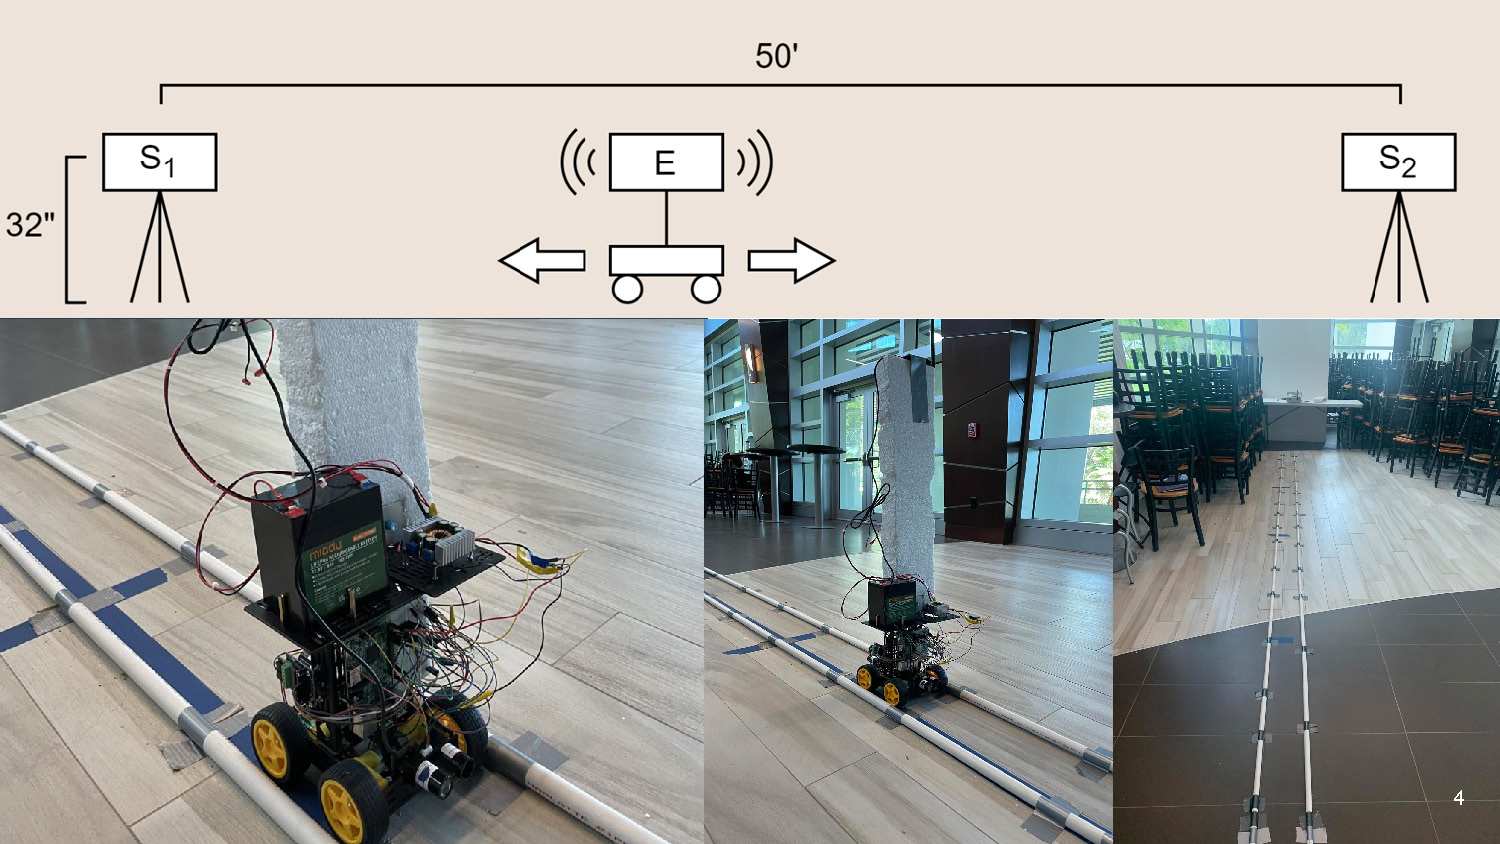
The slide shows a diagram and three photos of an experimental setup. The top diagram shows two squares labeled S1 and S2, separated by a line labeled 50', with another square labeled E and a wheeled object between them. Arrows point to the left and right. The height of S1 is labeled as 32". The bottom of the image has three photographs. The left photo shows a wheeled robot with exposed electronics, wires, and a battery on a track made of two white PVC pipes. The middle photo shows the same robot from a different angle, with a gray pillar in the background. The right photo shows a longer view of the track and the experimental area, including chairs and tables in the background.
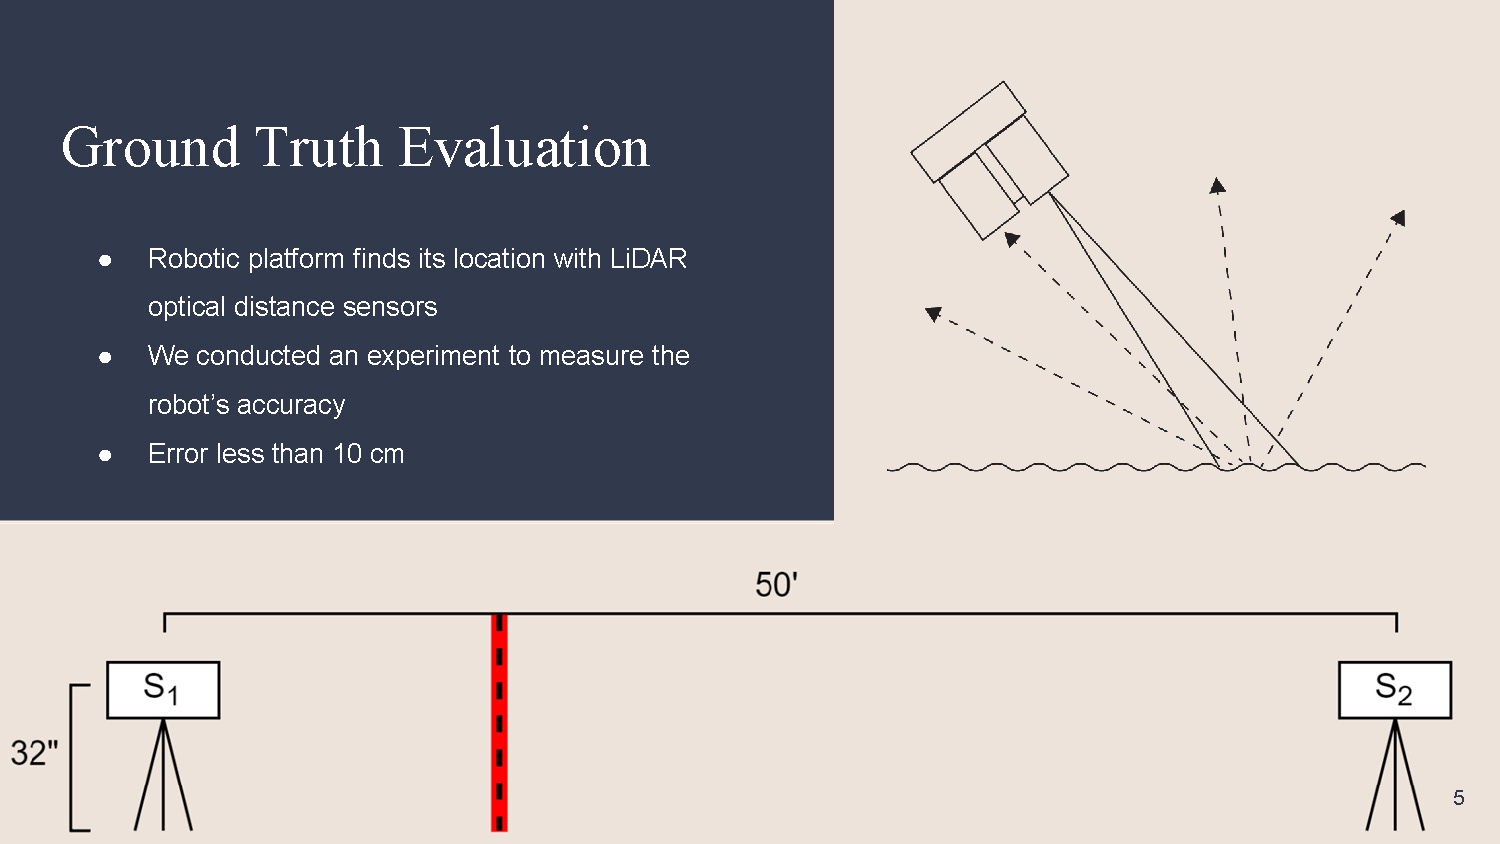
Ground Truth Evaluation
Robotic platform finds its location with LiDAR optical distance sensors
We conducted an experiment to measure the robot's accuracy
Error less than 10 cm
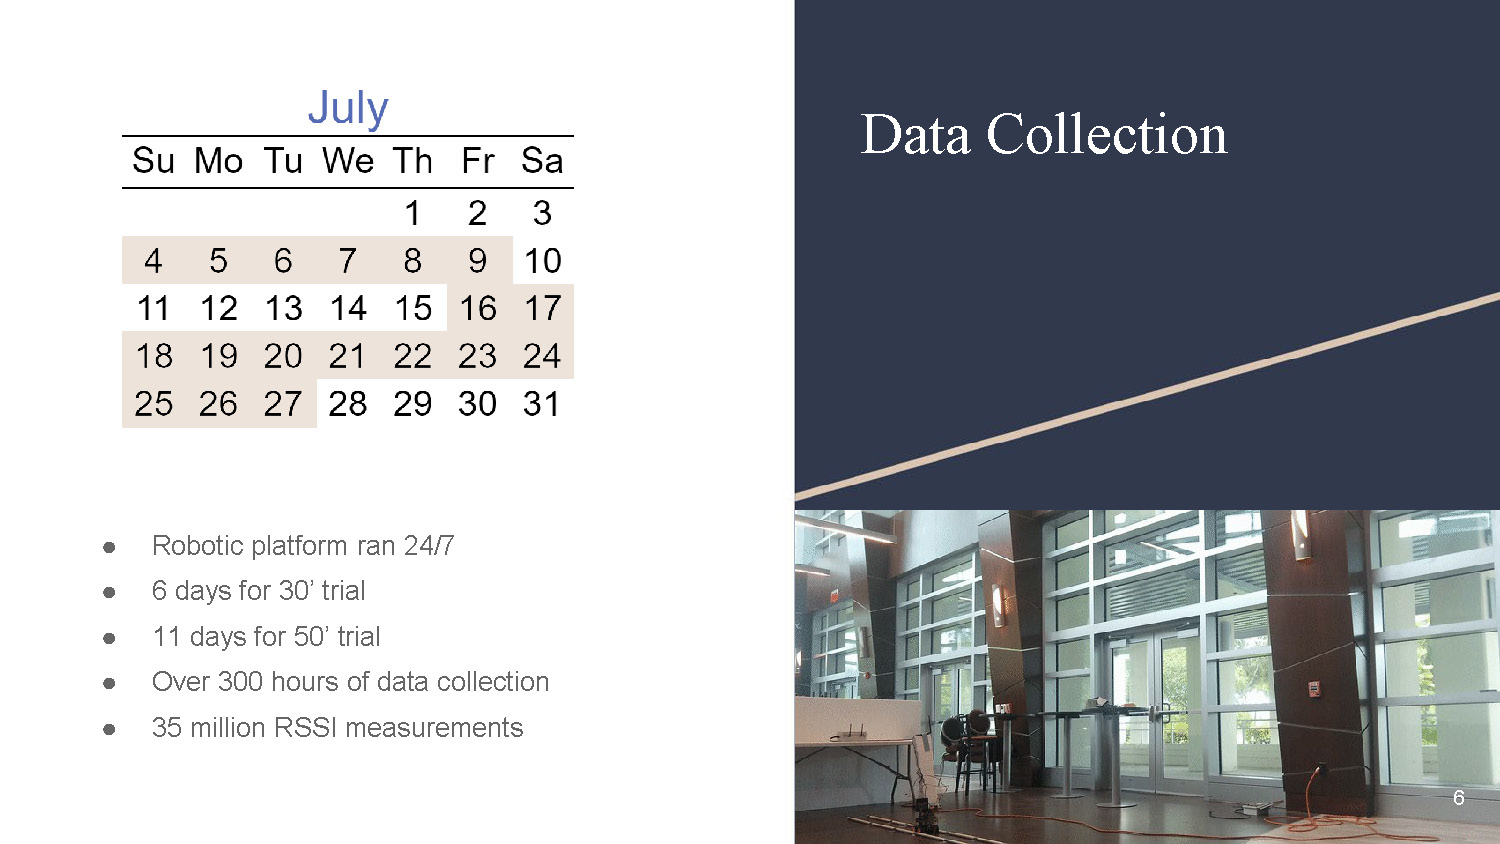
Data Collection
- Robotic platform ran 24/7
- 6 days for 30' trial
- 11 days for 50' trial
- Over 300 hours of data collection
- 35 million RSSI measurements
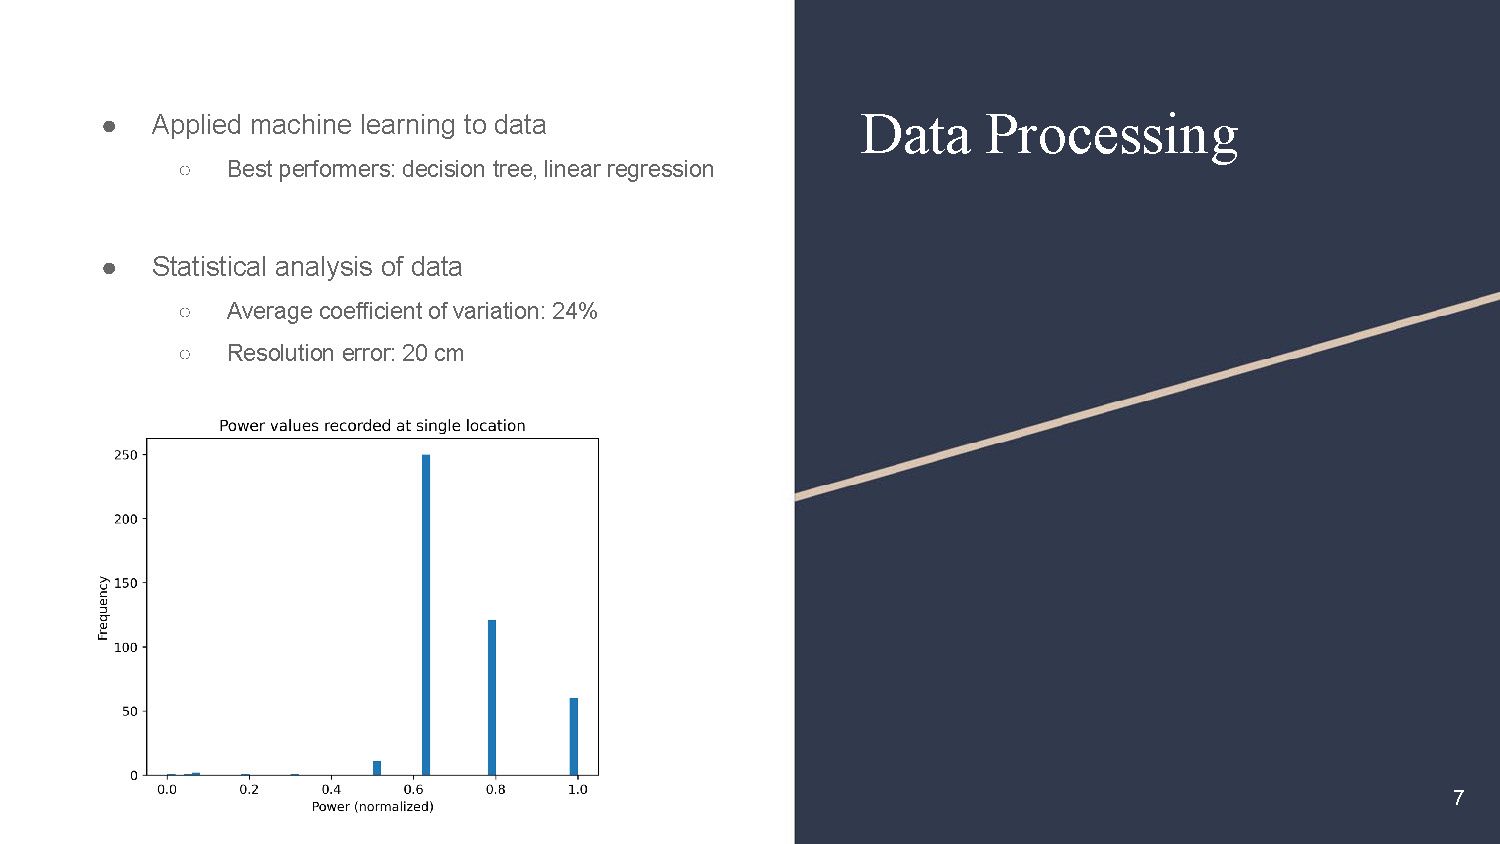
Data Processing
Applied machine learning to data
Best performers: decision tree, linear regression
Statistical analysis of data
- Average coefficient of variation: 24%
- Resolution error: 20 cm
There is a bar chart titled "Power values recorded at single location." The x-axis is "Power (normalized)" from 0.0 to 1.0, and the y-axis is "Frequency" from 0 to 250.
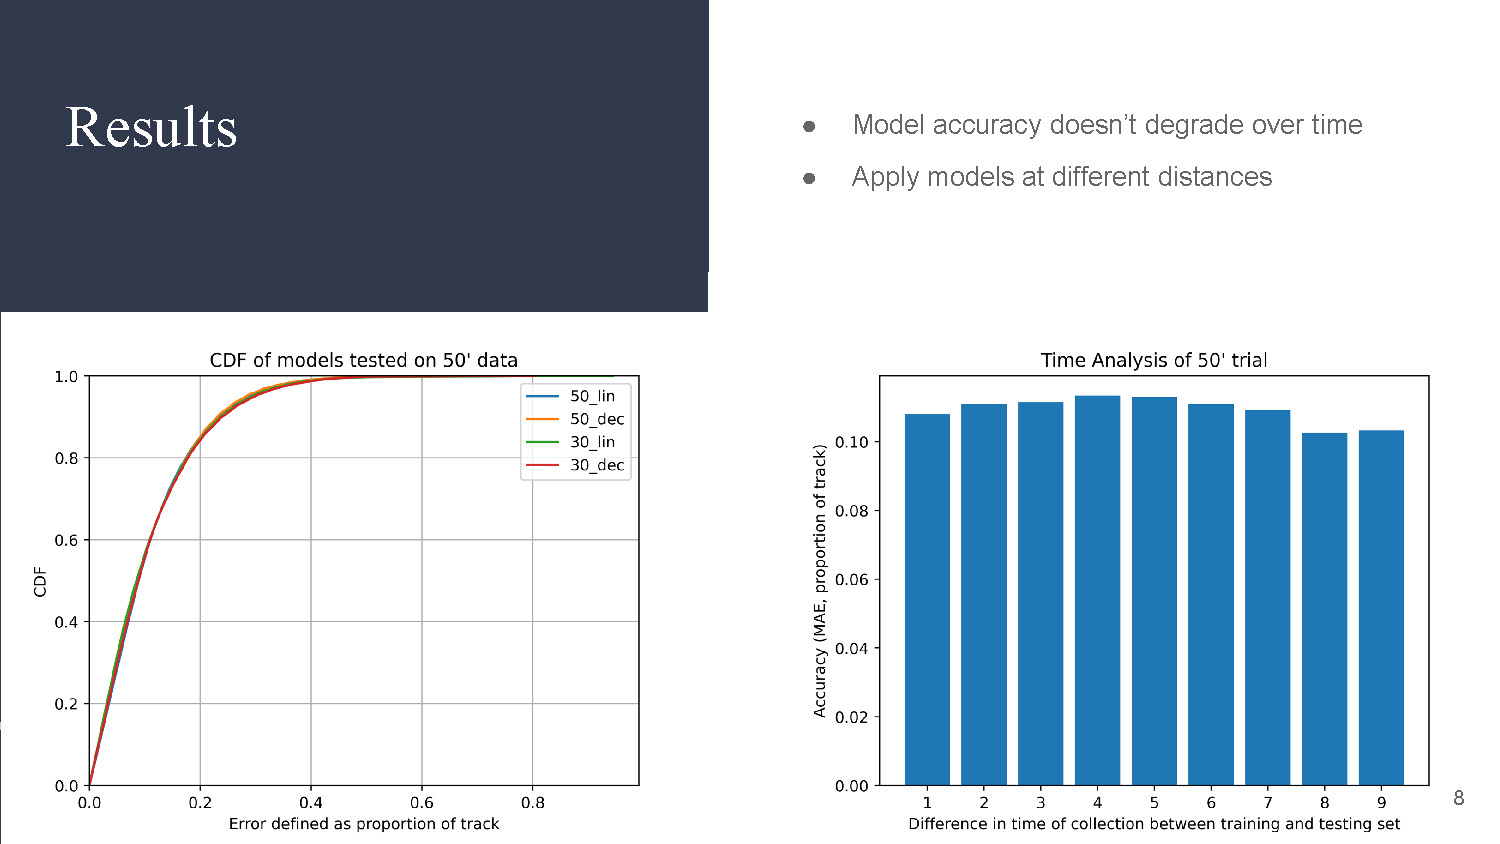
Results
Model accuracy doesn't degrade over time
Apply models at different distances
There is a CDF plot titled "CDF of models tested on 50' data," with four colored lines. The x-axis is "Error defined as proportion of track," and the y-axis is "CDF" from 0.0 to 1.0. The plot on the right is a bar chart titled "Time Analysis of 50' trial." The x-axis is labeled with numbers 1 through 8, and the y-axis is "Accuracy (MAE, proportion of track)" from 0.00 to 0.12.
Key Takeaways
- Our models are stable enough to remain accurate over long periods of time
- We can train models at one distance between sensors, and apply them to another distance
- RSSI localization accuracy has an upper bound
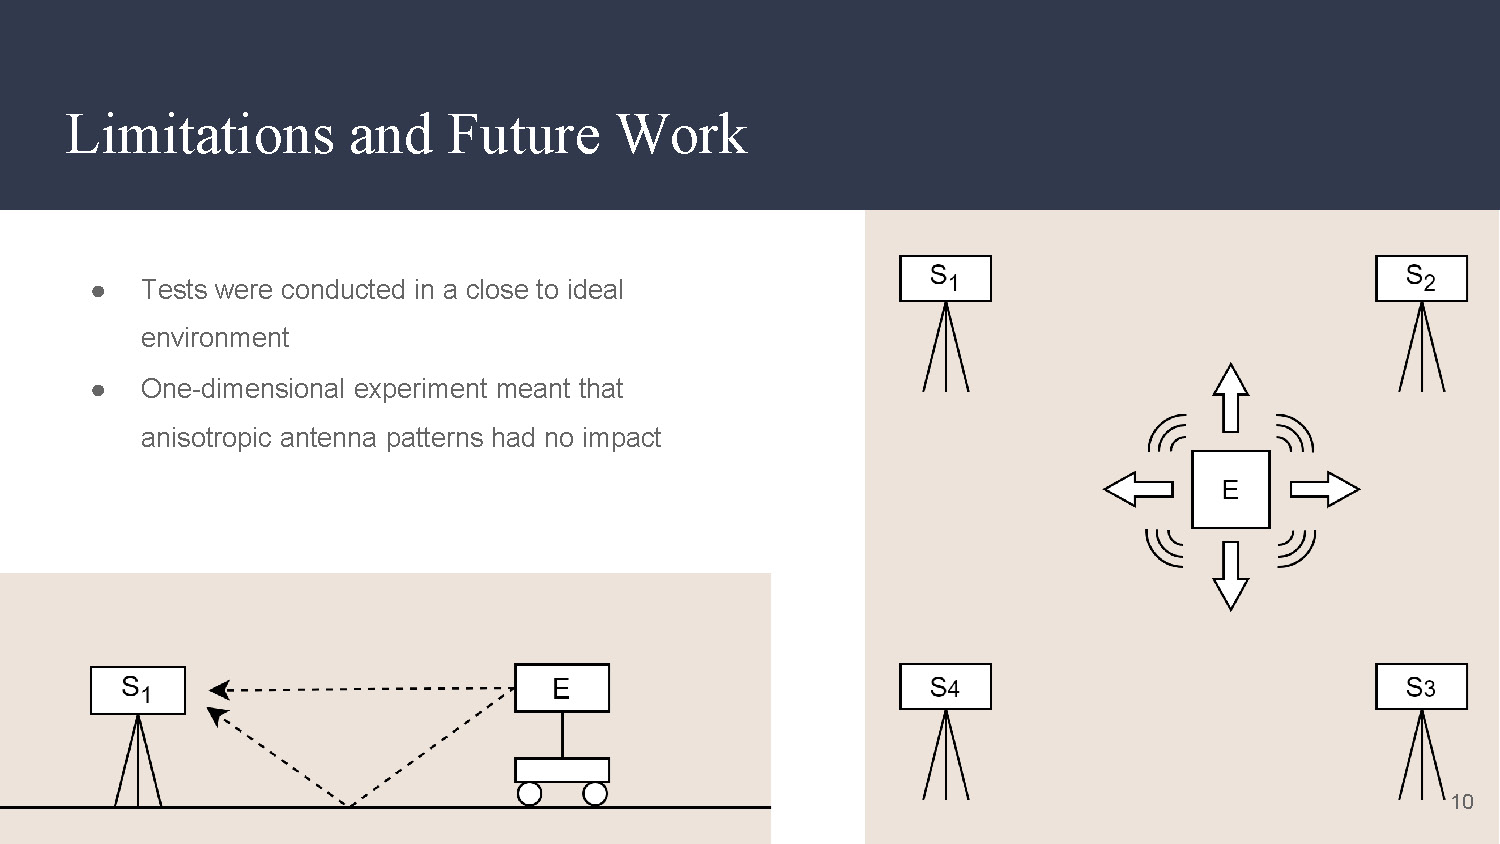
Limitations and Future Work
- Tests were conducted in a close to ideal environment
- One-dimensional experiment meant that anisotropic antenna patterns had no impact
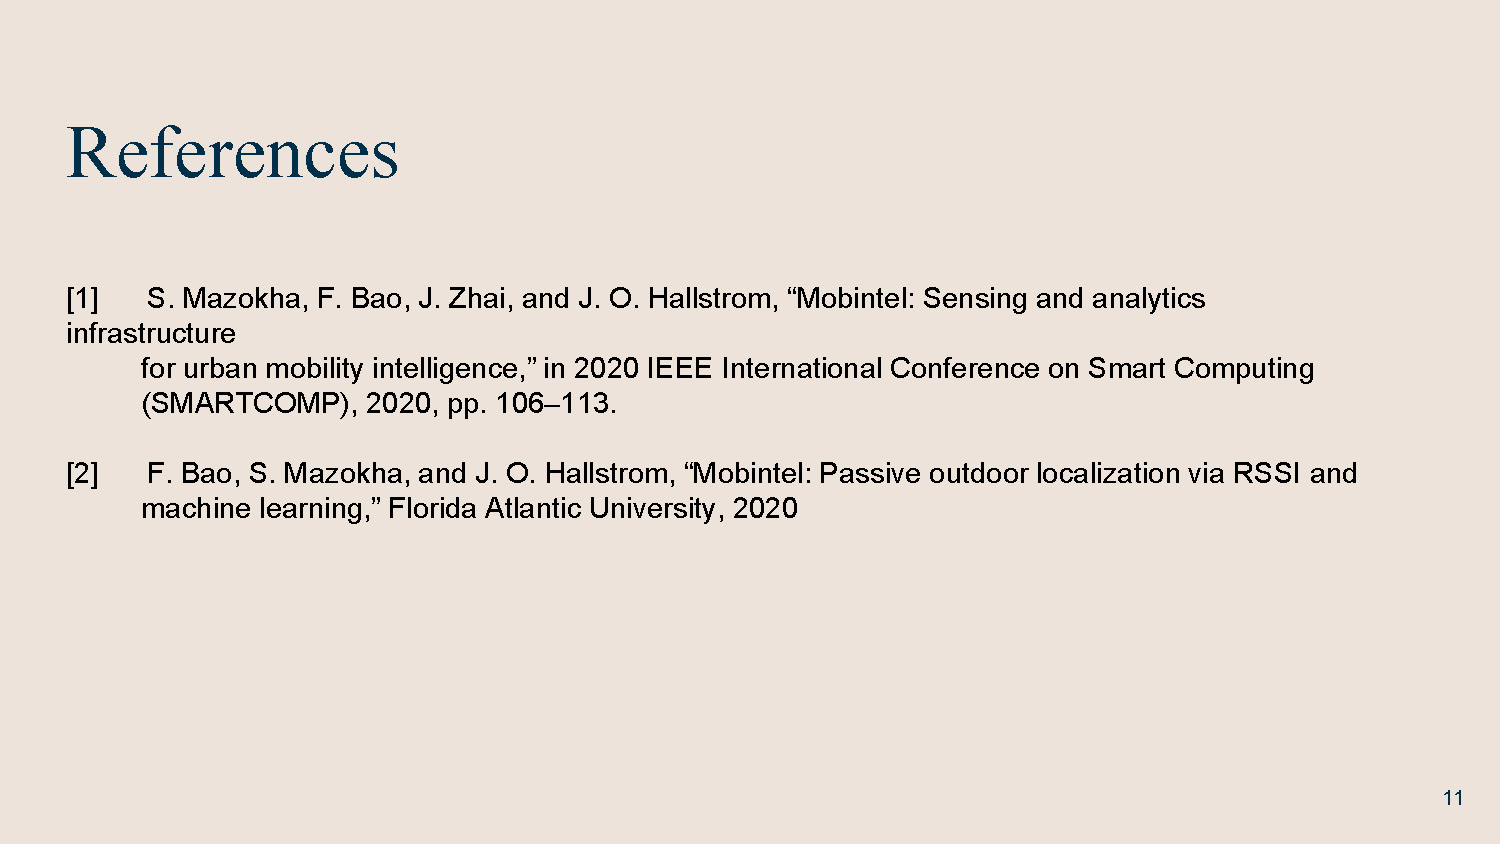
References
[1] S. Mazokha, F. Bao, J. Zhai, and J. O. Hallstrom, "Mobintel: Sensing and analytics infrastructure for urban mobility intelligence," in 2020 IEEE International Conference on Smart Computing (SMARTCOMP), 2020, pp. 106–113.
[2] F. Bao, S. Mazokha, and J. O. Hallstrom, "Mobintel: Passive outdoor localization via RSSI and machine learning," Florida Atlantic University, 2020

End of Presentation
Click the right arrow to return to the beginning of the slide show.
For a downloadable version of this presentation, email: I-SENSE@FAU.