Underwater Active Acoustic Energy Harvesting
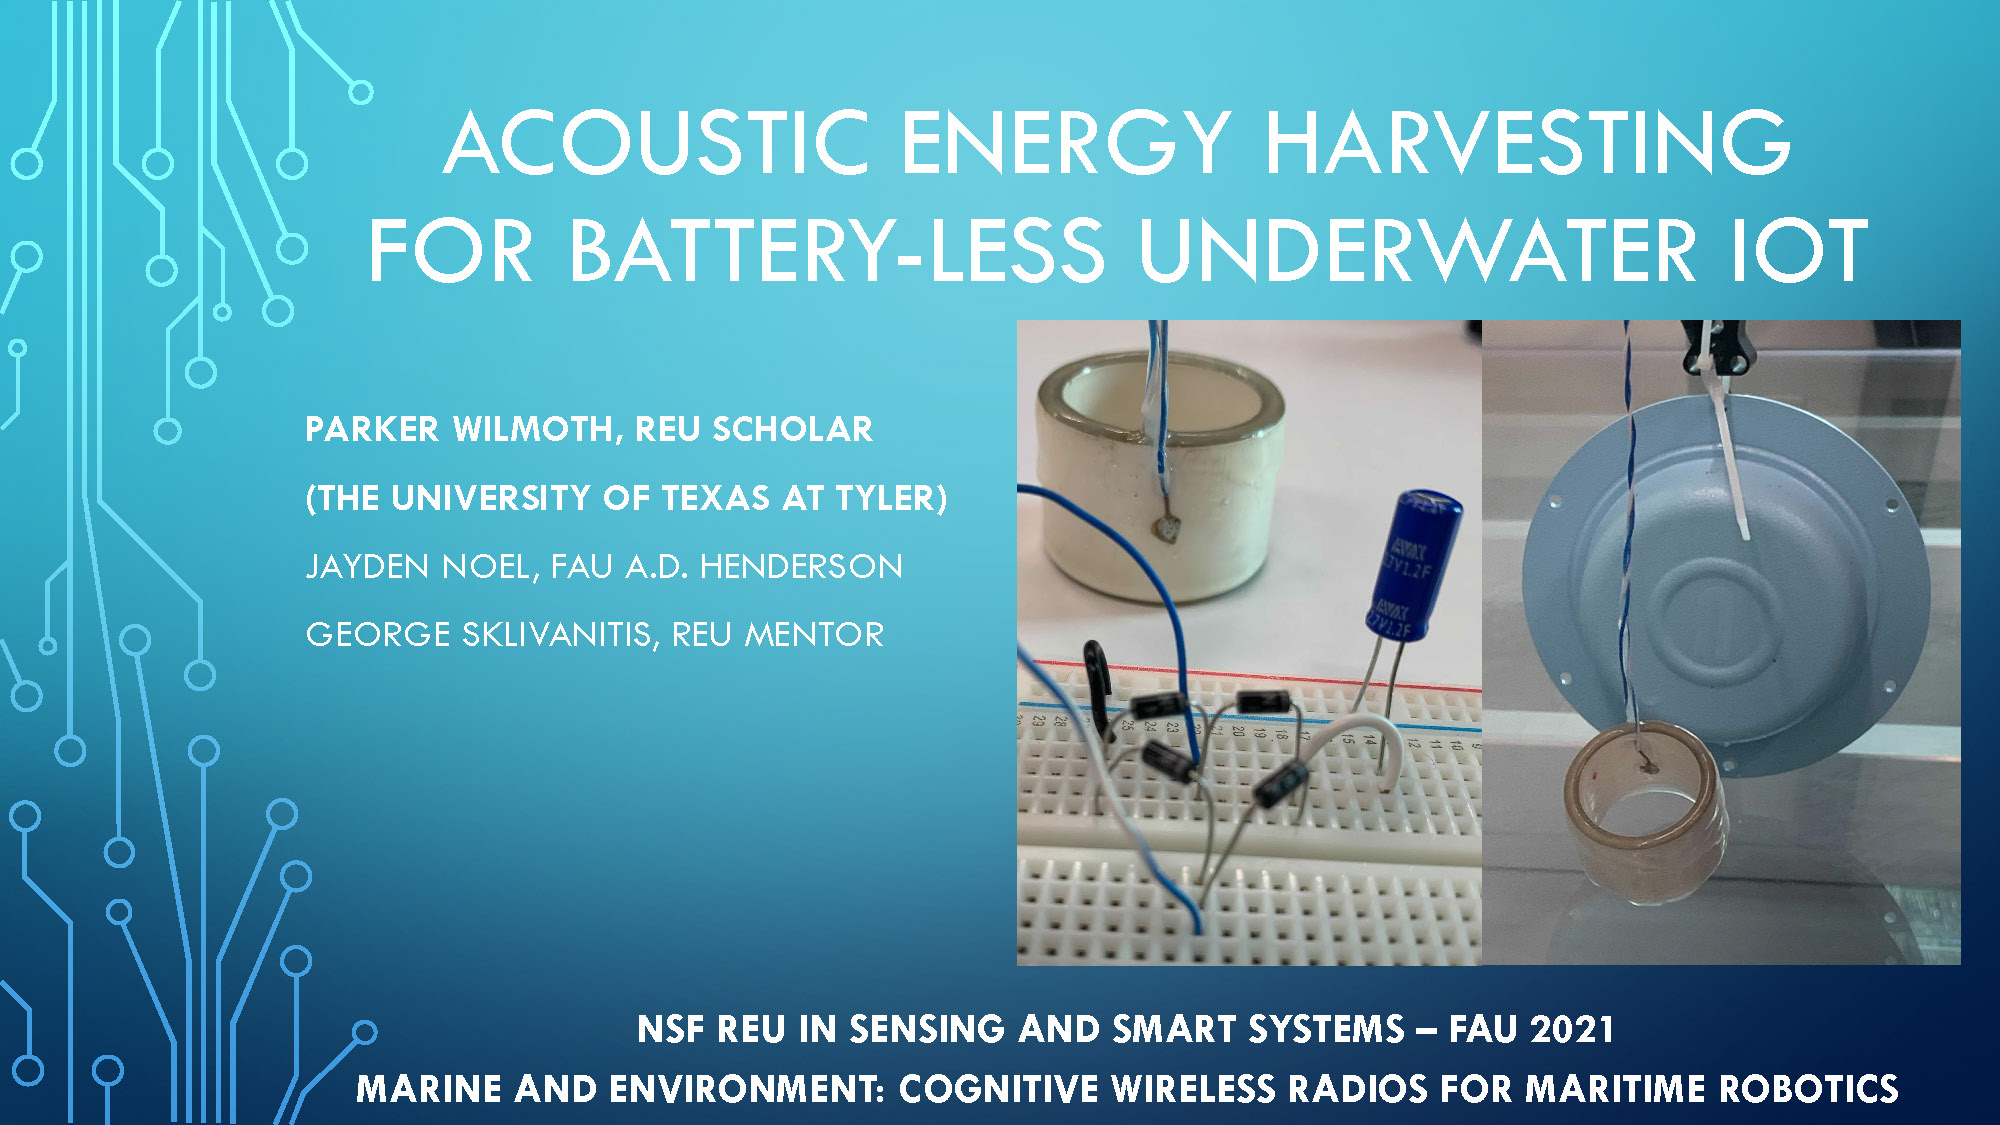
Acoustic Energy Harvesting For Battery-Less Underwater Iot
Parker Wilmoth, Reu Scholar (The University Of Texas At Tyler)
Jayden Noel, Fau A.D. Henderson
George Sklivanitis, Reu Mentor
Nsf Reu In Sensing And Smart Systems – Fau 2021
Marine And Environment: Cognitive Wireless Radios For Maritime Robotics
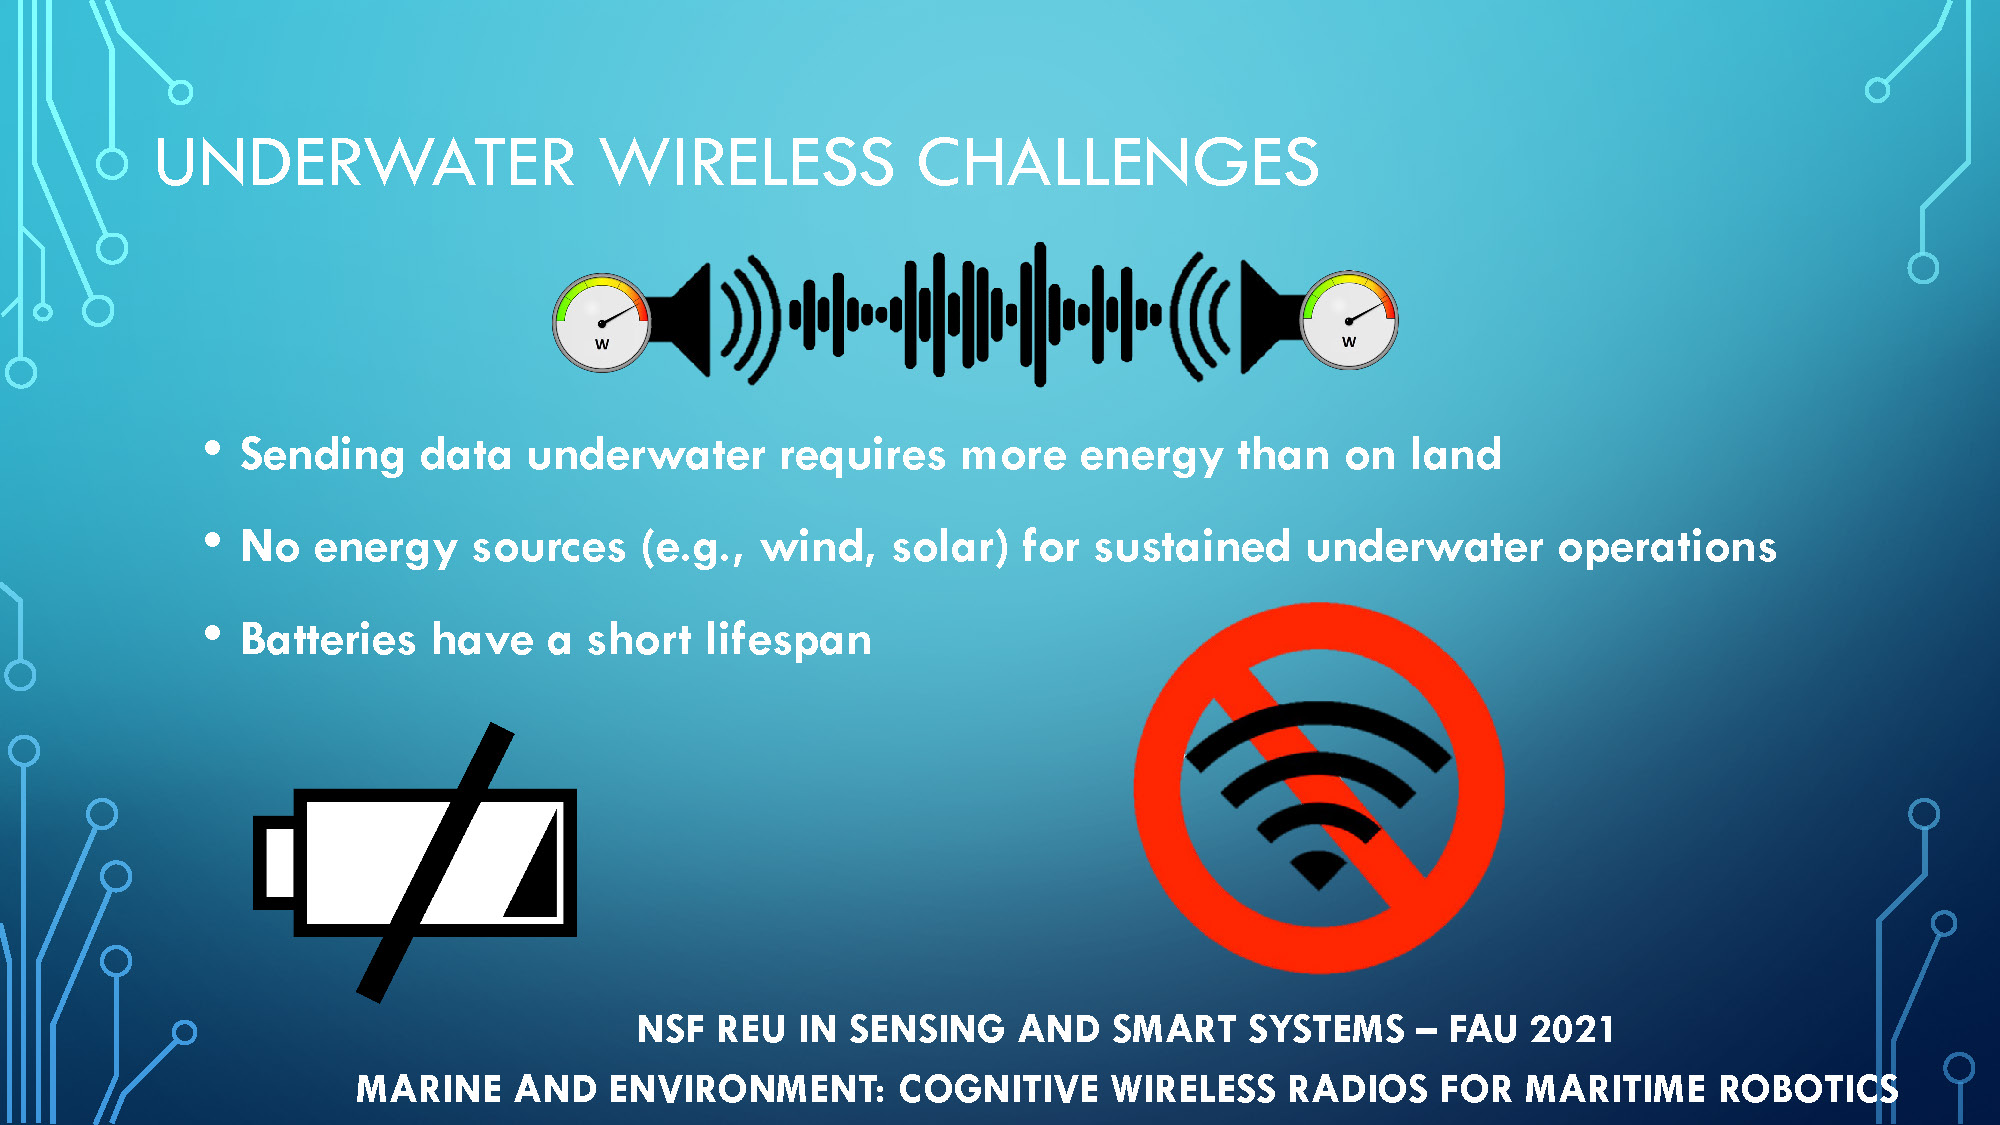
UNDERWATER WIRELESS CHALLENGES
- Sending data underwater requires more energy than on land
- No energy sources (e.g., wind, solar) for sustained underwater operations
- Batteries have a short lifespan
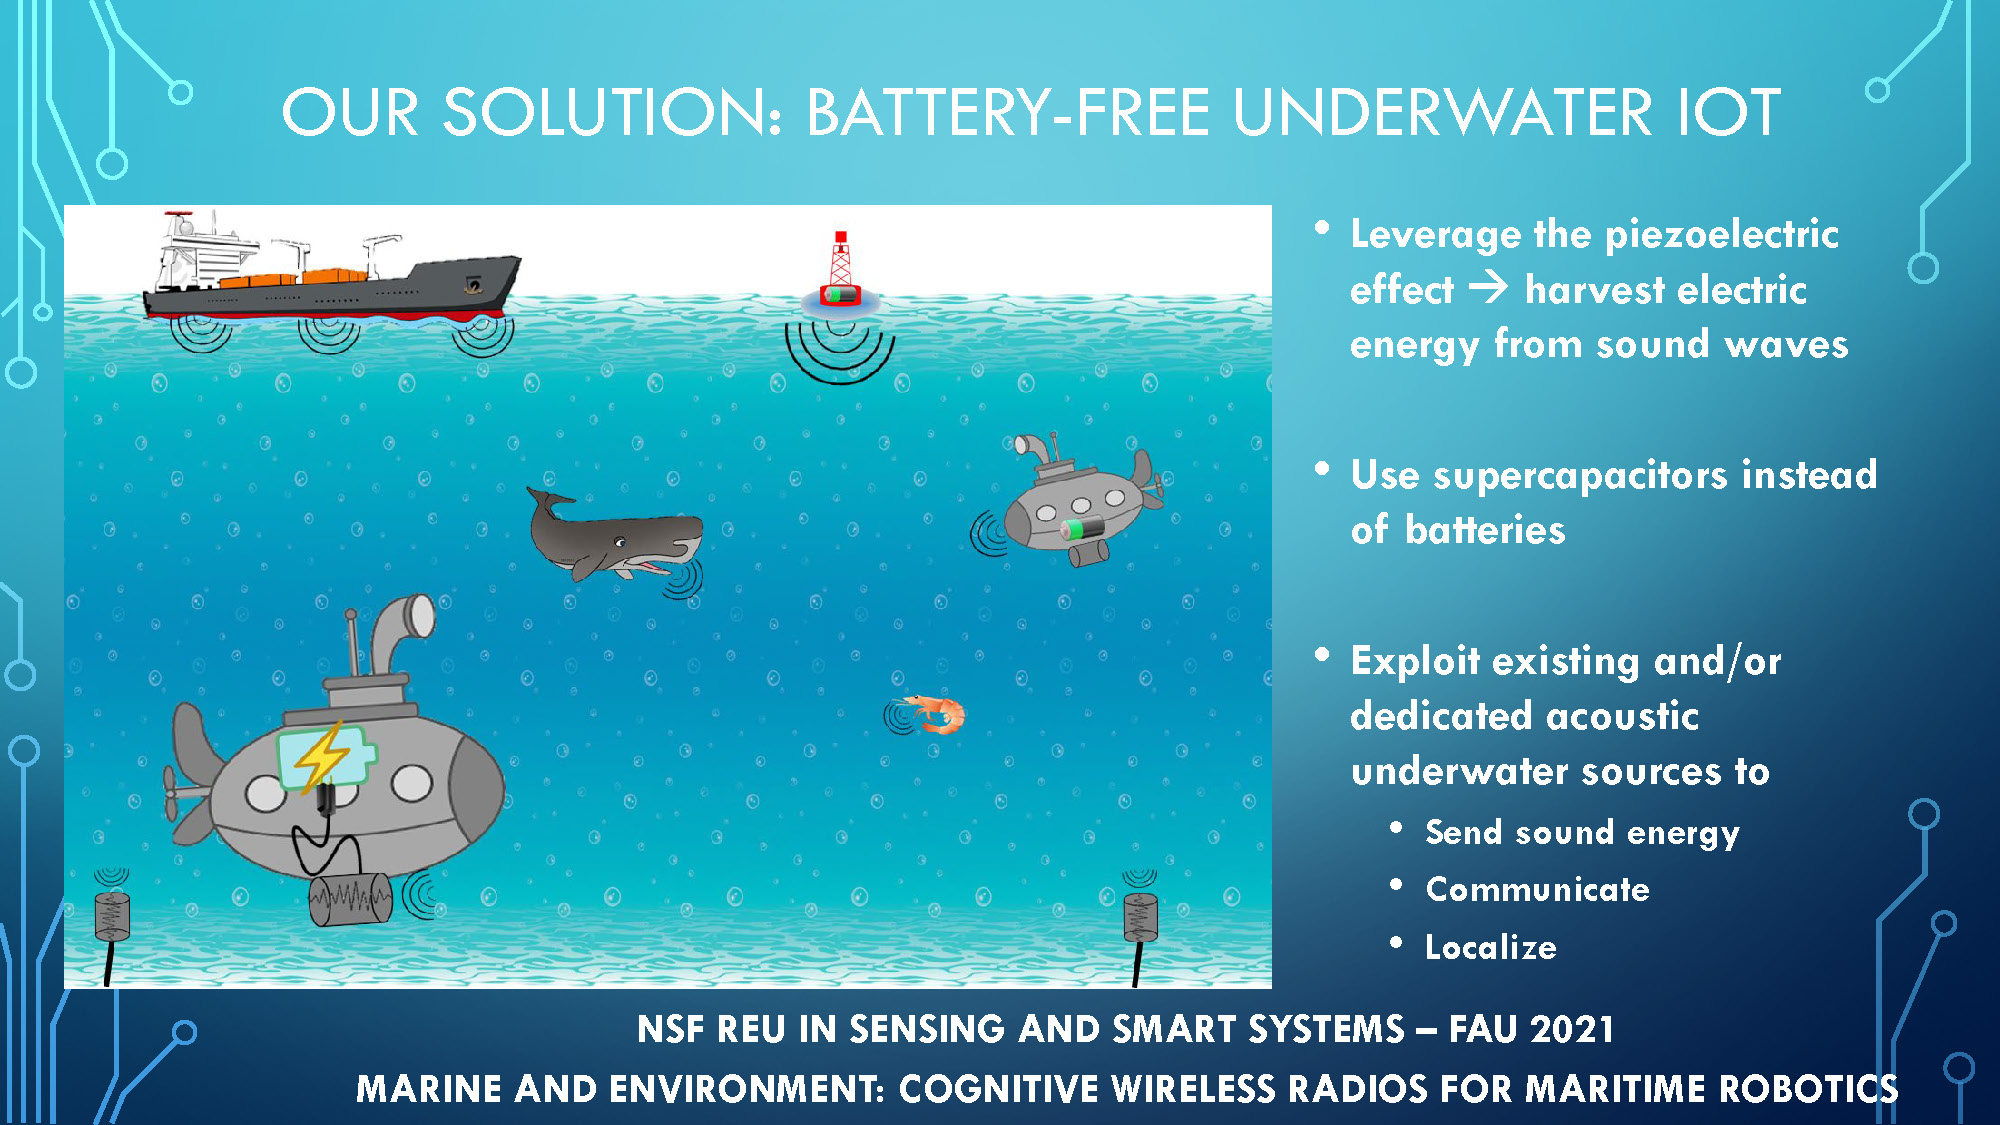
OUR SOLUTION: BATTERY-FREE UNDERWATER IOT
- Leverage the piezoelectric effect — harvest electric energy from sound waves
- Use supercapacitors instead of batteries
- Exploit existing and/or dedicated acoustic underwater sources to
- Send sound energy
- Communicate
- Localize
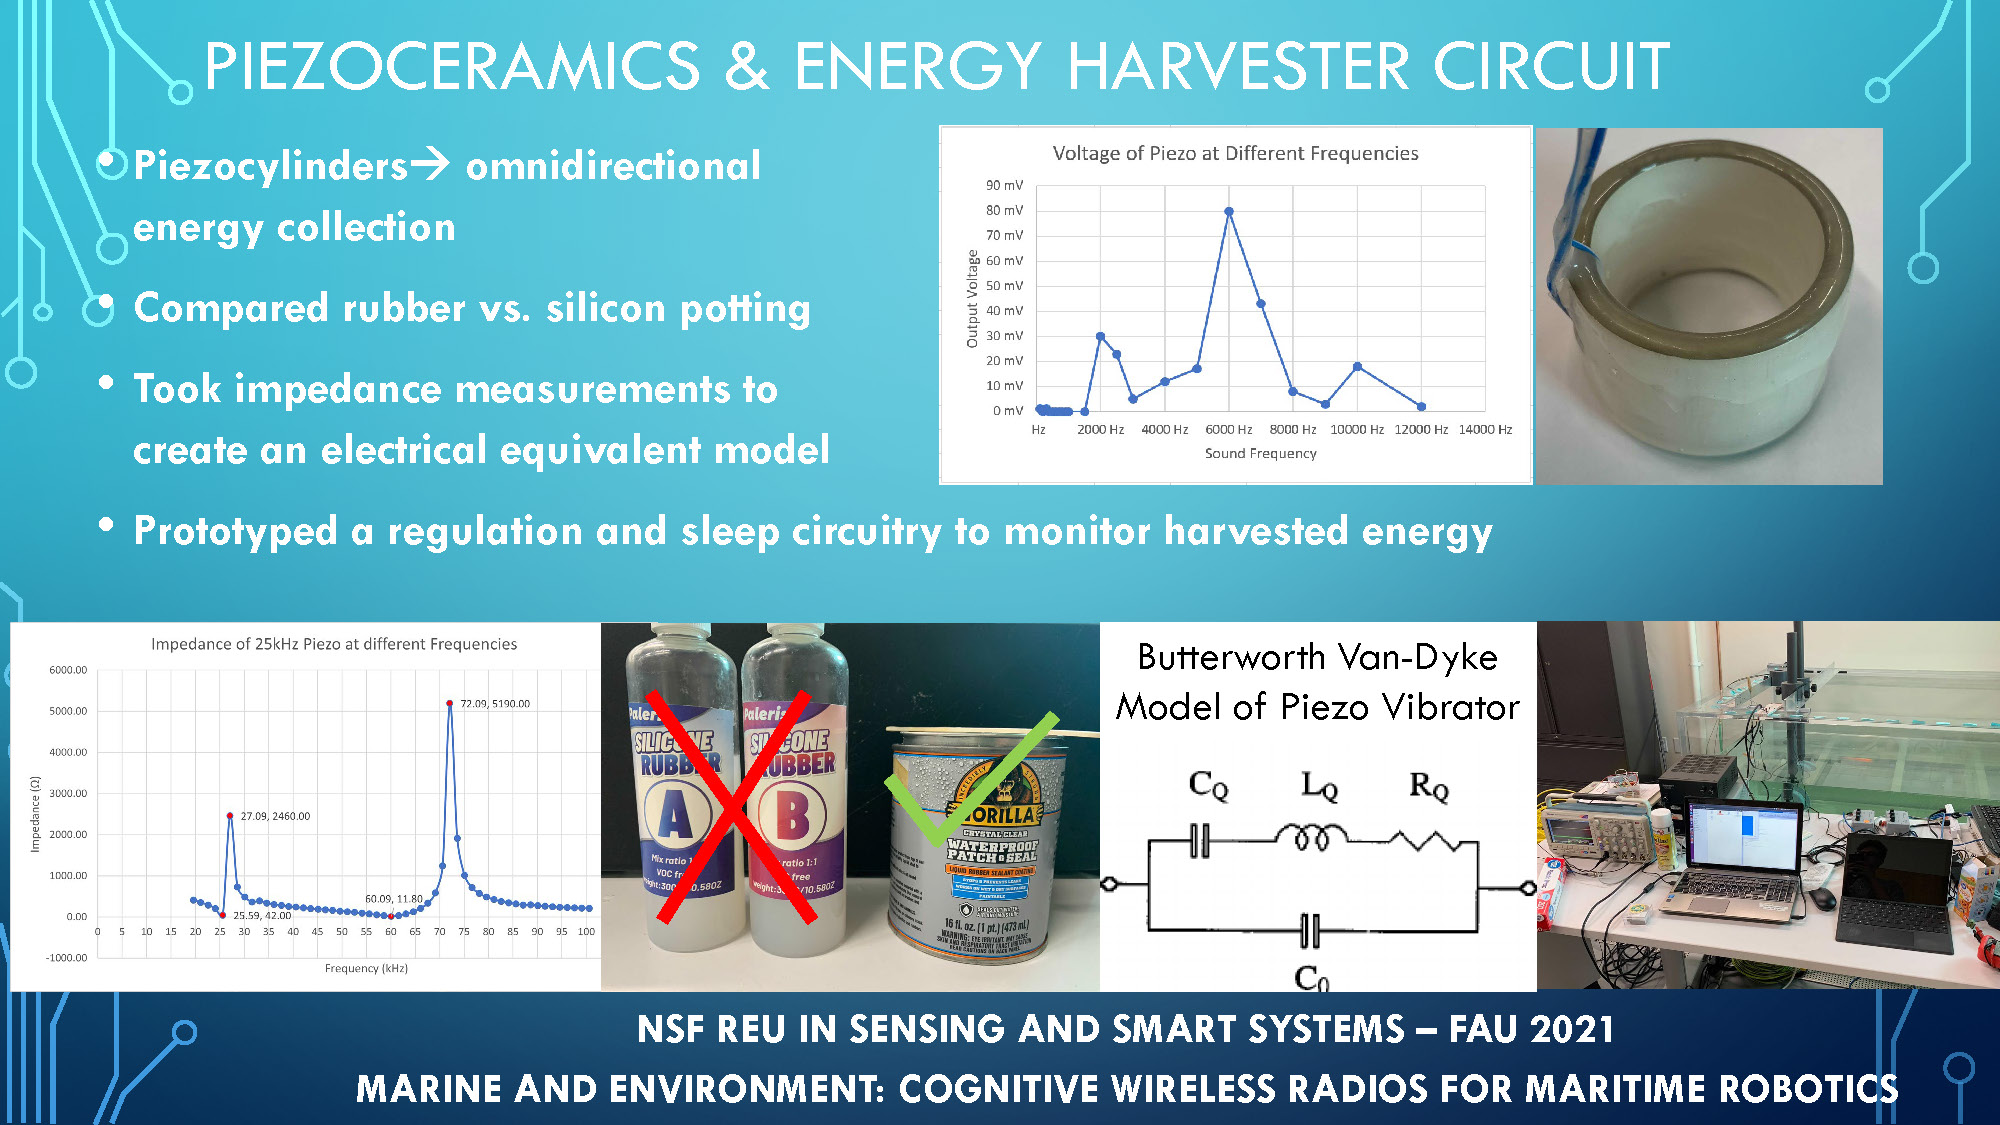
PIEZOCERAMICS & ENERGY HARVESTER CIRCUIT
- Piezocylinders — omnidirectional energy collection
- Compared rubber vs. silicon potting
- Took impedance measurements to create an electrical equivalent model
- Prototyped a regulation and sleep circuitry to monitor harvested energy
A photo of a cylindrical device wrapped with wires is placed next to the graph. There is another line graph titled "Impedance of 25kHz Piezo at different frequencies" plotting "Impedance (Ω)" against "Frequency (kHz)". Next to this graph are photos of two containers labeled "A" and "B" for "Silicone Rubber" and a container of "GORILLA" glue. The final visual element is a circuit diagram labeled "Butterworth Van-Dyke Model of Piezo Vibrator" and a photograph of a physical circuit setup on a table with a laptop, breadboard, and other equipment.
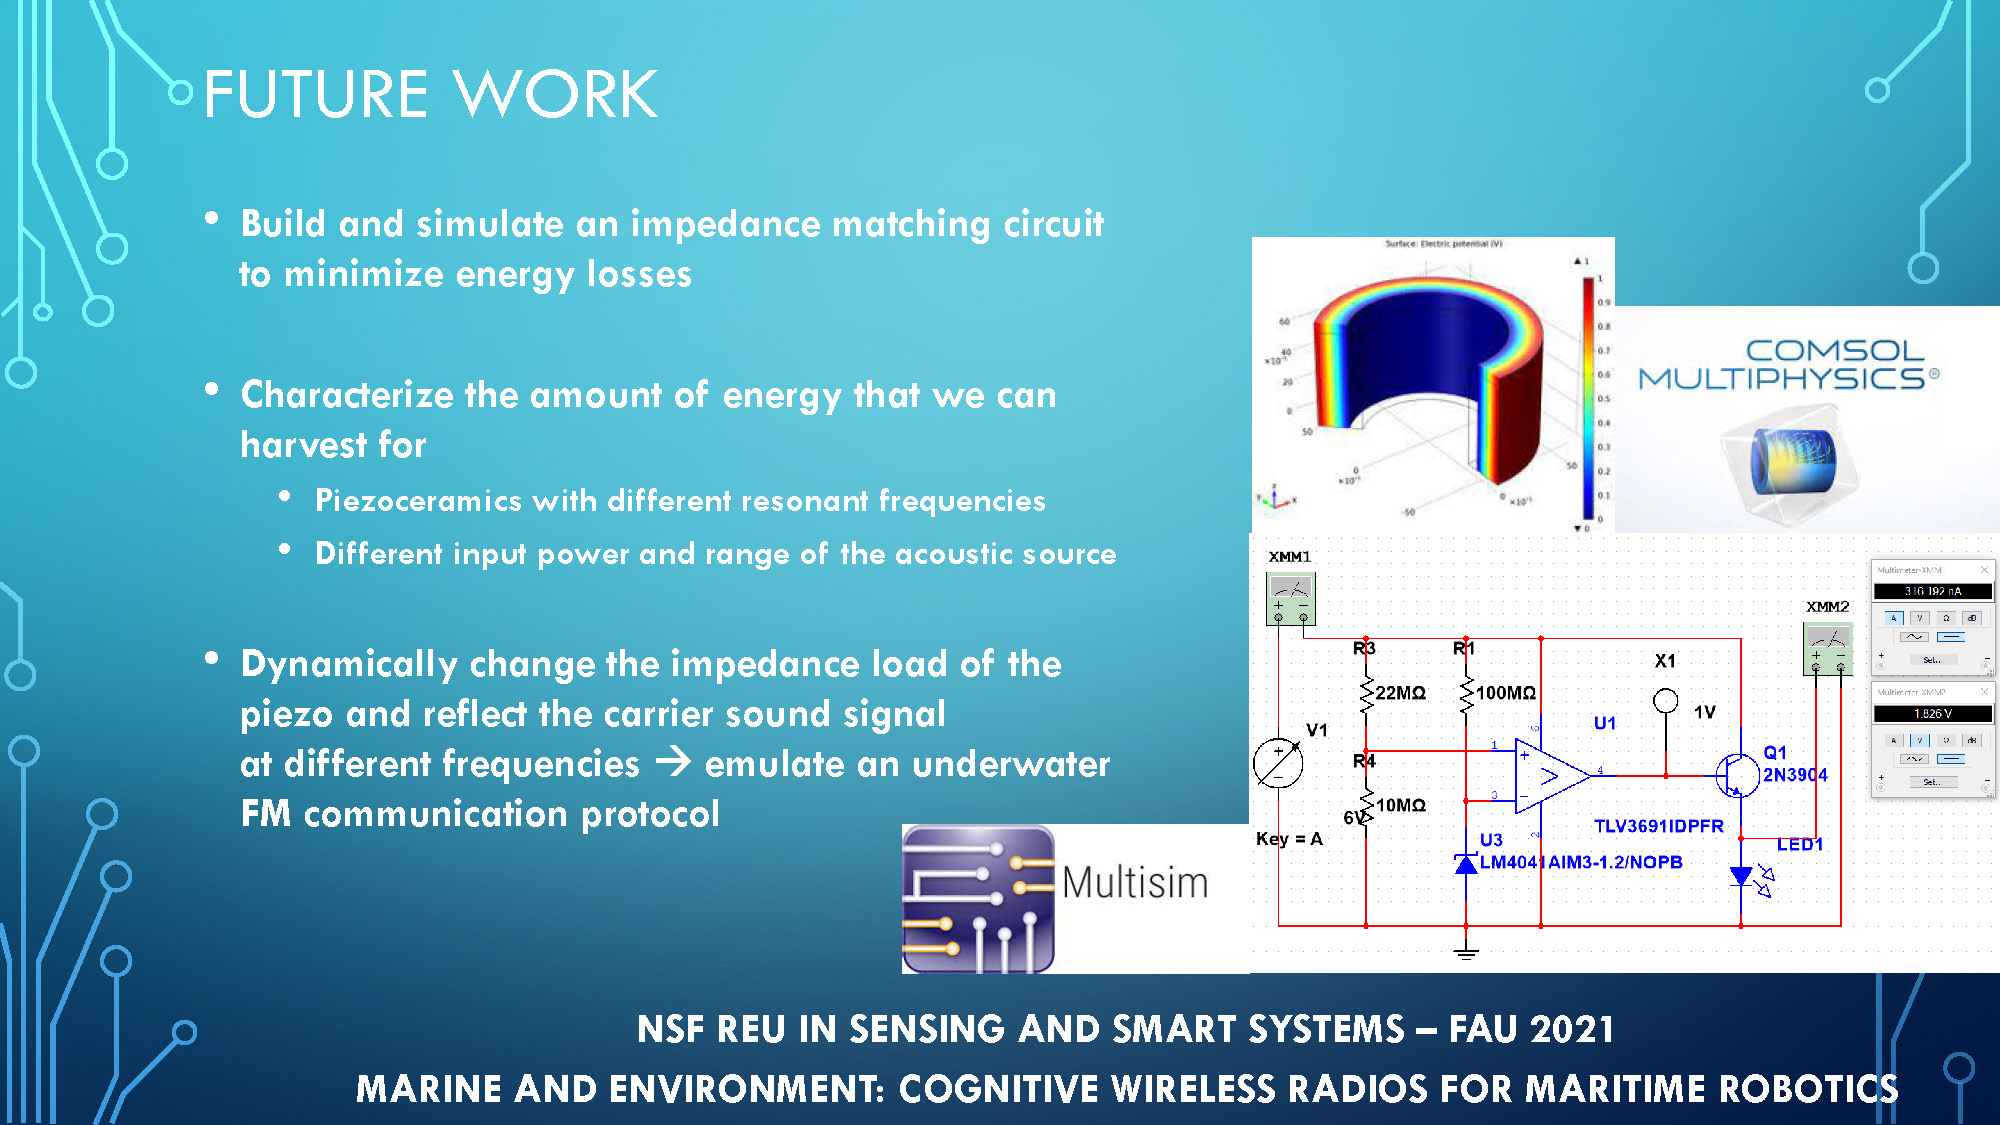
FUTURE WORK
- Build and simulate an impedance matching circuit to minimize energy losses
- Characterize the amount of energy that we can harvest for
- Piezoceramics with different resonant frequencies
- Different input power and range of the acoustic source
- Dynamically change the impedance load of the piezo and reflect the carrier sound signal at different frequencies —> emulate an underwater FM communication protocol
A circuit diagram with various components like resistors (R1, R2, R3, R4), an op-amp (U1), and an LED, and a software icon for "Multisim". There is also a small screenshot of a measurement device's display showing "3.0189 V".

End of Presentation
Click the right arrow to return to the beginning of the slide show.
For a downloadable version of this presentation, email: I-SENSE@FAU.