Design and Implementation of M-FSK for a Software-Defined Underwater Acoustic Modem
Research by Ryan Balloun, REU Scholar from University of Rochester, under the guidance of Dr. George Sklivanitis
NSF REU in Sensing and Smart Systems – FAU 2021
Marine and Environment: Cognitive Wireless Radios for Maritime Robotics
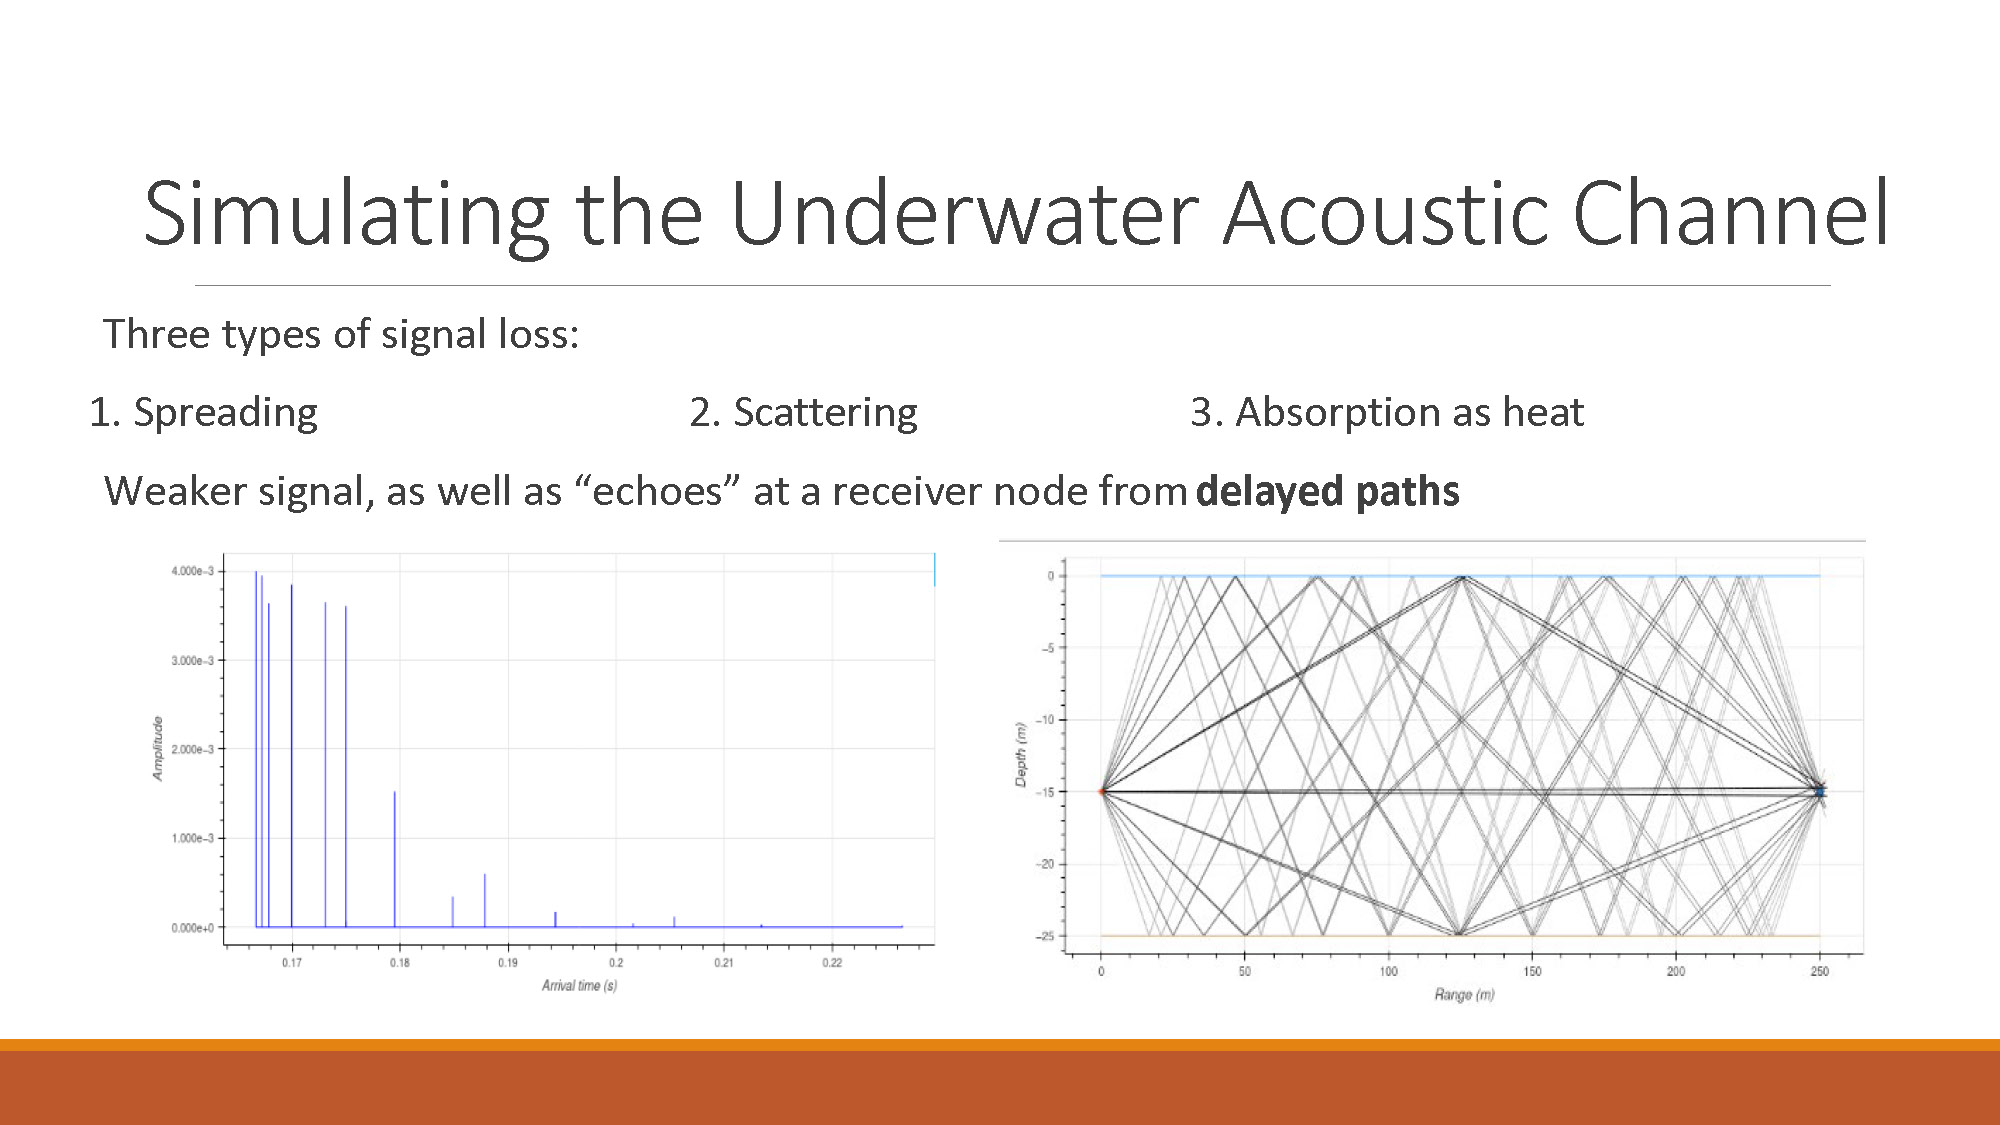
Simulating the Underwater Acoustic Channel
Three types of signal loss:
- Spreading
- Scattering
- Absorption as heat
Weaker signal, as well as "echoes" at a receiver node from delayed paths
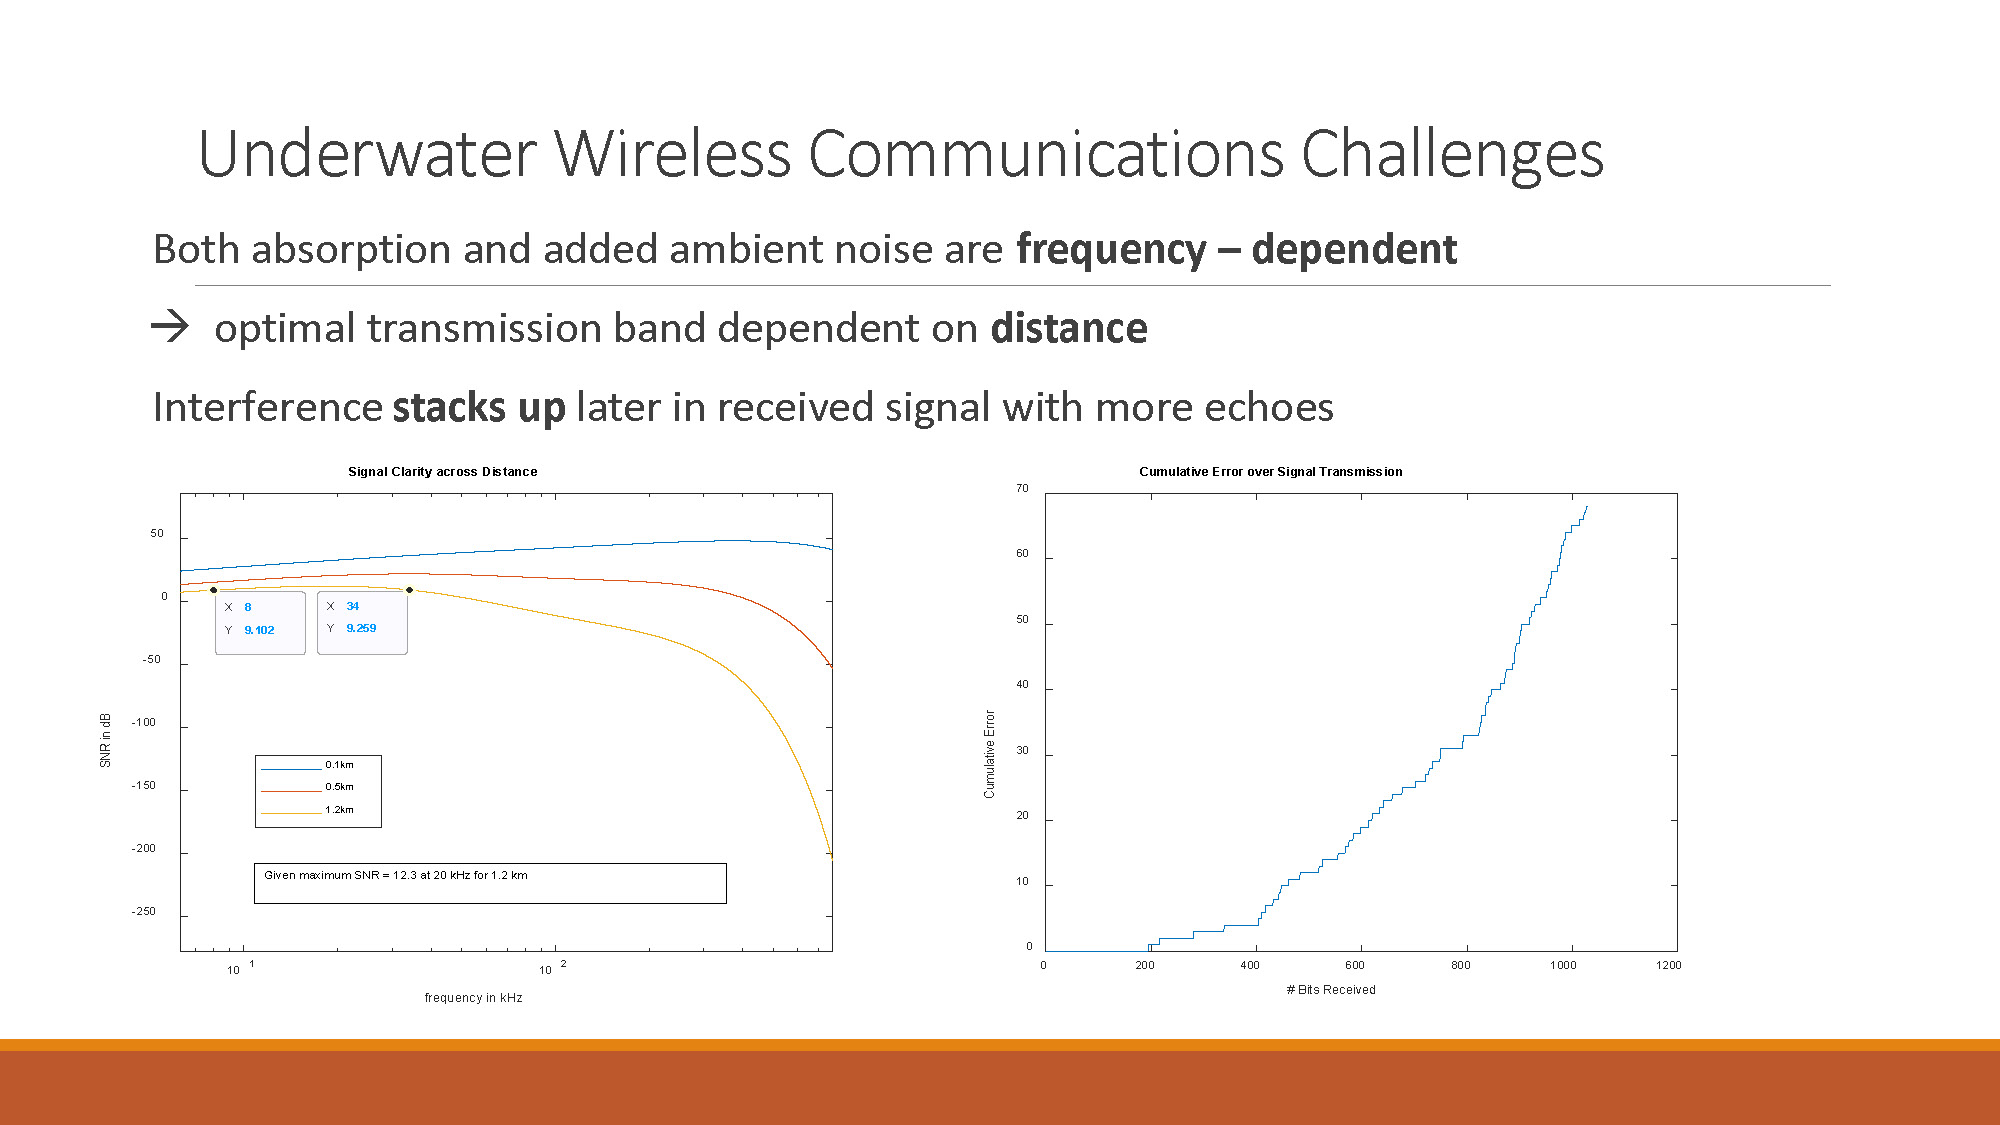
Underwater Wireless Communications Challenges
Both absorption and added ambient noise are frequency – dependent
→ optimal transmission band dependent on distance
Interference stacks up later in received signal with more echoes
Signal Clarity across Distance Chart
The chart shows SNR in dB (y-axis ranging from -250 to 50) versus frequency in kHz (x-axis from 10^1 to 10^2) for three distances:
- 0.1km (highest SNR curve)
- 0.5km (middle SNR curve)
- 1.2km (lowest SNR curve)
Notable points marked: X=8, Y=9.102 and X=34, Y=9.259
Given maximum SNR = 12.3 at 20 kHz for 1.2 km
Cumulative Error over Signal Transmission Chart
Shows cumulative error (0-70 on y-axis) versus number of bits received (0-1200 on x-axis), demonstrating increasing error rates with more transmitted bits.
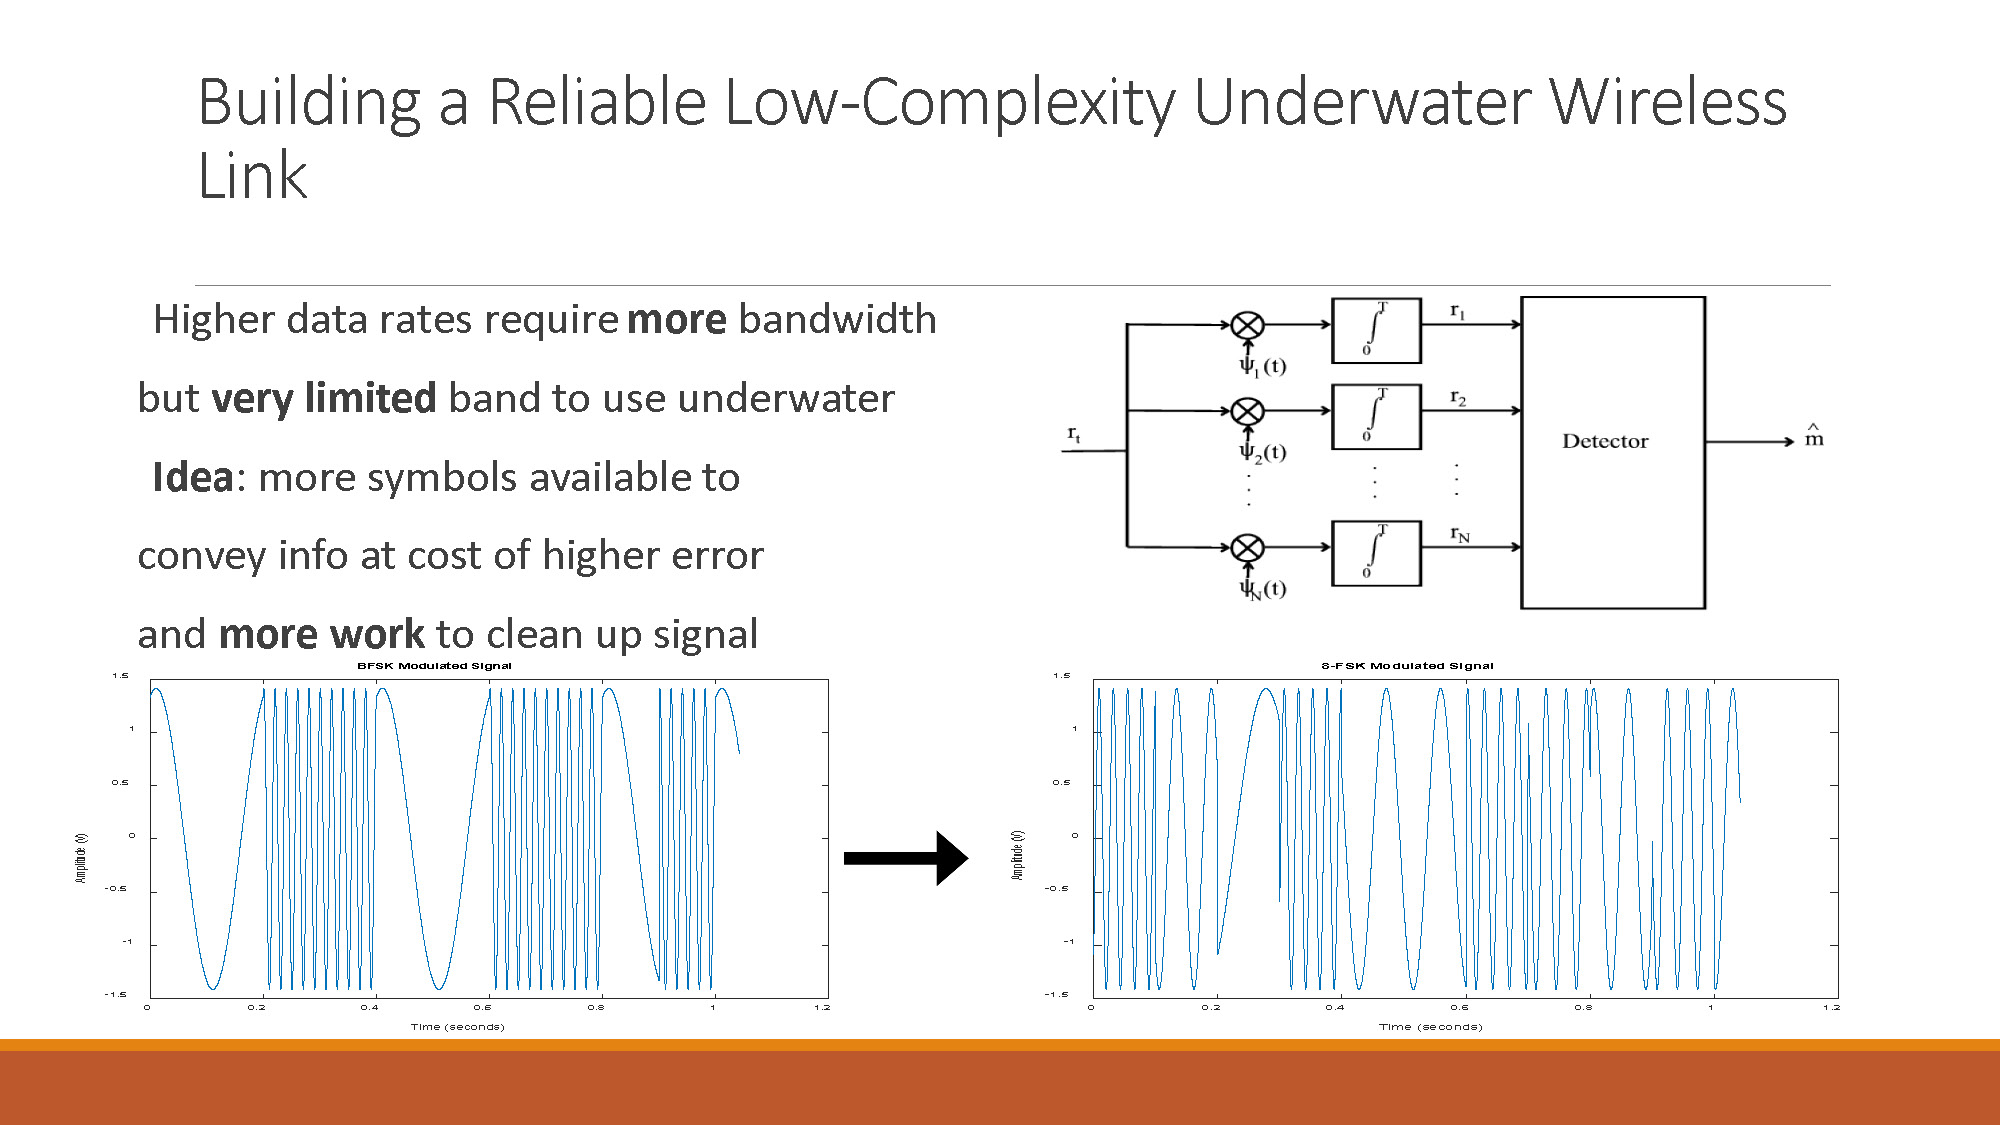
Building a Reliable Low-Complexity Underwater Wireless Link
Higher data rates require more bandwidth but very limited band to use underwater
Idea: more symbols available to convey info at cost of higher error and more work to clean up signal
8-FSK Modulated Signal
Time domain plot showing amplitude (V) ranging from -1.5 to 1.5 over time period 0 to 1.2 seconds, displaying complex waveform with multiple frequency components.
BFSK Modulated Signal
Time domain plot showing amplitude (V) ranging from -1.5 to 1.5 over time period 0 to 1.2 seconds, displaying simpler binary frequency shift keying waveform.
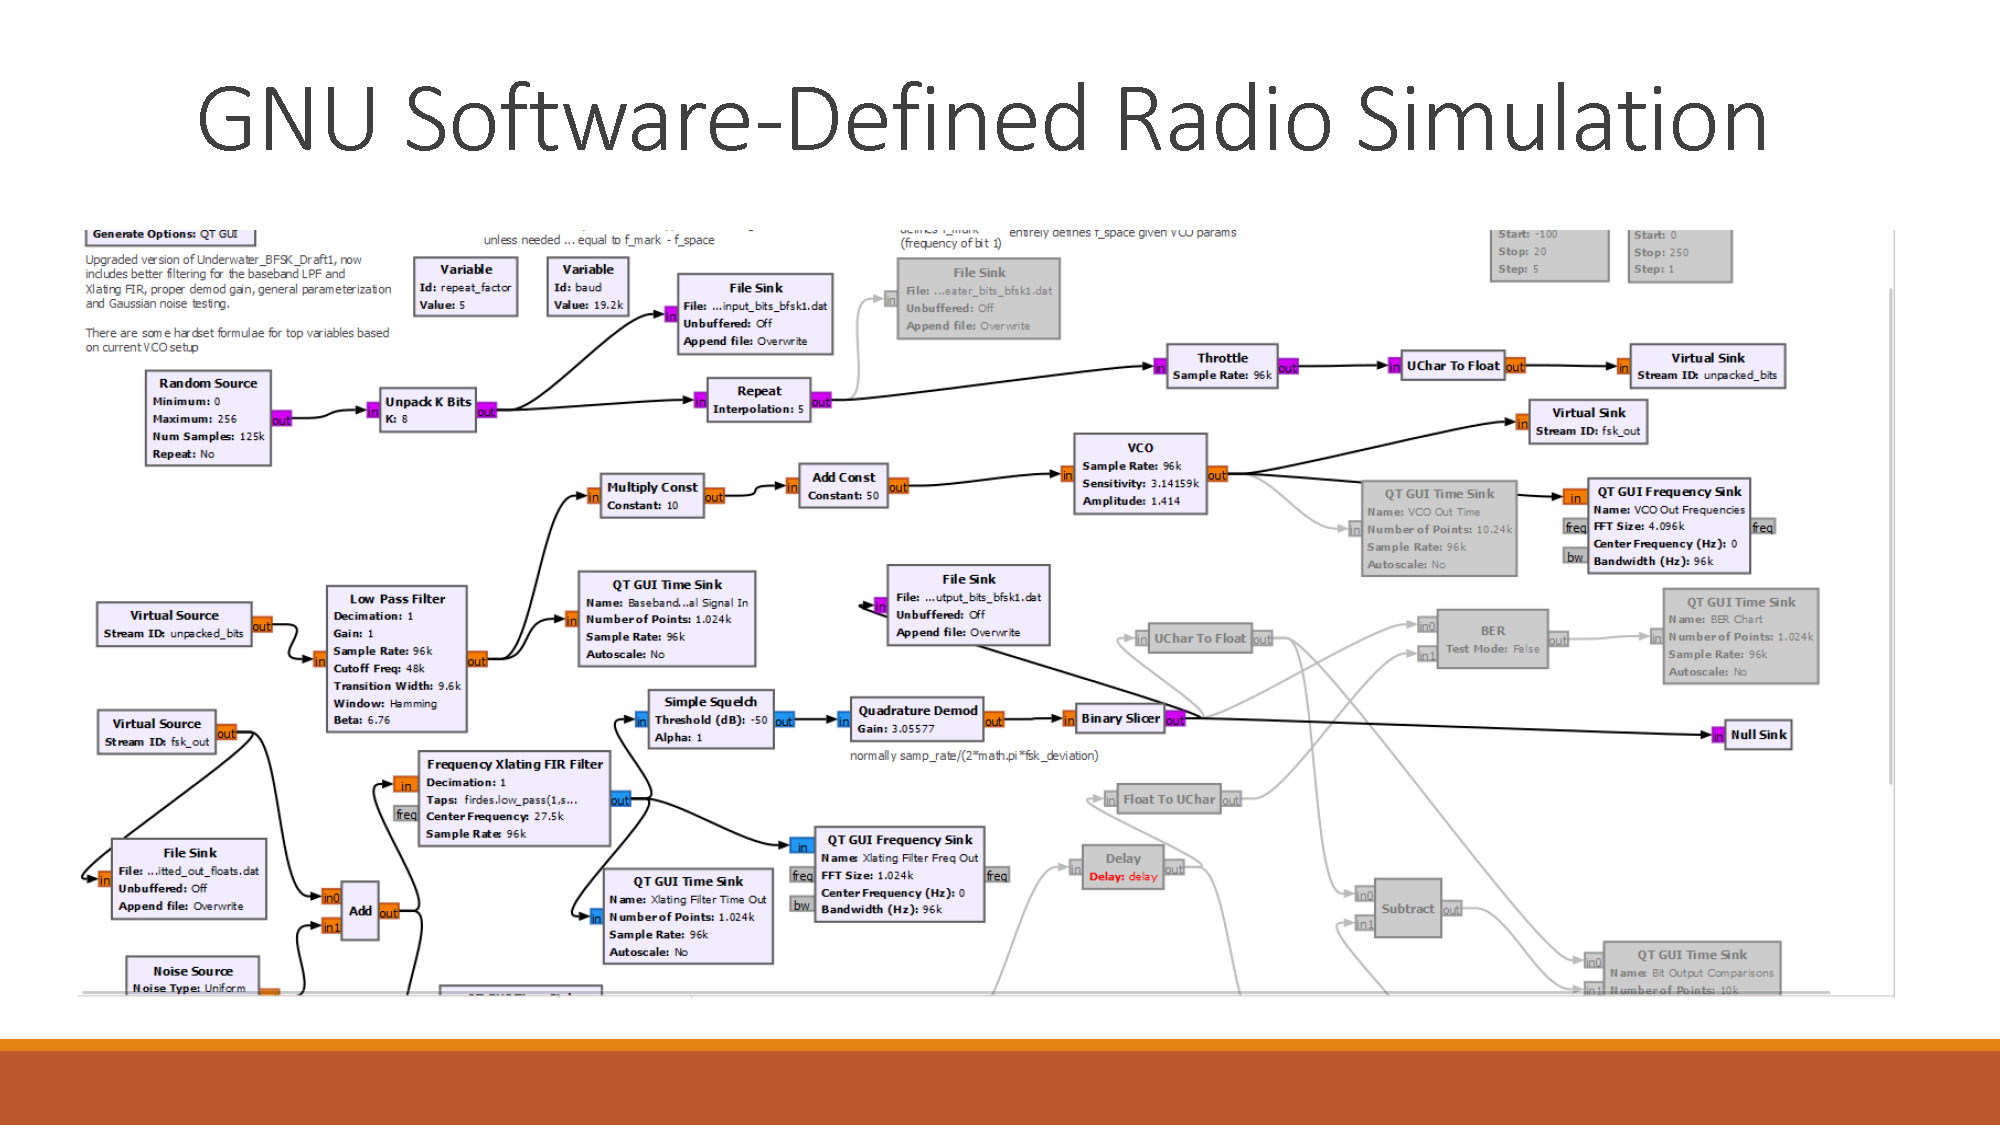
GNU Software-Defined Radio Simulation
This slide shows the GNU Software-Defined Radio implementation used for simulating the underwater acoustic modem system.
Experimental Results & Bellhop
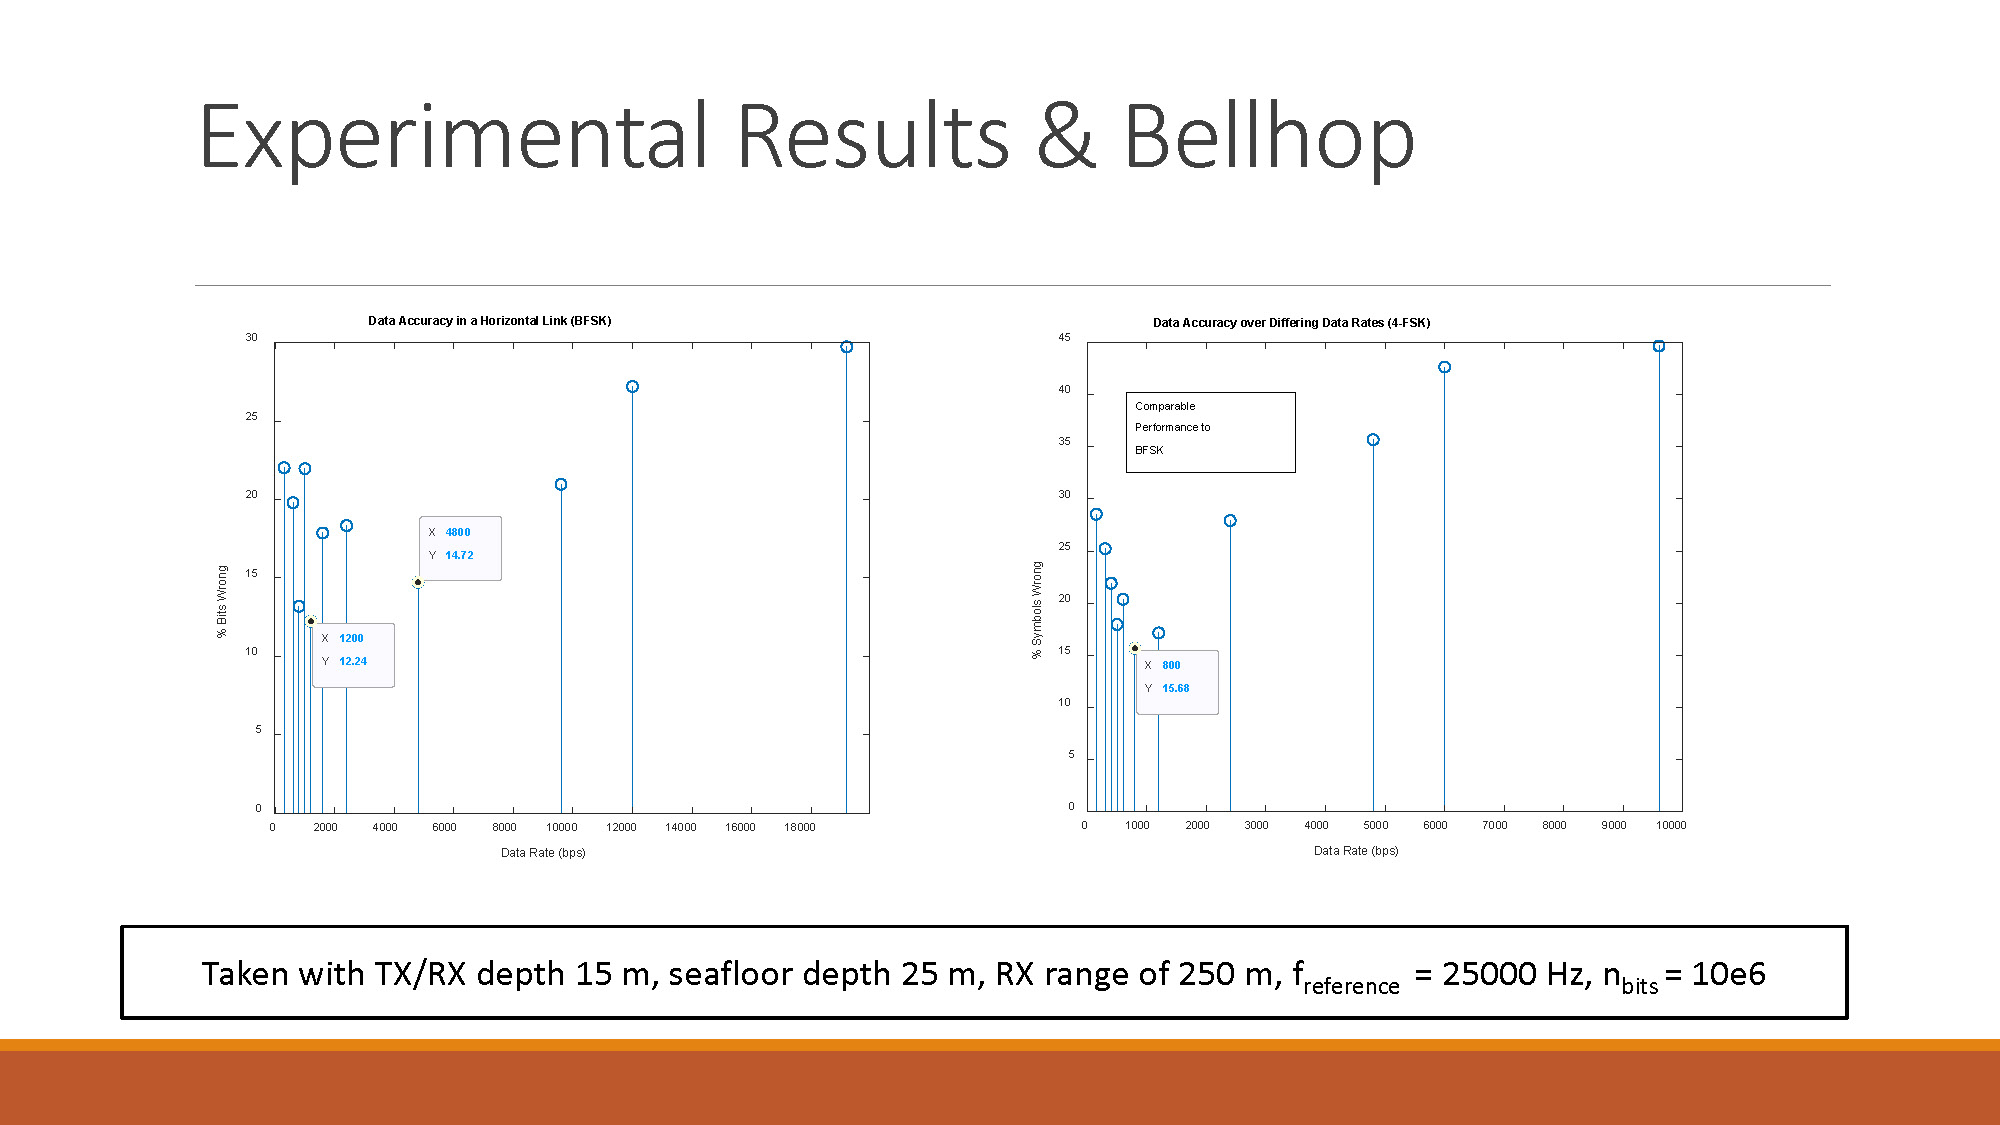
Data Accuracy in a Horizontal Link (BFSK)
Chart showing % Bits Wrong (0-30% on y-axis) versus Data Rate in bps (0-18000 on x-axis). Notable points marked: X=1200, Y=12.24 and X=4800, Y=14.72
Data Accuracy over Differing Data Rates (4-FSK)
Chart showing % Symbols Wrong (0-45% on y-axis) versus Data Rate in bps (0-10000 on x-axis). Notable point marked: X=800, Y=15.68
Comparable Performance to BFSK
Test conditions: TX/RX depth 15 m, seafloor depth 25 m, RX range of 250 m, f reference = 25000 Hz, n bits = 10e6
Experimental Results & Bellhop
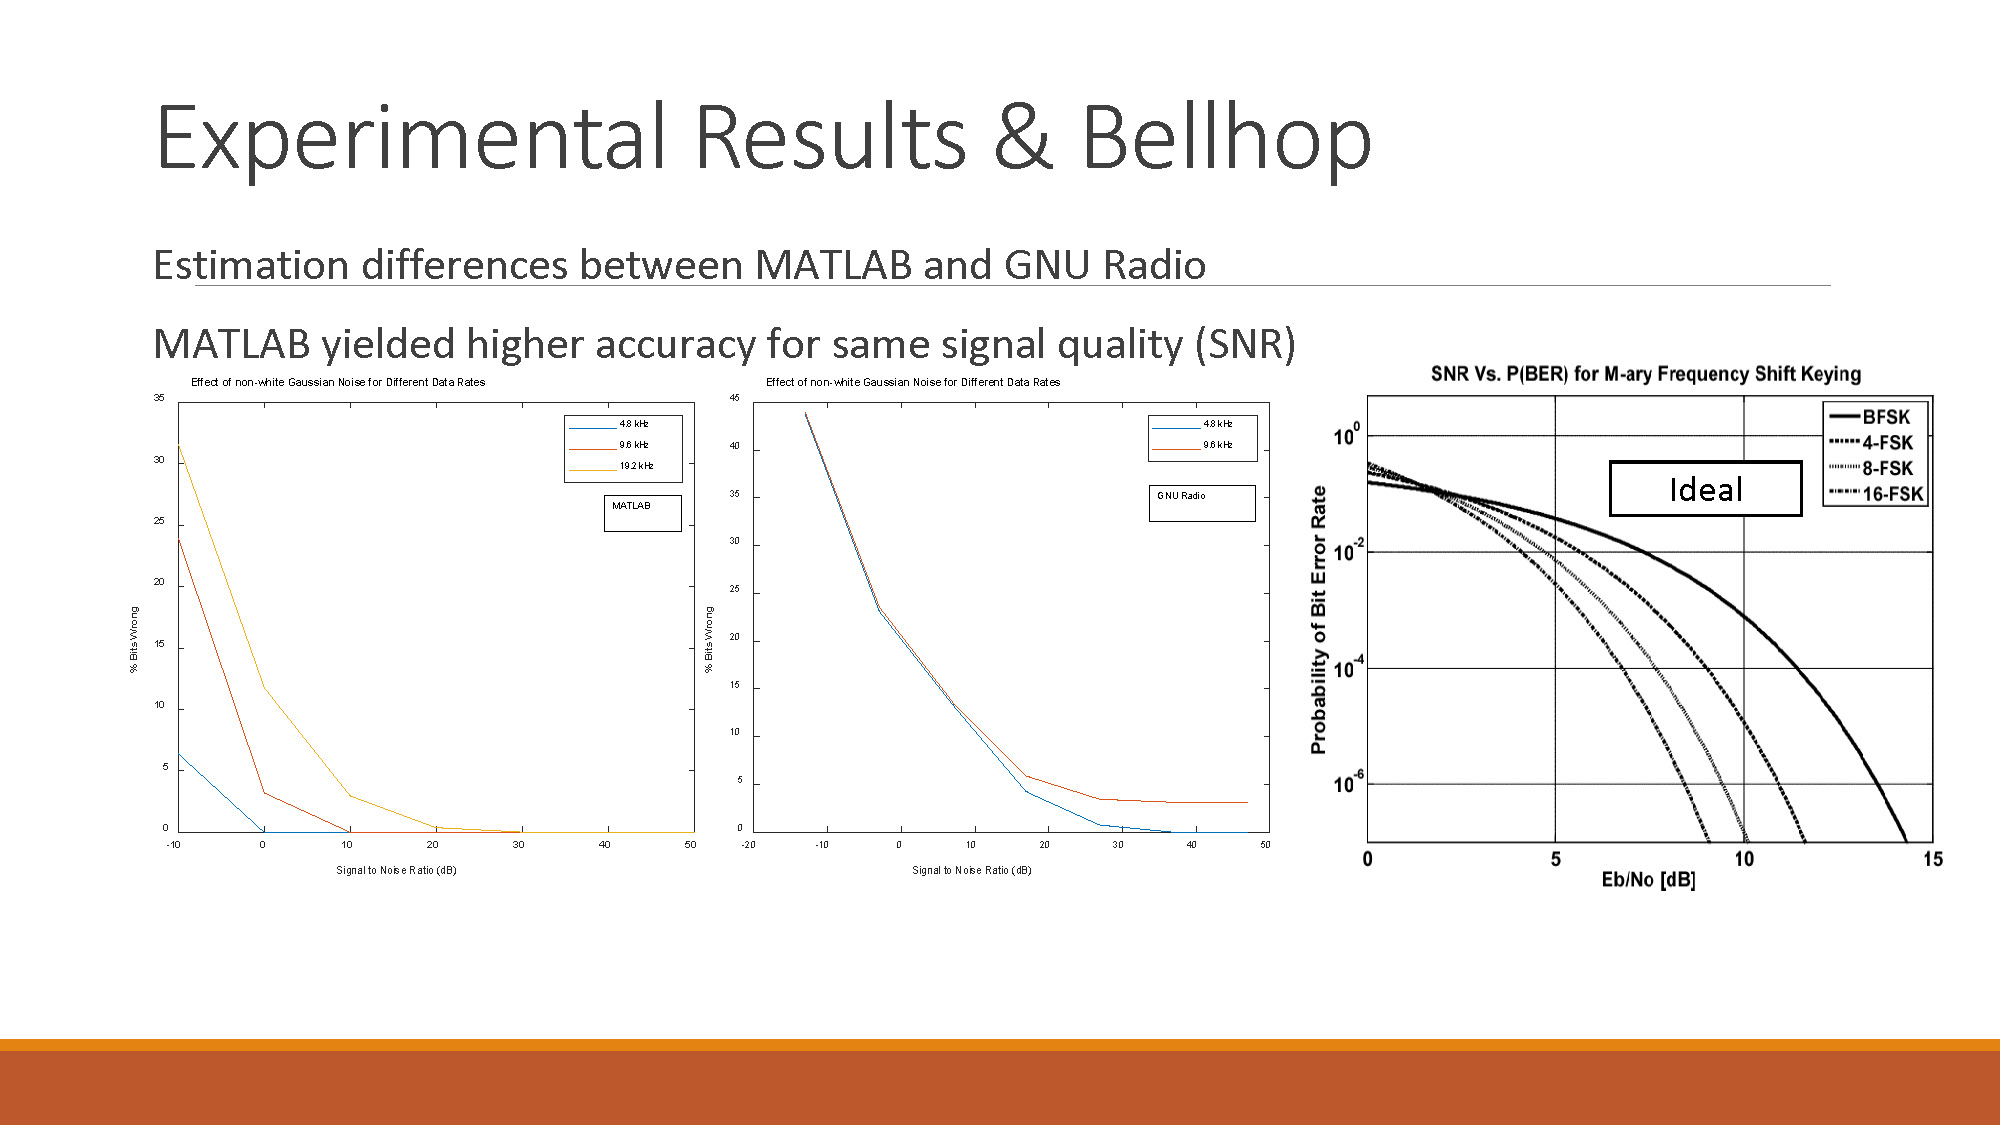
Estimation differences between MATLAB and GNU Radio
MATLAB yielded higher accuracy for same signal quality (SNR)
Effect of non-white Gaussian Noise for Different Data Rates (MATLAB)
Chart showing % Bits Wrong (0-35% on y-axis) versus Signal to Noise Ratio in dB (-10 to 50 on x-axis) for three data rates:
- 4.8 kHz
- 9.6 kHz
- 19.2 kHz
Effect of non-white Gaussian Noise for Different Data Rates (GNU Radio)
Chart showing % Bits Wrong (0-45% on y-axis) versus Signal to Noise Ratio in dB (-20 to 50 on x-axis) for:
- 4.8 kHz
- 9.6 kHz
- GNU Radio Ideal
SNR Vs. P(BER) for M-ary Frequency Shift Keying
Chart showing Probability of Bit Error Rate
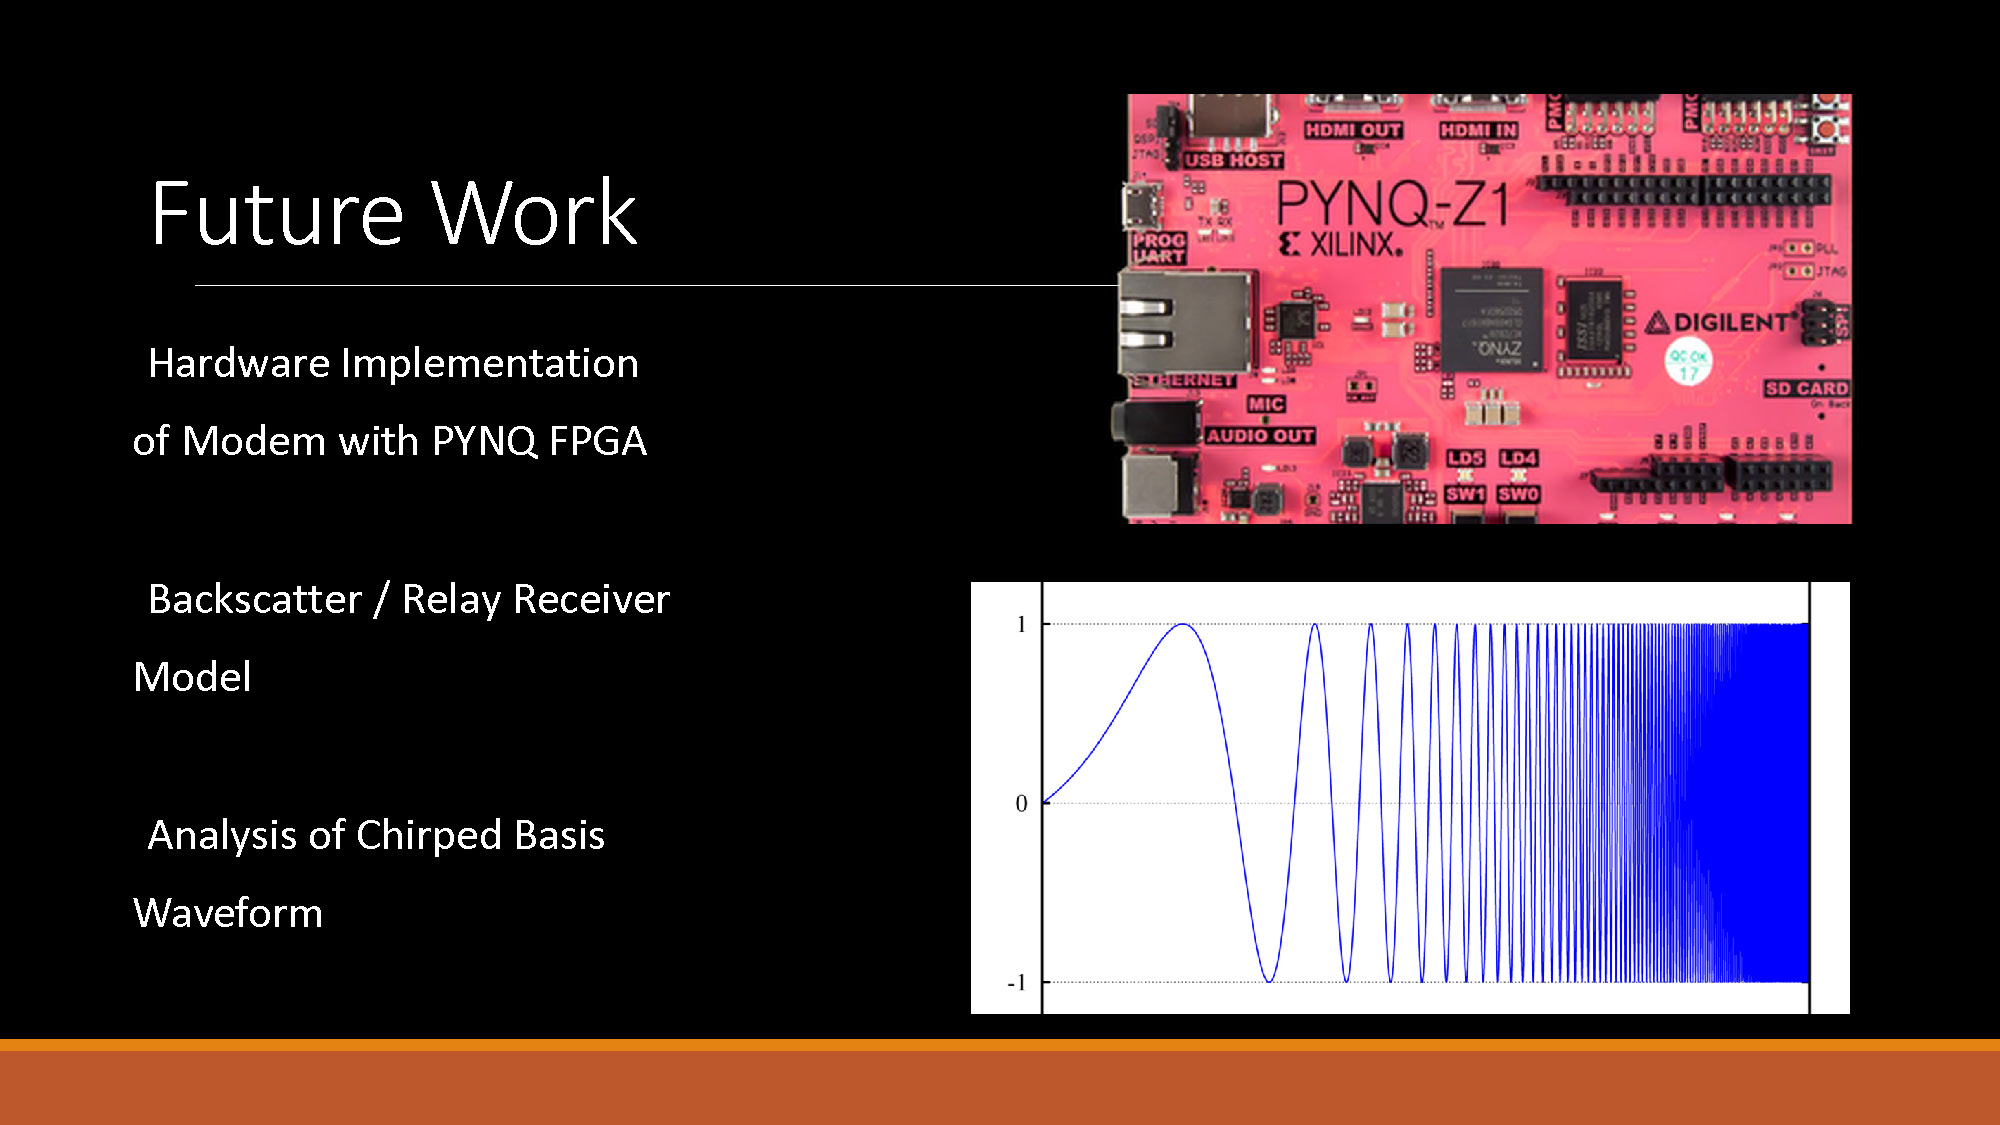
Future Work
- Hardware Implementation of Modem with PYNQ FPGA
- Backscatter / Relay Receiver Model
- Analysis of Chirped Basis Waveform
References
Warty, C. and Richard Wai Yu. "Resource allocation using ASK, FSK and PSK modulation techniques with varying M." 2011 Aerospace Conference (2011): 1-7.
Stojanovic, Milica, and Pierre-Philippe J. Beaujean. "Acoustic communication." Springer Handbook of Ocean Engineering. Springer, Cham, 2016. 359-386.
Stojanovic, Milica. "On the relationship between capacity and distance in an underwater acoustic communication channel." ACM SIGMOBILE Mobile Computing and Communications Review 11.4 (2007): 34-43.
https://www.dip.ee.uct.ac.za/~nicolls/lectures/eee482f/13_fsk_2up.pdf
https://www.gaussianwaves.com/2016/10/modeling-a-frequency-selective-multipath-fading-channel-using-tdl-filters/
https://wiki.gnuradio.org/index.php/Simulation_example:_FSK
https://www.gaussianwaves.com/2014/07/power-delay-profile/
https://oalib-acoustics.org/AcousticsToolbox/Bellhop-2010-1.pdf

End of Presentation
Click the right arrow to return to the beginning of the slide show.
For a downloadable version of this presentation, email: I-SENSE@FAU.