Digital Image Processing

Whitney Angelica Johanna Andrews
PROBLEM OVERVIEW
- Not Enough Comprehensive Material
- Can Be Confusing if Not Properly Explained
- Important Field for Data Analytics
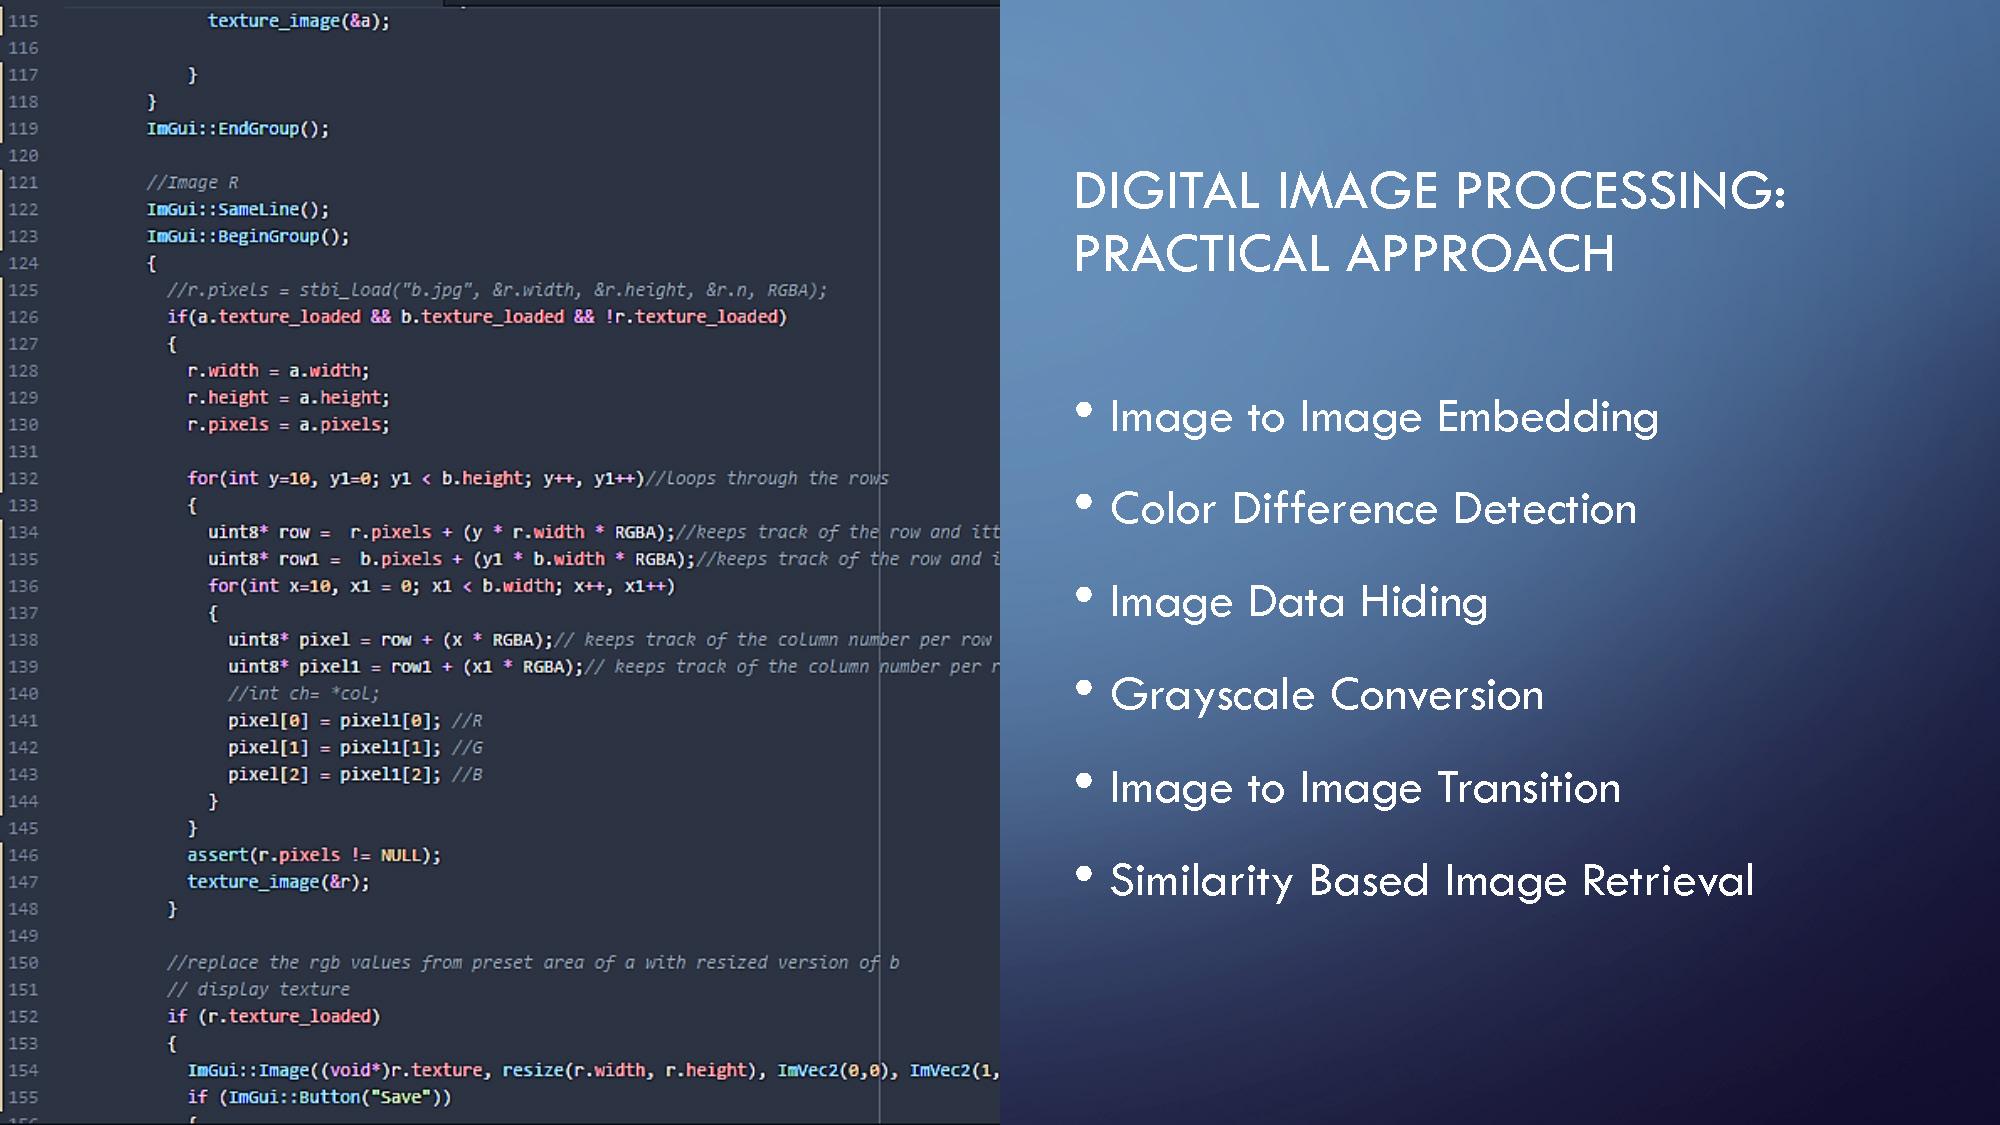
DIGITAL IMAGE PROCESSING: PRACTICAL APPROACH
- Image to Image Embedding
- Color Difference Detection
- Image Data Hiding
- Grayscale Conversion
- Image to Image Transition
- Similarity Based Image Retrieval
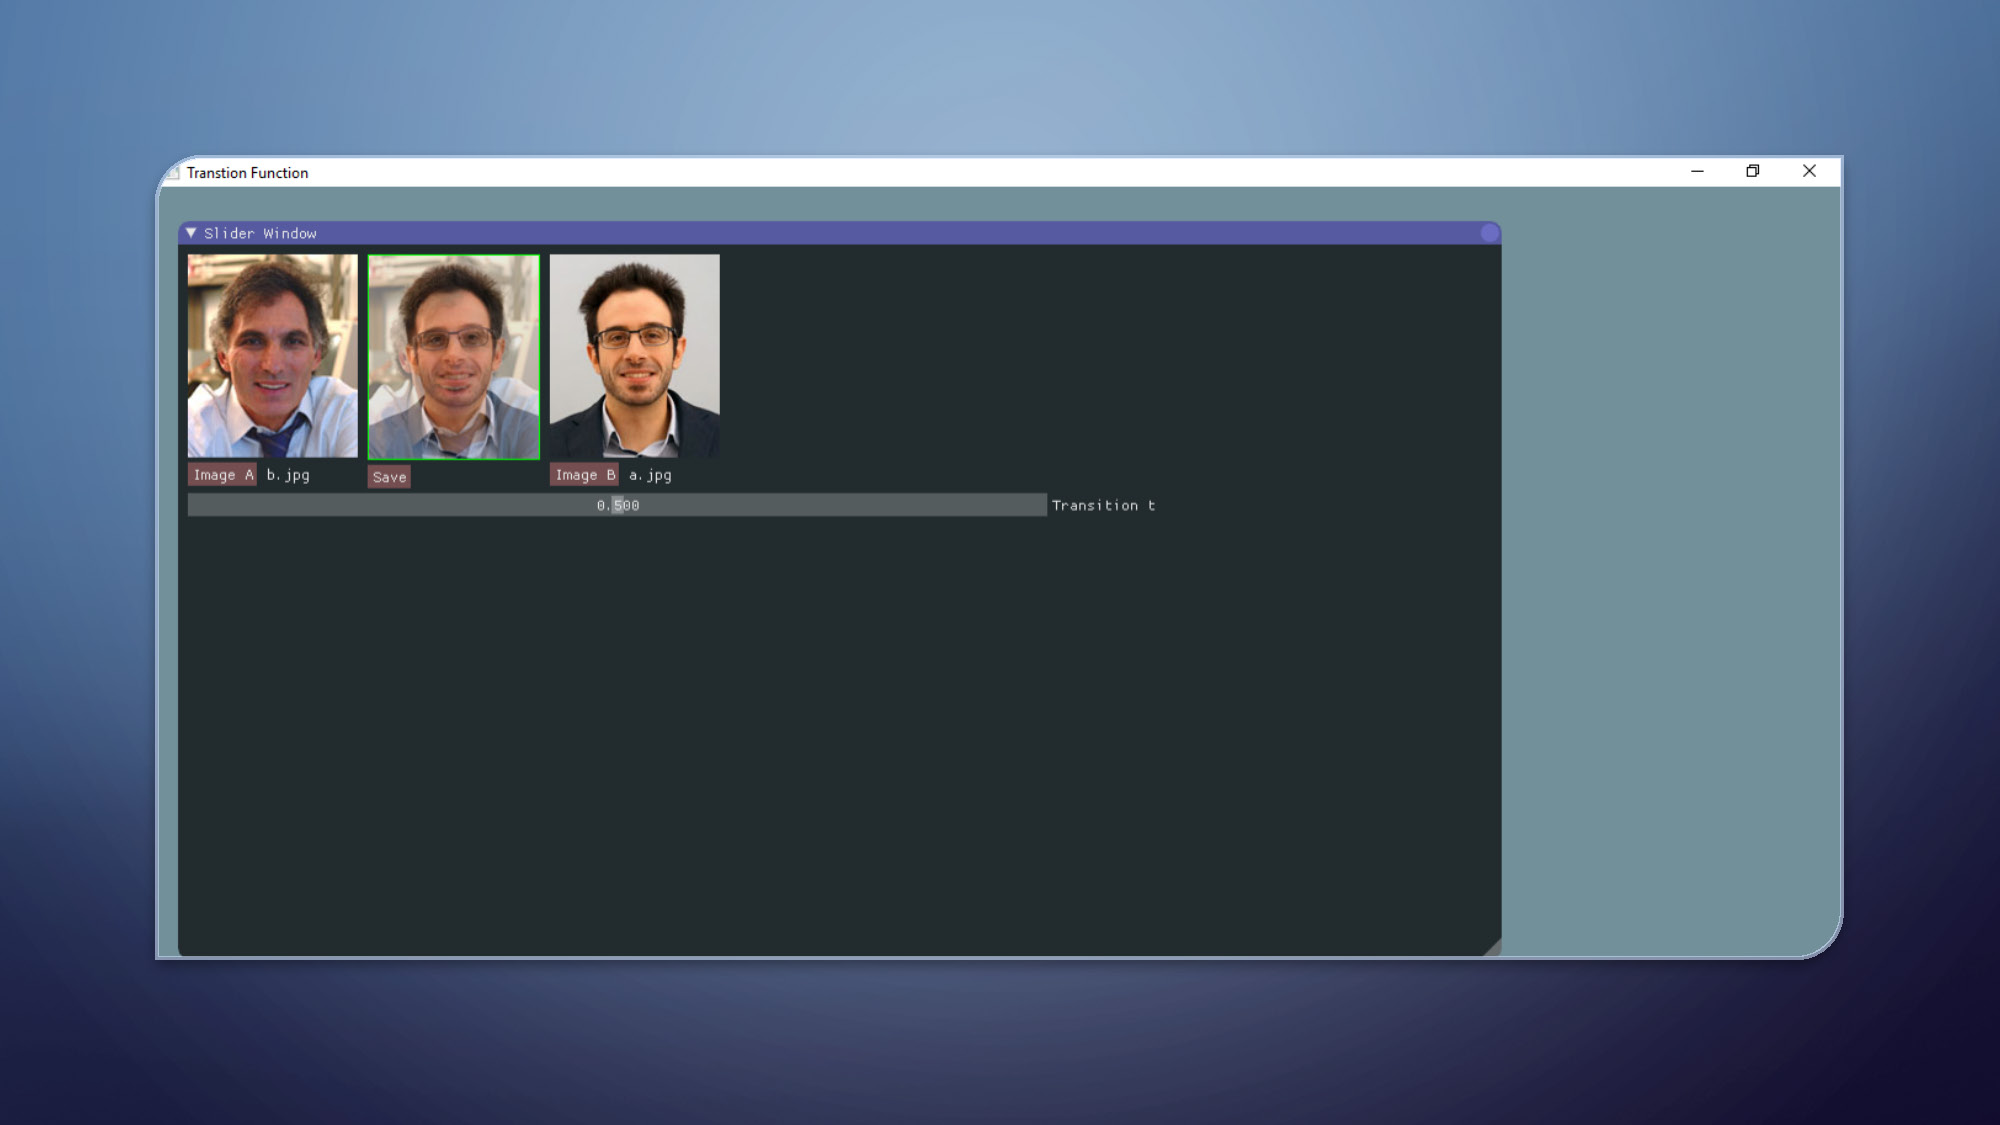
Transition Functions
The image displays a GUI titled "Transition Function". The main window shows two larger images of male faces side-by-side, labeled "Image A" and "Image B". A third image of a man's face is positioned between them. There is a horizontal slider with the number "0.000" below it. A "Save" button is also present. The text "Transition t" appears to the right of the slider.
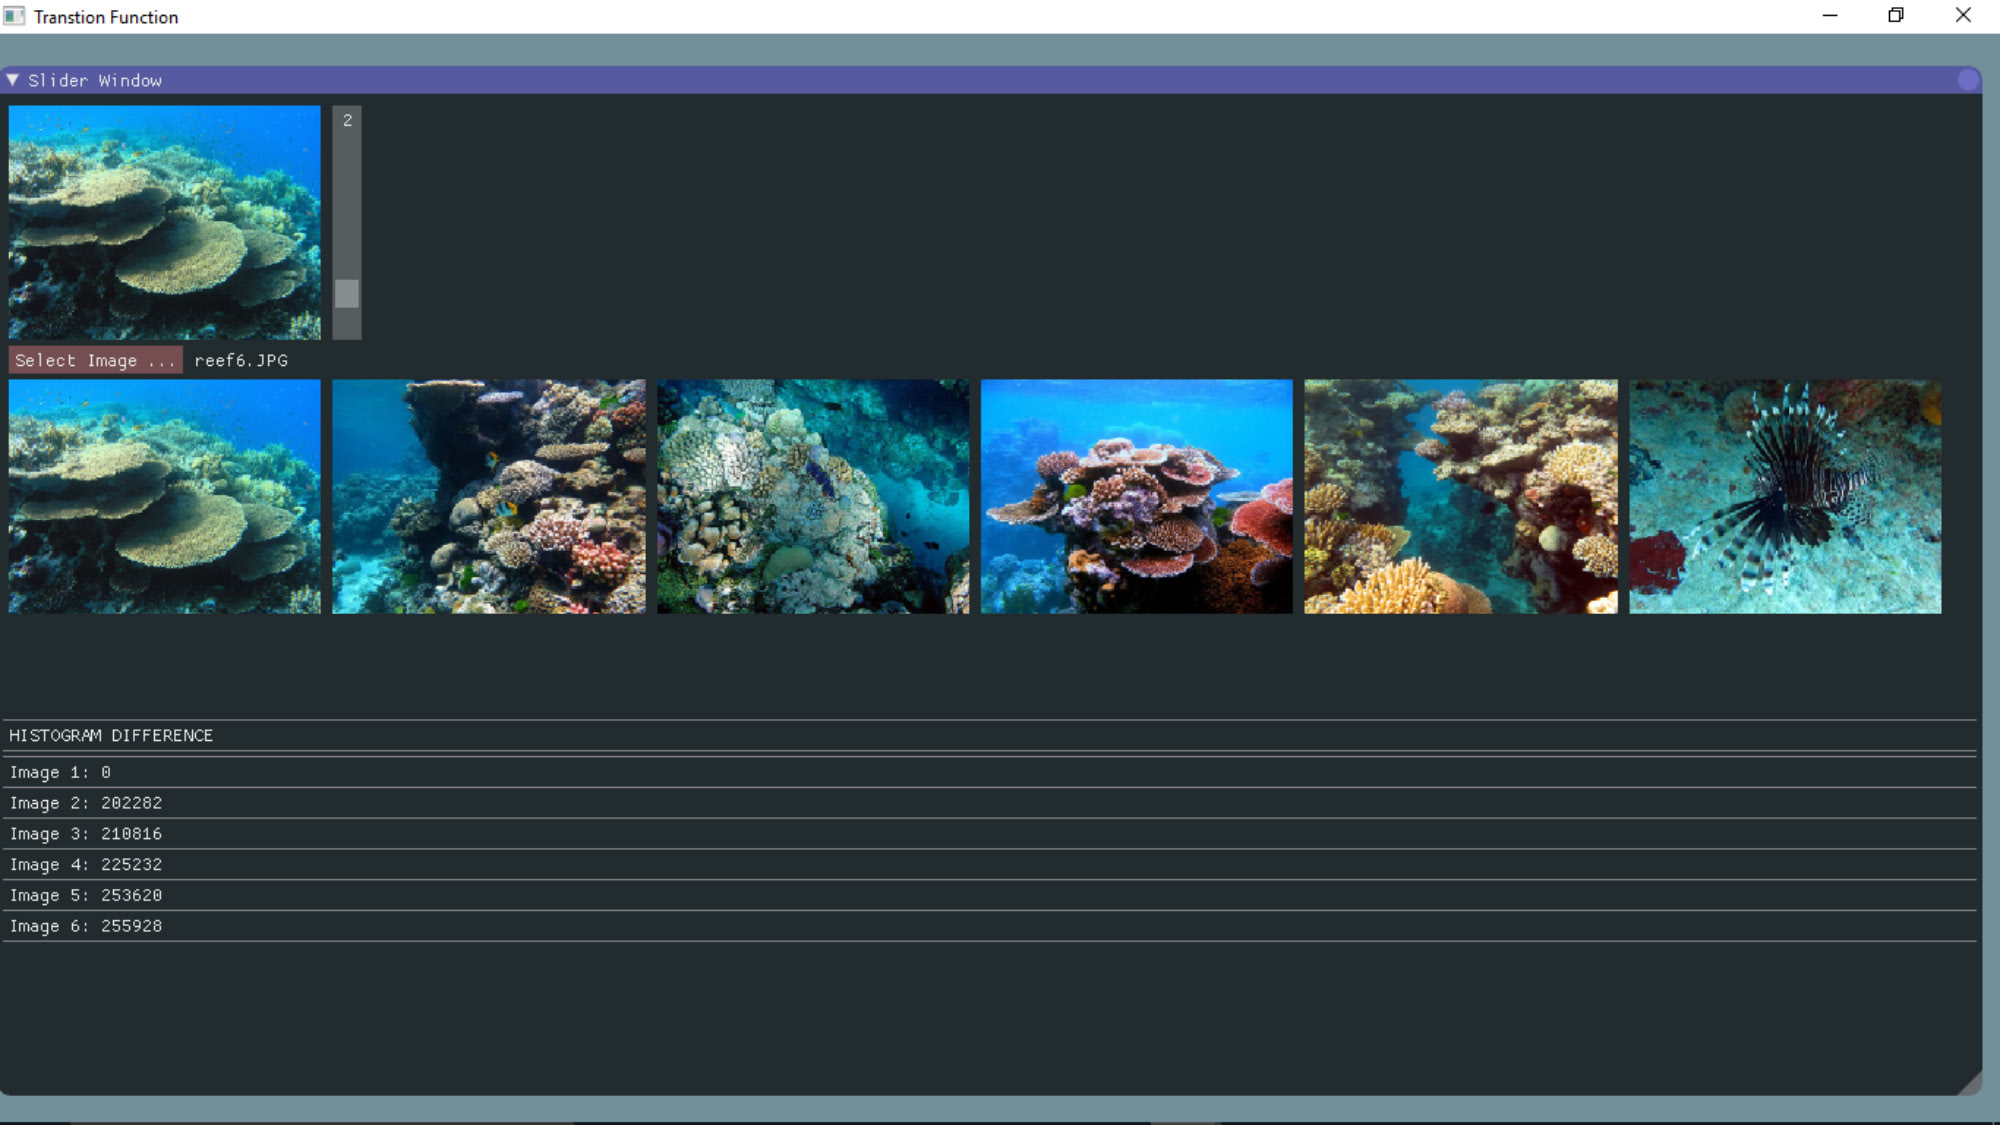
Transition Functions
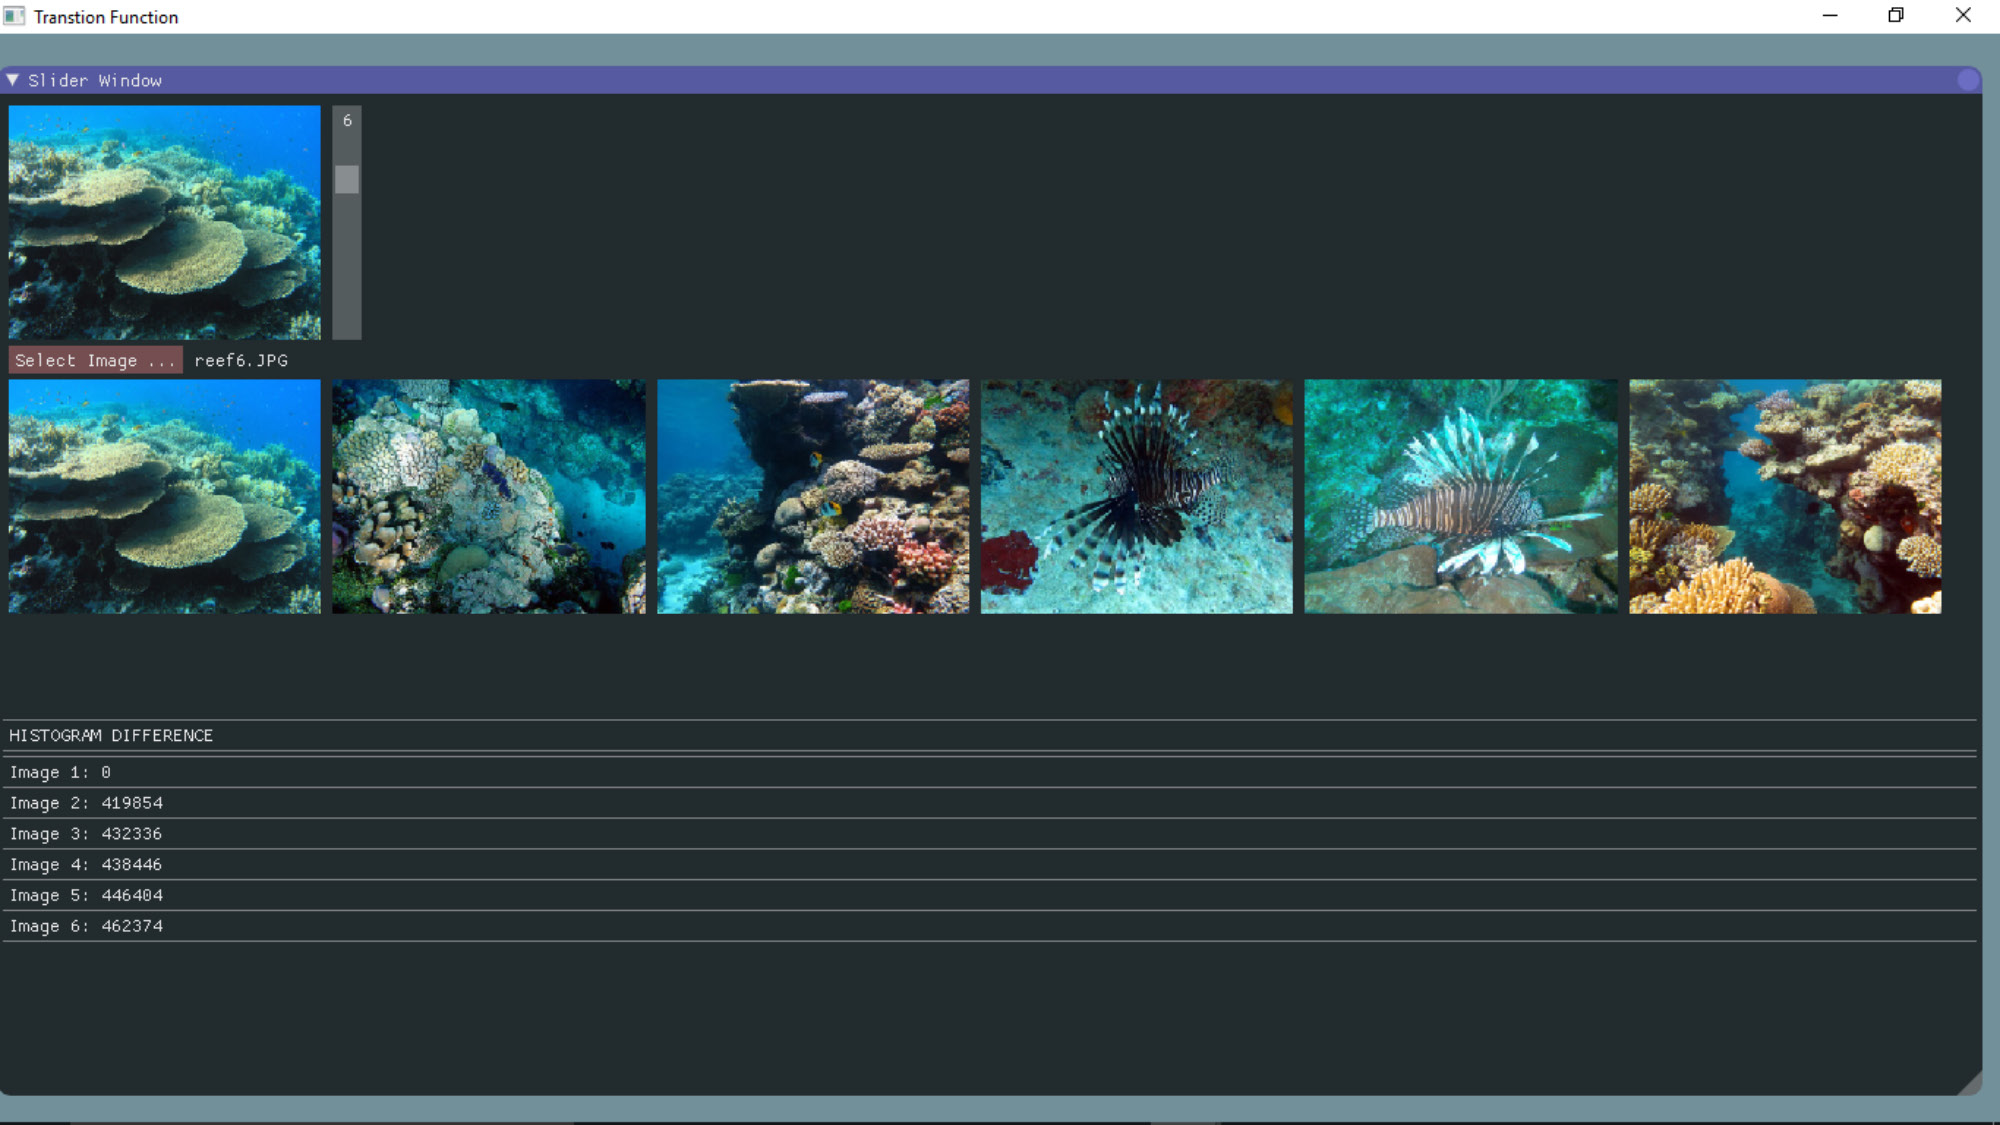
This image shows a GUI with a "Transition Function" title. It features a "Slider Window" section with a larger image of a coral reef and a row of six smaller thumbnail images below it, depicting various underwater scenes including coral reefs and a lionfish. A number "2" is shown in a small text box. The "HISTOGRAM DIFFERENCE" section below lists "Image 1" through "Image 6" with corresponding numerical values. "Image 1" has a value of "0".
Transition Functions
A graphical user interface (GUI) is displayed with a title bar labeled "Transition Function". The interface has a main window with two primary sections. The top section, labeled "Slider Window," shows a selected image of a coral reef and a row of six thumbnail images below it, also of coral reefs and a lionfish. A number "6" is visible in a small text box. The bottom section, labeled "HISTOGRAM DIFFERENCE," lists "Image 1" through "Image 6" with numerical values next to each. The value for "Image 1" is "0".
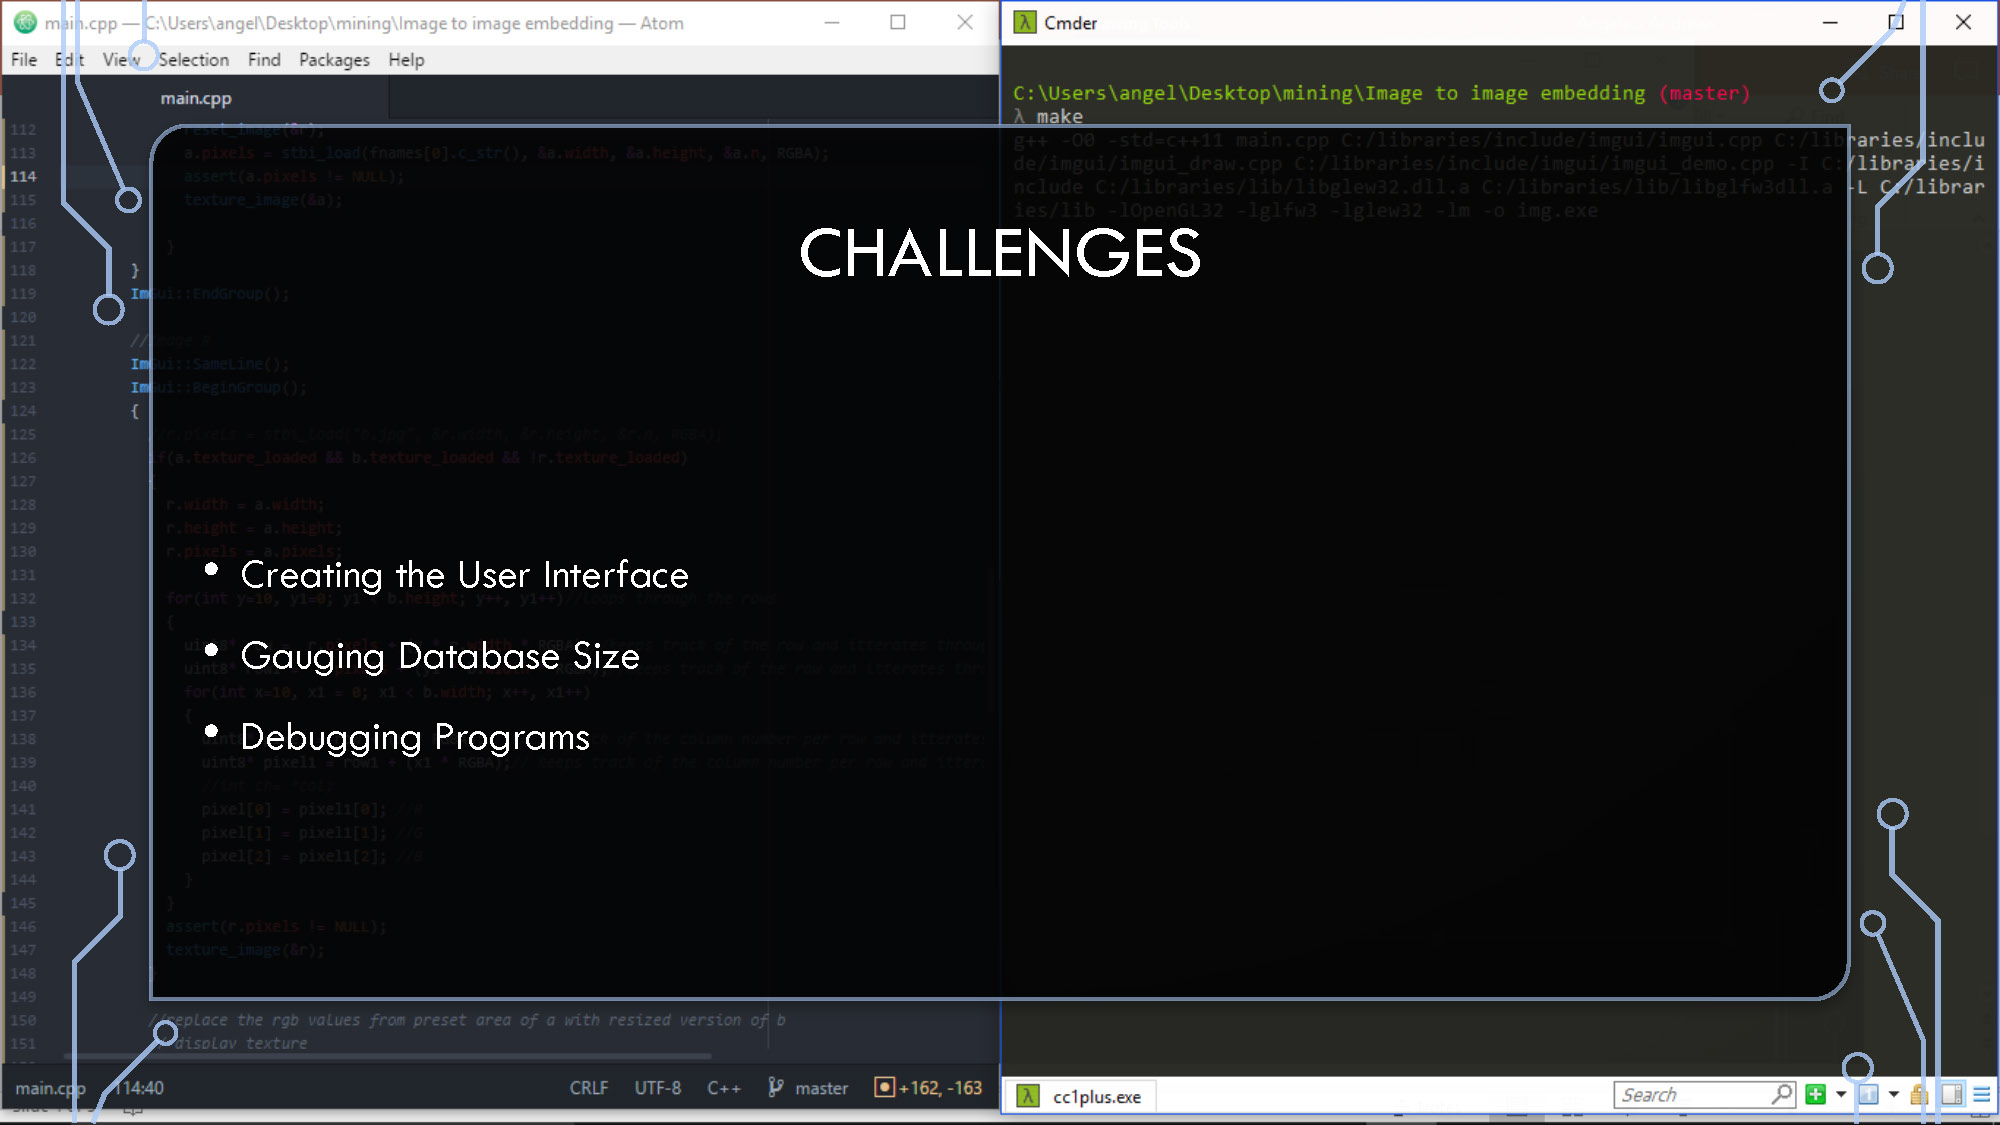
CHALLENGES
- Creating the User Interface
- Gauging Database Size
- Debugging Programs

END RESULT AND FUTURE WORK
- Finalize Drafts
- Send for Publishing
- Textbook Supplement

End of Presentation
Click the right arrow to return to the beginning of the slide show.
For a downloadable version of this presentation, email: I-SENSE@FAU.