Monitoring Interactions in Therapeutic Relationships
Monitoring Interactions in Therapeutic Relationships
Presented by Kirielle Singarajah

Kirielle Singarajah
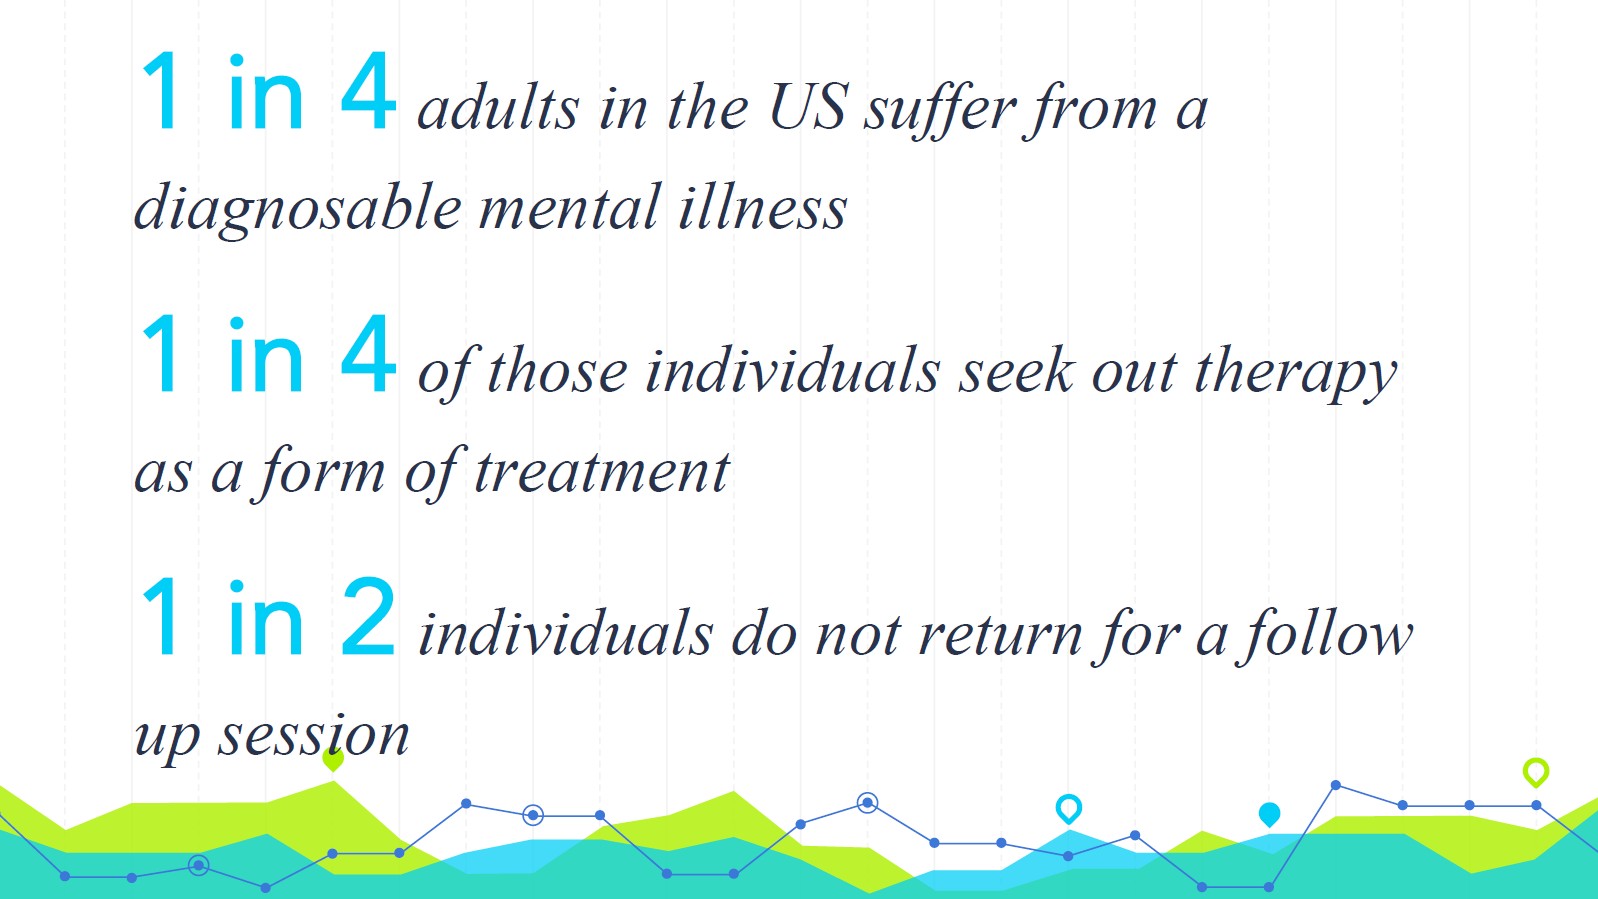
1 in 4 adults in the US suffer from a diagnosable mental illness
1 in 2 individuals do not return for a follow up session
1 in 4 of those individuals seek out therapy as a form of treatment
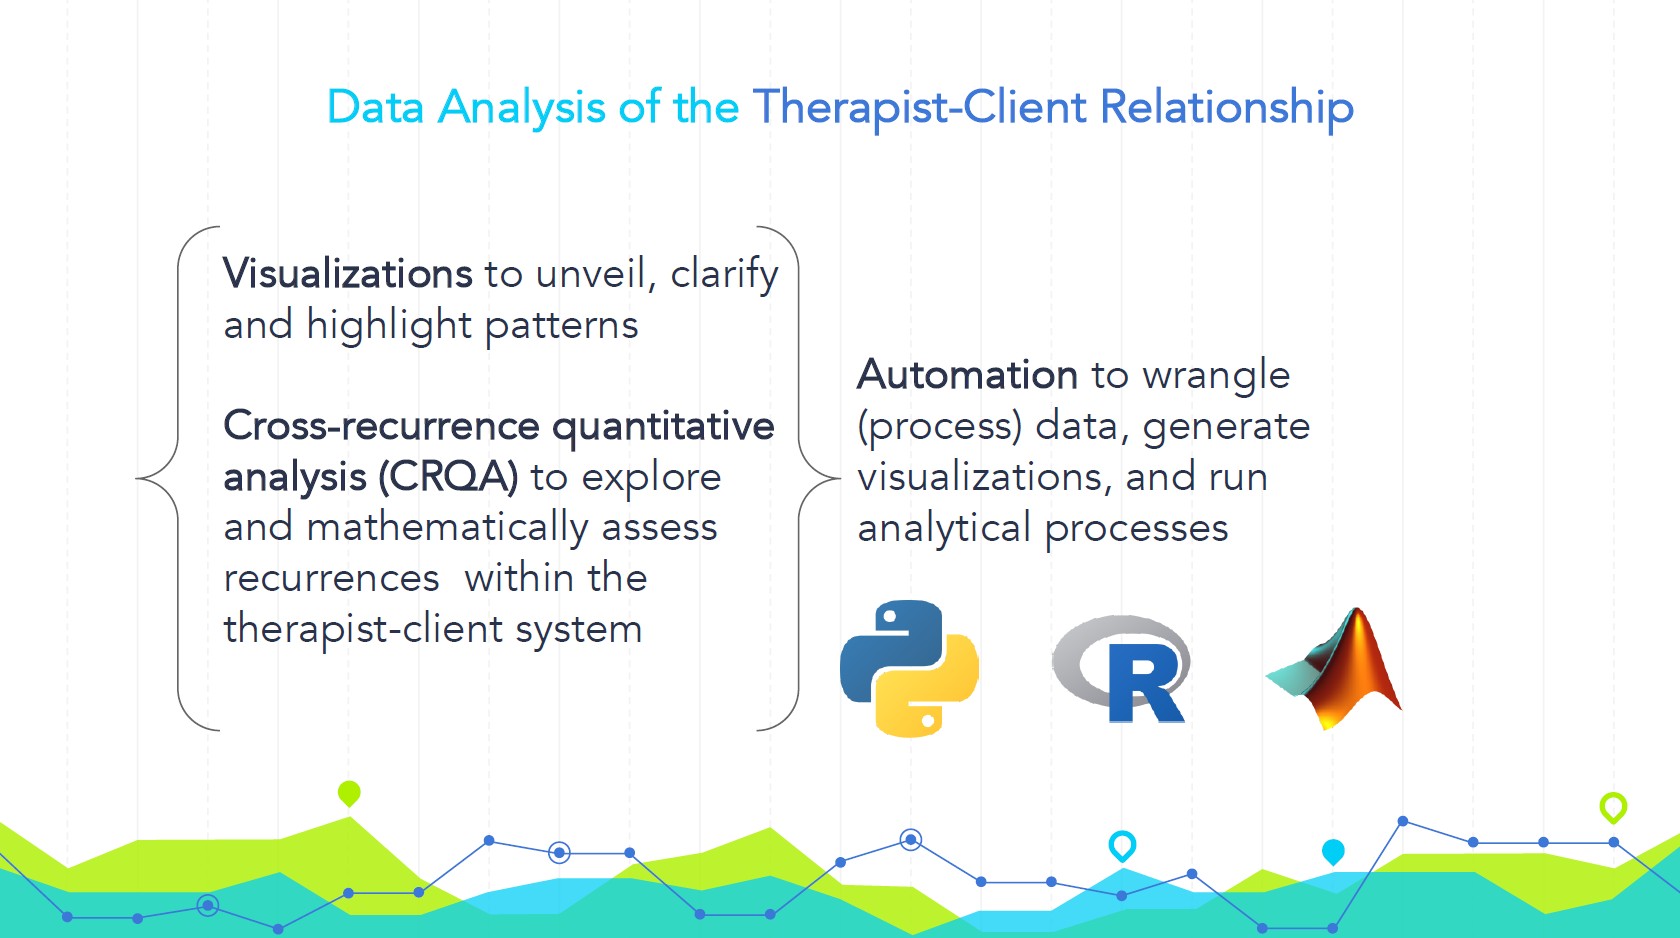
Data Analysis of the Therapist-Client Relationship
Visualizations to unveil, clarify and highlight patterns
Cross-recurrence quantitative analysis (CRQA) to explore and mathematically assess recurrences within the therapist-client system
Automation to wrangle (process) data, generate visualizations, and run analytical processes
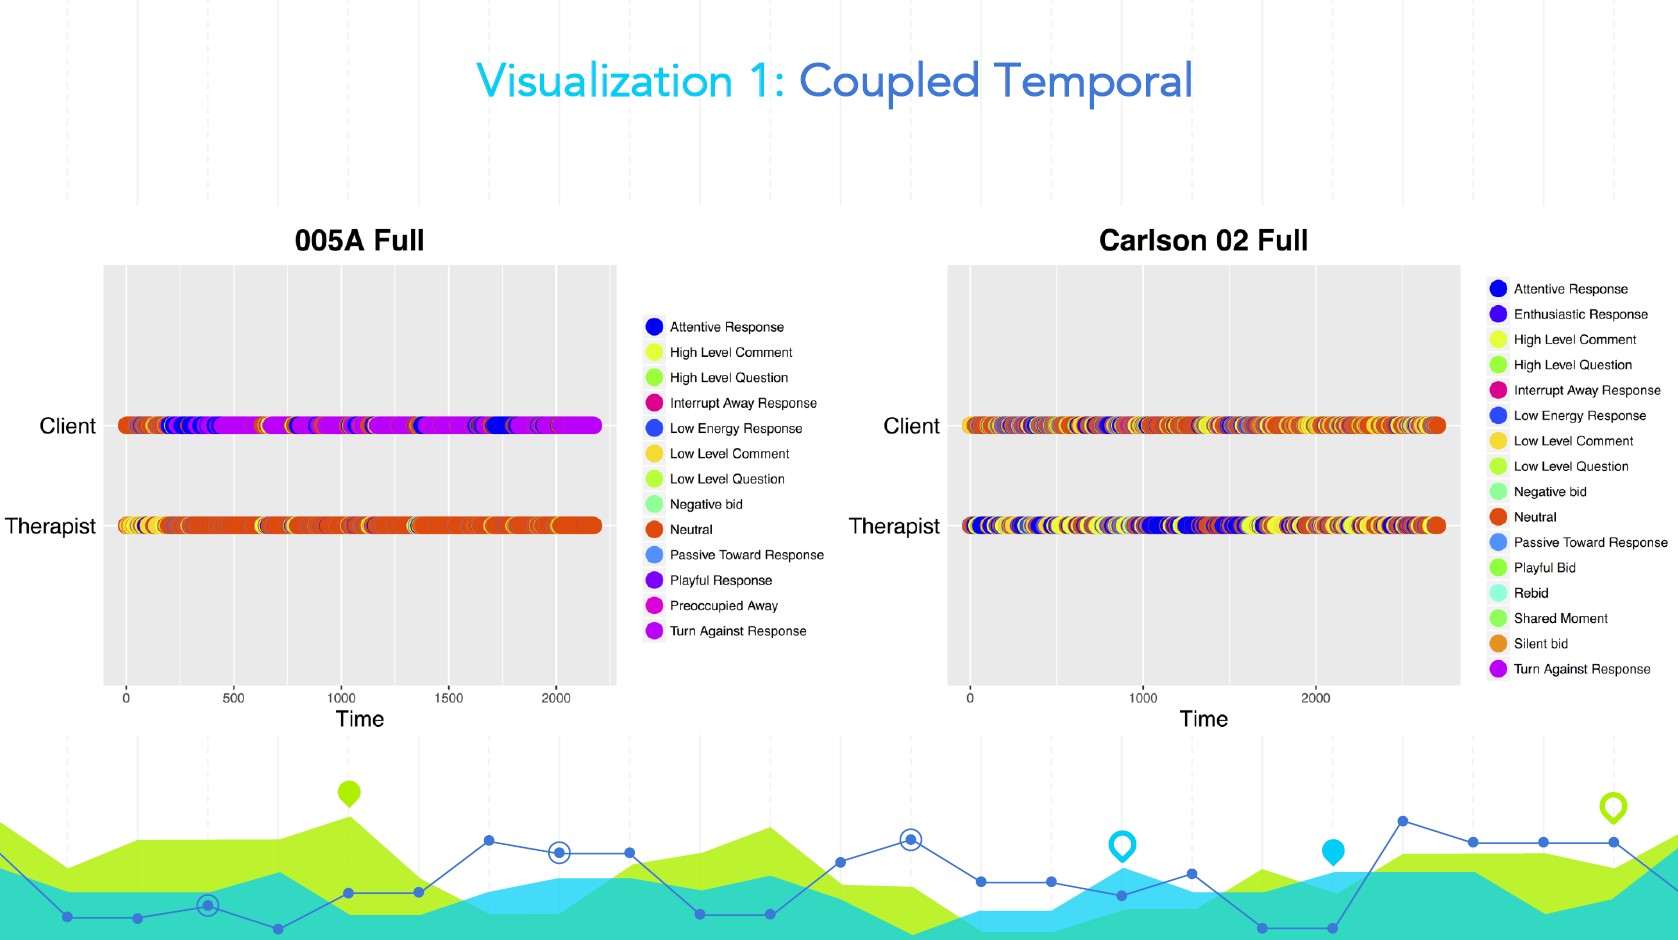
Visualization 1: Coupled Temporal
Two horizontal bar graphs side-by-side, titled "Visualization 1: Coupled Temporal". The left graph is labeled "005A Full" and the right graph is labeled "Carlson 02 Full". Both graphs show two horizontal rows of colored circles, one labeled "Client" and one labeled "Therapist", plotted against a "Time" axis. A legend to the right of the graphs lists various colored labels, including "Attentive Response", "Enthusiastic Response", "High Level Comment", and others.
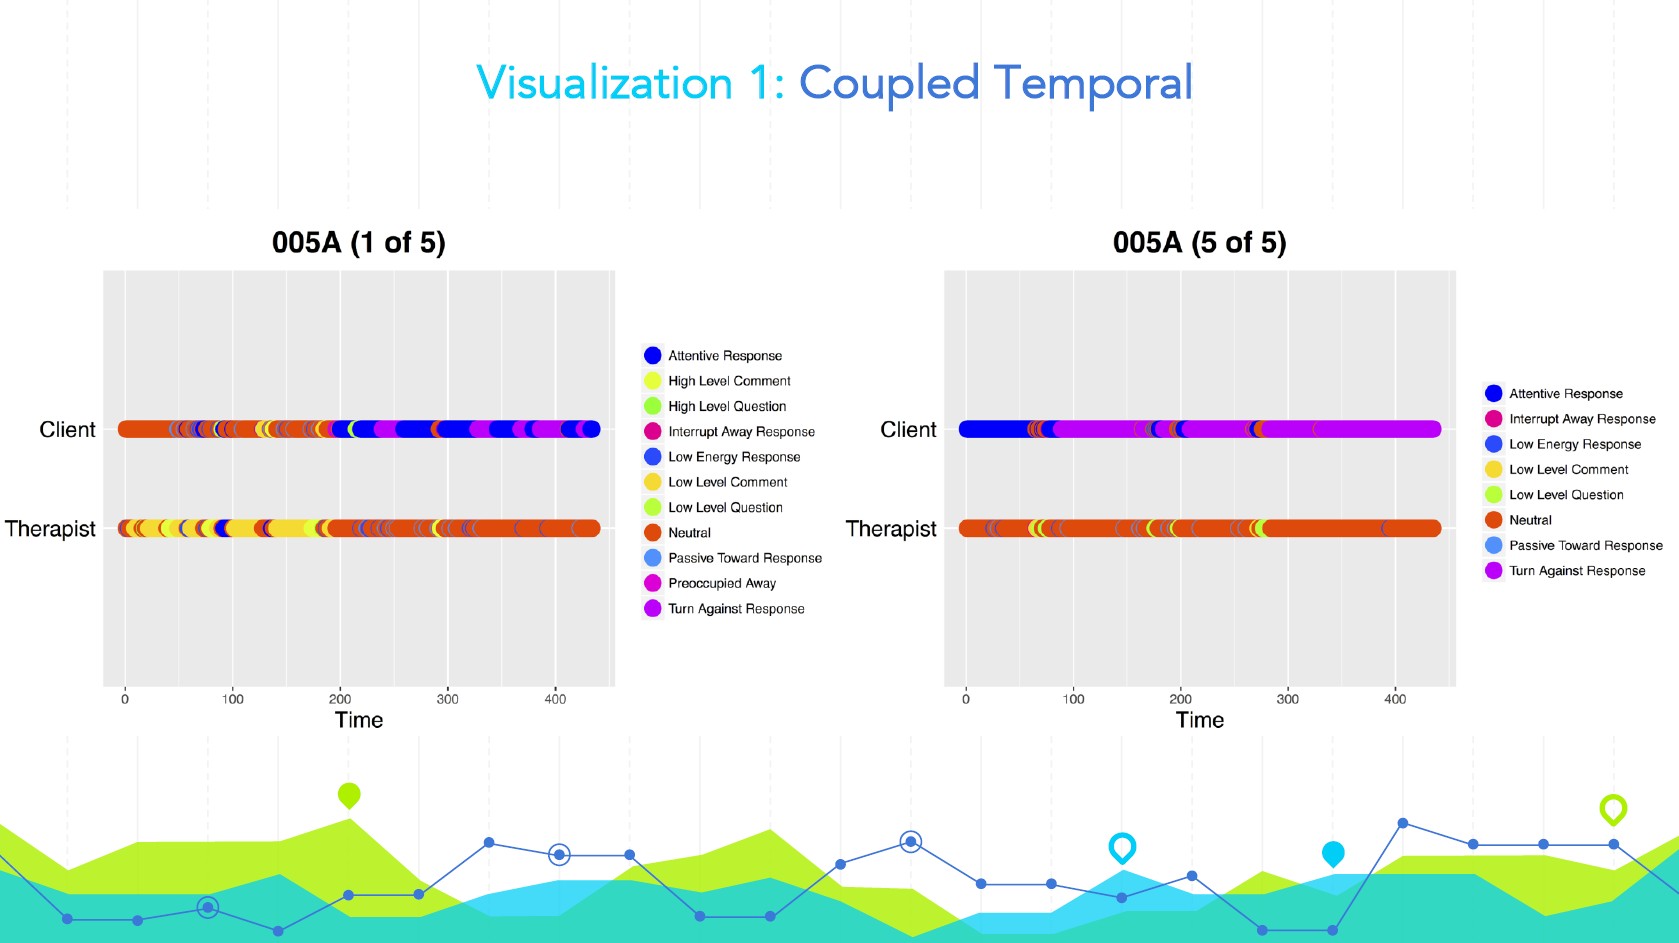
Visualization 1: Coupled Temporal (continued)
Two horizontal bar graphs side-by-side, titled "Visualization 1: Coupled Temporal". Both graphs are labeled "005A" but with different subtitles: "1 of 5" on the left and "5 of 5" on the right. Both graphs show two horizontal rows of colored circles, one labeled "Client" and one labeled "Therapist", plotted against a "Time" axis. A legend to the right lists various colored labels, including "Attentive Response", "Interrupt Away Response", "Low Energy Response", and "Neutral". The legend for the graph on the right is a shorter version of the legend for the graph on the left.
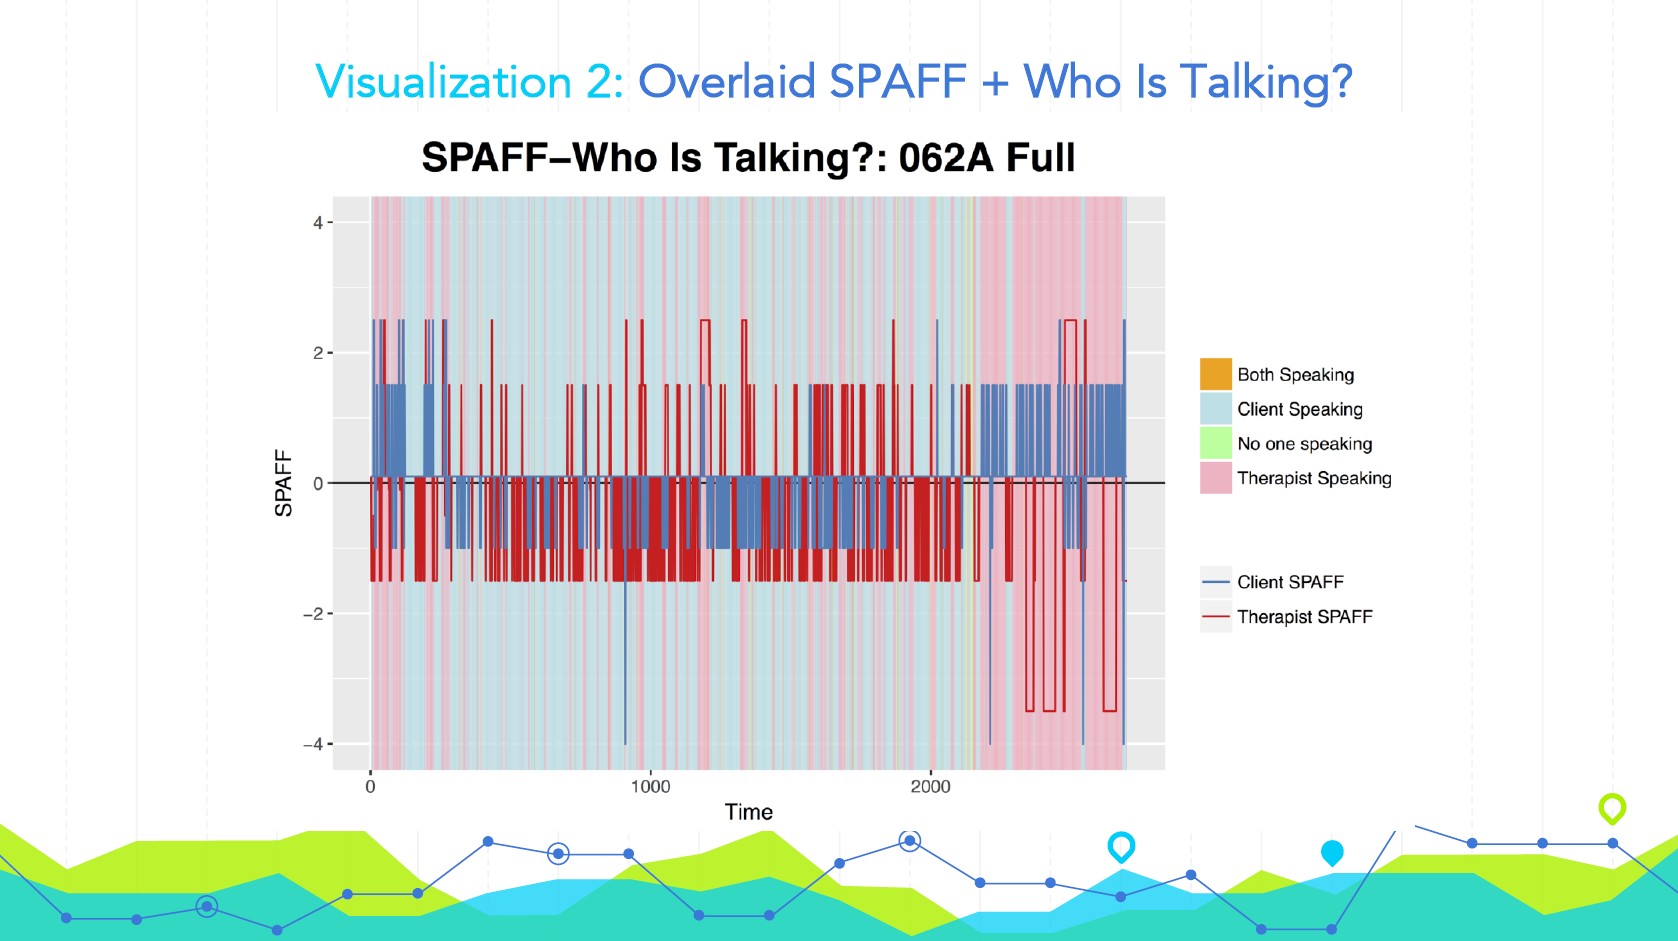
Visualization 2: Overlaid SPAFF + Who Is Talking?
A bar graph titled "Visualization 2: Overlaid SPAFF + Who Is Talking?". The x-axis is "Time" and the y-axis is "SPAFF". The graph shows vertical colored bars overlaid with two line graphs, one blue and one red. A legend indicates that orange bars represent "Both Speaking", green represents "Client Speaking", light blue represents "No one speaking", and pink represents "Therapist Speaking". The blue line graph is labeled "Client SPAFF" and the red line graph is labeled "Therapist SPAFF".
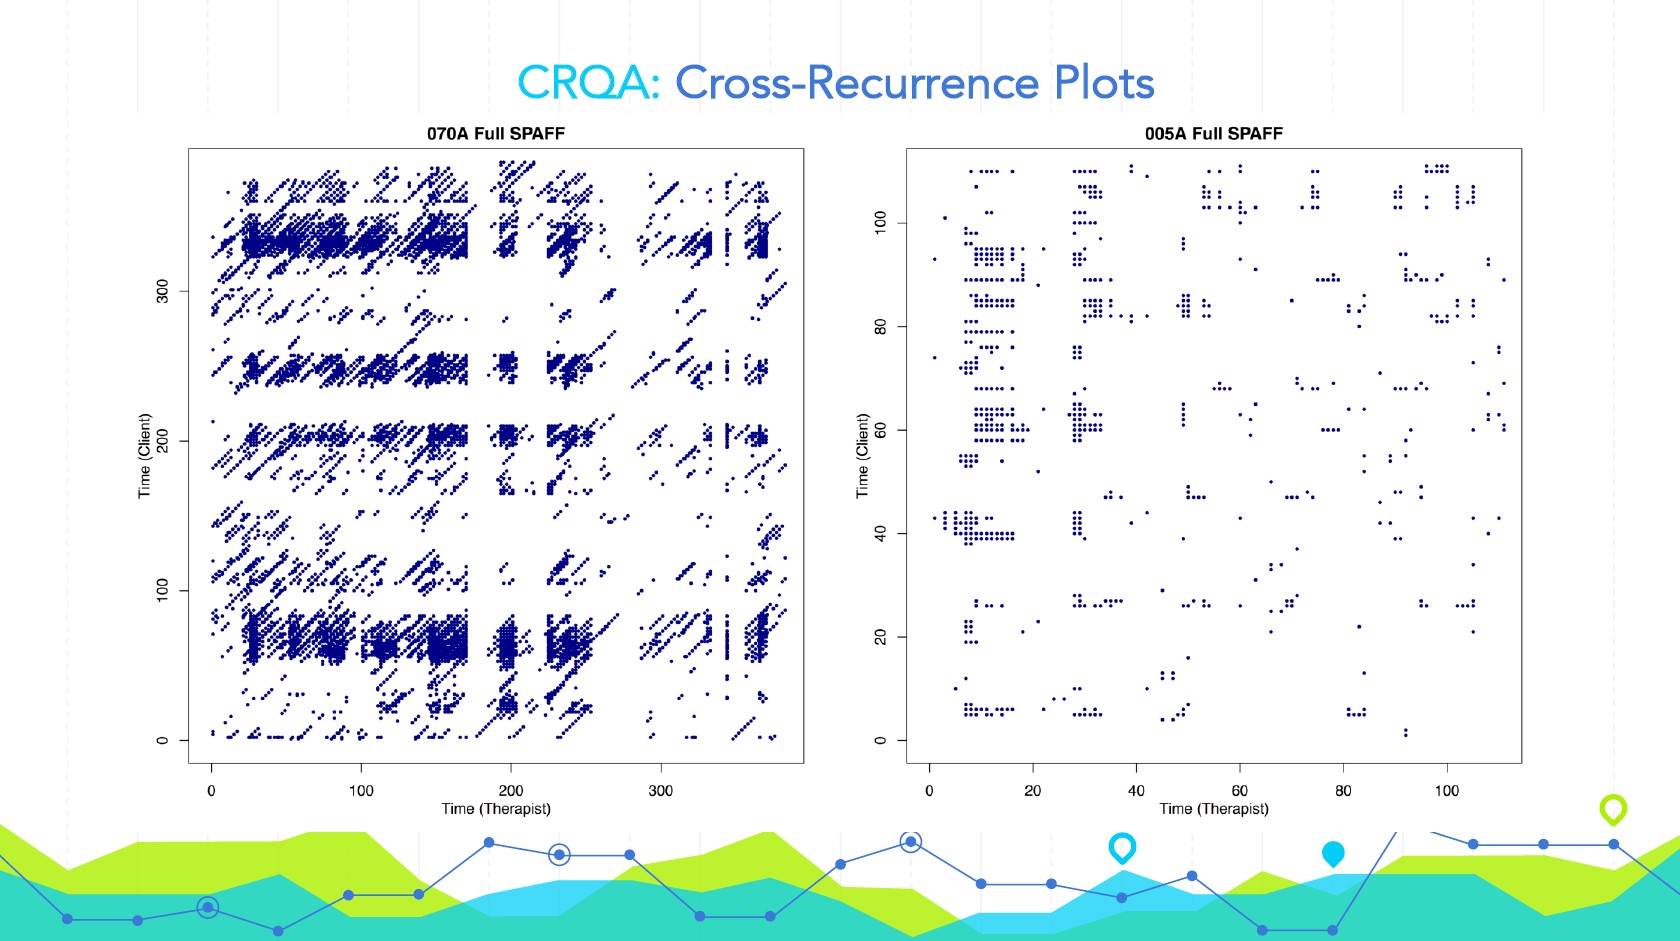
CRQA: Cross-Recurrence Plots
Two scatter plots side-by-side, titled "CRQA: Cross-Recurrence Plots". The plot on the left is labeled "070A Full SPAFF" and the plot on the right is labeled "005A Full SPAFF". Both plots show a grid with small blue dots. The x-axis for both plots is "Time (Therapist)" and the y-axis for both is "Time (Client)". The pattern of dots is different between the two plots.
Challenges
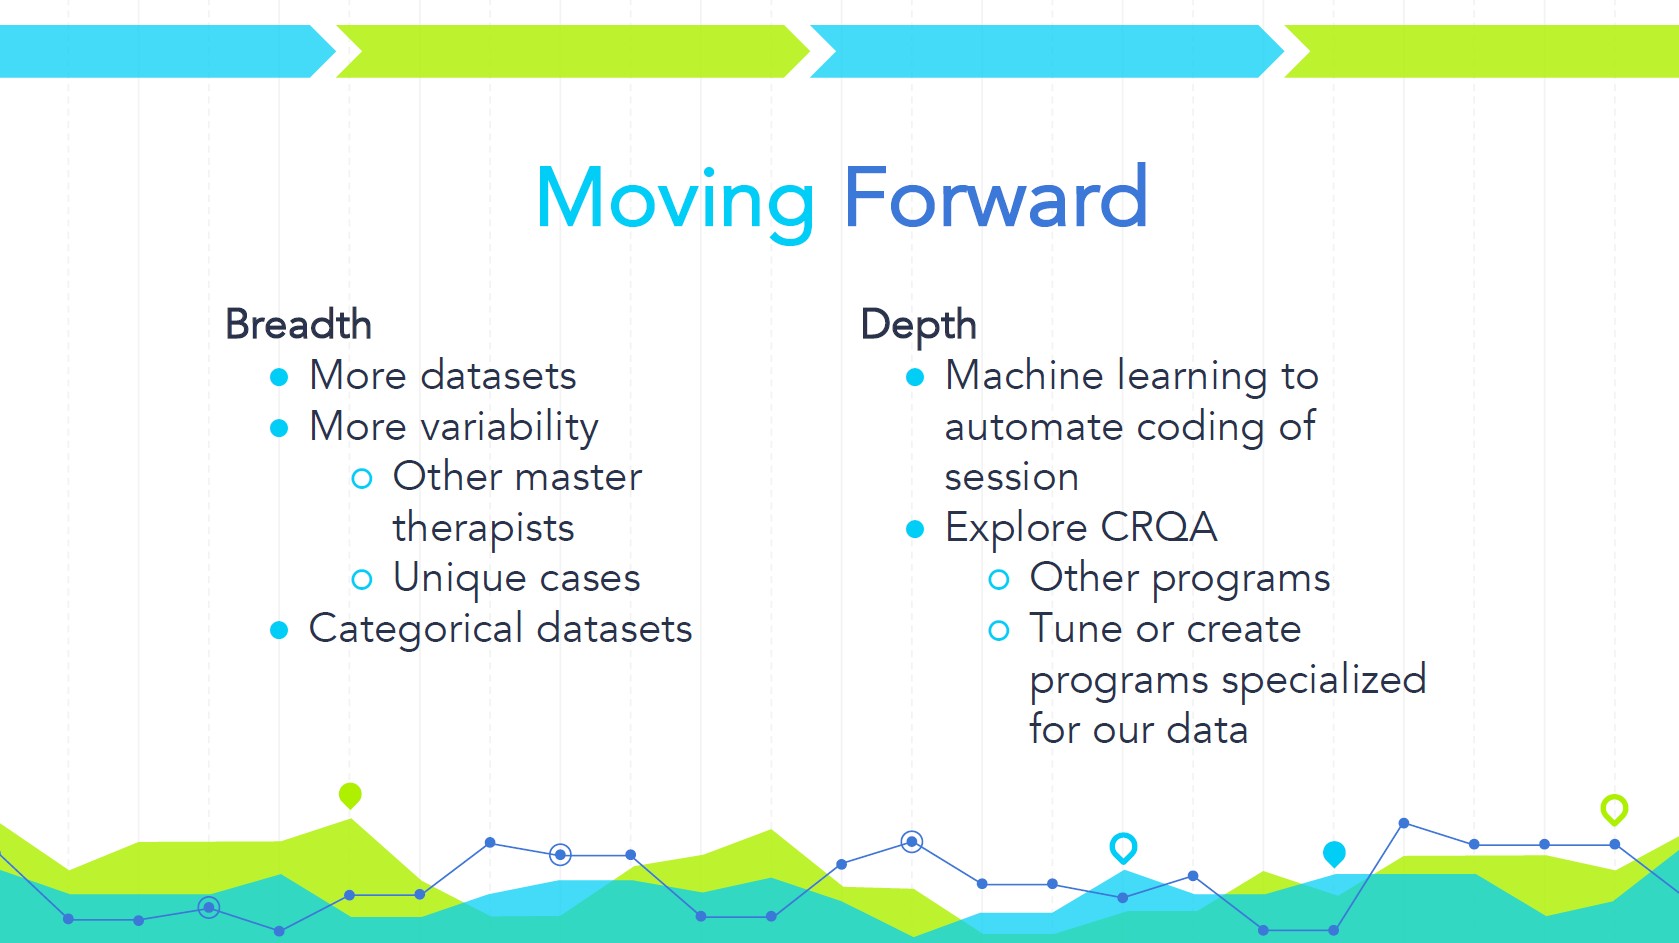
Moving Forward
Breadth
- More datasets
- More variability
- Other master therapists
- Unique cases
- Categorical datasets
Depth
- Machine learning to automate coding of session
- Explore CRQA
- Other programs
- Tune or create programs specialized for our data
Thank you!

End of Presentation
Click the right arrow to return to the beginning of the slide show.
For a downloadable version of this presentation, email: I-SENSE@FAU.