Marine Energy Prototype Development: From Wave Energy Conversion to Ocean Current Turbine Design
NSF REU Site in Sensing and Smart Systems
Marine Energy Prototype Development: From Wave Energy Conversion to Ocean Current Turbine Design
Irem Ider (University of Florida)
Shania Ziegler (Brigham Young University)
Dr. Yufei Tang
Summer 2026
Logos shown: National Science Foundation (NSF), Florida Atlantic University, and I-SENSE: The Institute for Smarter Cities, Spaces, and Health.
Why Marine Energy?
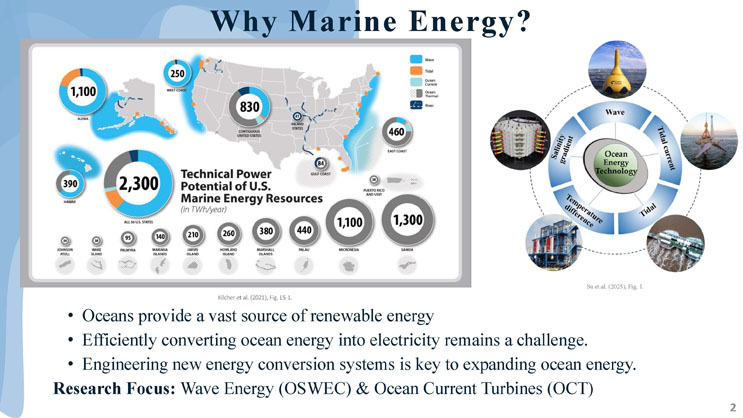
A map of the United States and its territories shows the technical power potential of U.S. marine energy resources, measured in terawatt-hours per year (TWh/year), broken down by resource type: Wave, Tidal, Ocean Current, Ocean Thermal, and River. Regional totals include: Alaska 1,100; West Coast 250; Contiguous United States 830; Inland States 41; East Coast 460; Gulf Coast 84; Hawaii 390; Puerto Rico and USVI 38; and the combined total for all 50 U.S. states is 2,300. Pacific island totals include Johnson Atoll 35, Wake Island 38, Palmyra 95, Mariana Islands 140, Jarvis Island 210, Howland Island 260, Marshall Islands 380, Palau 440, Micronesia 1,100, and Samoa 1,300. Source: Kilcher et al. (2021), Fig. ES-1.
A circular diagram labeled "Ocean Energy Technology" at its center is surrounded by five segments with representative photographs: Wave, Tidal current, Tidal, Temperature difference, and Salinity gradient. Source: Su et al. (2025), Fig. 1.
- Oceans provide a vast source of renewable energy
- Efficiently converting ocean energy into electricity remains a challenge.
- Engineering new energy conversion systems is key to expanding ocean energy.
Research Focus: Wave Energy (OSWEC) & Ocean Current Turbines (OCT)
Background Research
- Oscillating Surge Wave Energy Converter Using a Novel Above-Water PTO (Mi et al., 2024)
- Improved OSWEC power take-off design.
- Limited experimental prototype validation.
- Modeling, Dynamic Simulation, and Loading Assessment of a Buoyancy-Controlled Dual-Rotor OCT (Mokari et
al., 2026)
- Introduced the twin-turbine design and modeling.
- No prototype for experimental validation.
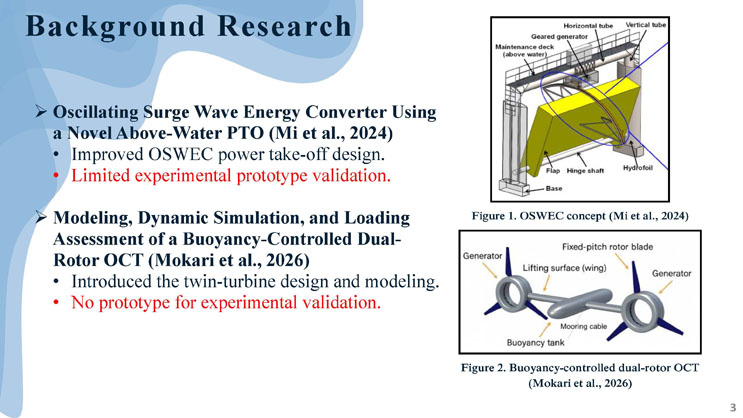
Figure 1: OSWEC concept (Mi et al., 2024). A labeled diagram shows a flap and hydrofoil hinged at a base beneath the waterline, connected via a hinge shaft to a mechanism above water consisting of a horizontal tube, vertical tube, geared generator, and maintenance deck.
Figure 2: Buoyancy-controlled dual-rotor OCT (Mokari et al., 2026). A labeled diagram shows two generators, each driving a fixed-pitch rotor blade, connected by a central lifting surface (wing) with a buoyancy tank below and a mooring cable anchoring the assembly.
Project I: Oscillating Surge Wave Energy Converter (OSWEC)
Overview
- Converts wave motion into electricity.
- Utilizes an above-water power take-off (PTO) system.
- Designed for nearshore wave energy harvesting.
Project Objective
- Improve and evaluate an existing OSWEC prototype.
Starting Point
- Existing CAD model developed by previous REU researchers.
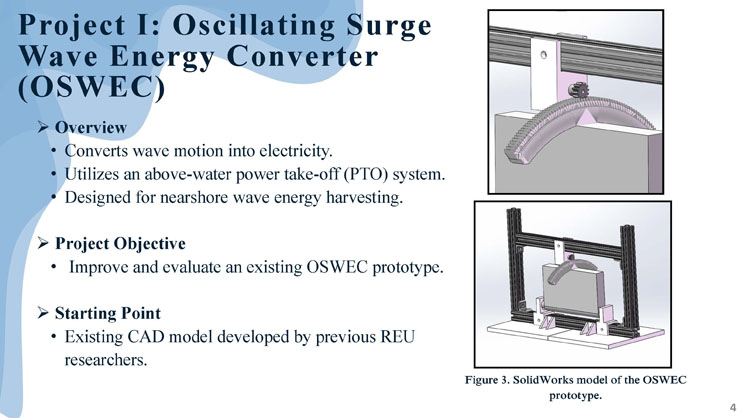
Figure 3: SolidWorks model of the OSWEC prototype. Two CAD renderings show a curved flap with a gear-and-chain mechanism at the top mounted inside an aluminum extrusion frame, and the full frame assembly standing on a mounting base.
Prototype Development
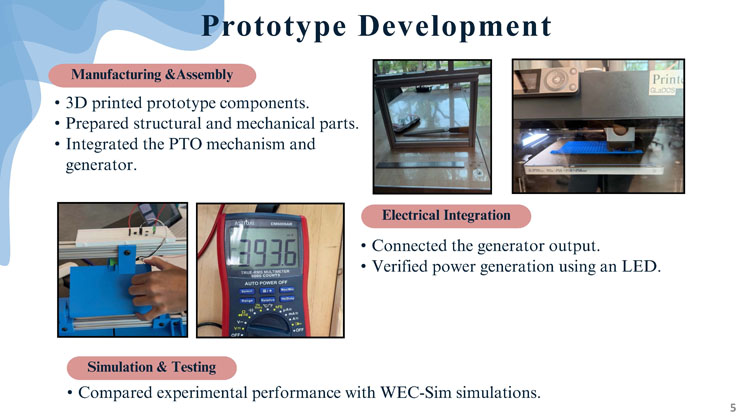
Manufacturing & Assembly
- 3D printed prototype components.
- Prepared structural and mechanical parts.
- Integrated the PTO mechanism and generator.
Photos show a glass and aluminum-frame flap component on a tiled floor, and a 3D printer labeled "GLaDOS" mid-print of a small blue part.
Electrical Integration
- Connected the generator output.
- Verified power generation using an LED.
Photos show a breadboard wired with a small circuit, and a digital multimeter (Astroai DM6000AR) displaying a reading of 393.6 (millivolts), along with a hand pressing a button on a blue 3D-printed component mounted on the frame.
Simulation & Testing
- Compared experimental performance with WEC-Sim simulations.
Prototype Improvements
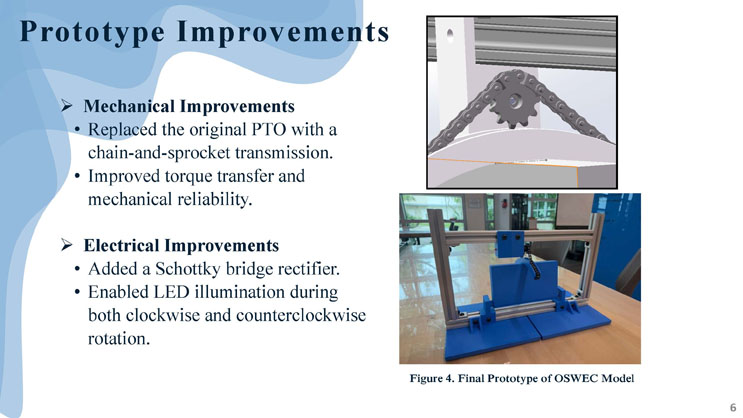
Mechanical Improvements
- Replaced the original PTO with a chain-and-sprocket transmission.
- Improved torque transfer and mechanical reliability.
Electrical Improvements
- Added a Schottky bridge rectifier.
- Enabled LED illumination during both clockwise and counterclockwise rotation.
Figure 4: Final Prototype of OSWEC Model. A close-up photo shows the chain-and-sprocket mechanism mounted at the top of the curved flap, and a second photo shows the complete blue 3D-printed prototype assembled within its aluminum frame on a tabletop.
Simulation Software
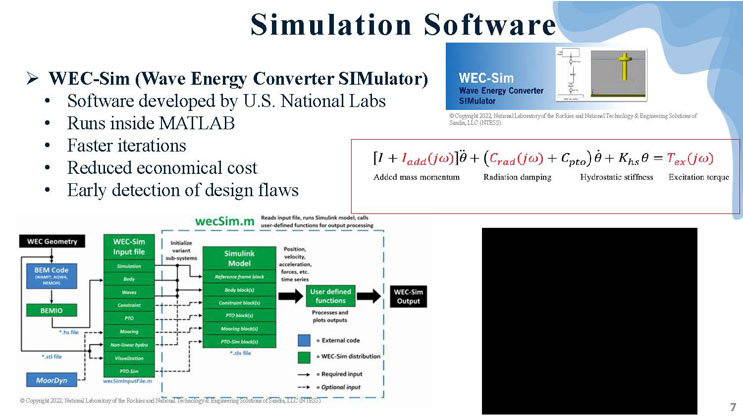
WEC-Sim (Wave Energy Converter SIMulator)
- Software developed by U.S. National Labs
- Runs inside MATLAB
- Faster iterations
- Reduced economical cost
- Early detection of design flaws
Governing equation of motion, shown with labeled terms: [I + I_add(jω)]θ̈ + (C_rad(jω) + C_pto)θ̇ + K_hs θ = T_ex(jω), where I + I_add(jω) is the added mass momentum term, C_rad(jω) + C_pto is the radiation damping term, K_hs θ is the hydrostatic stiffness term, and T_ex(jω) is the excitation torque term.
A flow diagram illustrates the WEC-Sim architecture: WEC Geometry feeds into a BEM Code (WAMIT, AQWA, or NEMOH), which passes through BEMIO to produce a *.hs file and *.stl file; a MoorDyn module is also included. These, along with a WEC-Sim Input file (containing Simulation, Body, Waves, Constraint, PTO, Mooring, Non-linear hydro, Visualization, and PTO-Sim settings, saved as wecSimInputFile.m), feed into wecSim.m, which reads the input file, runs the Simulink model, and calls user-defined functions for output processing. The Simulink Model contains a Reference frame block, Body block(s), Constraint block(s), PTO block(s), Mooring block(s), and PTO-Sim block(s), saved as a *.slx file, and it initializes variant sub-systems. The Simulink Model outputs position, velocity, acceleration, forces, and other time series data, which is passed to user-defined functions that process and plot outputs, producing the final WEC-Sim Output. The diagram legend indicates blue boxes represent external code, green boxes represent the WEC-Sim distribution, solid arrows represent required input, and dashed arrows represent optional input. A screen capture area (rendered black) is also present, likely representing an embedded video or animation. Copyright 2022, National Laboratory of the Rockies and National Technology & Engineering Solutions of Sandia, LLC (NTESS).
Simulation Results
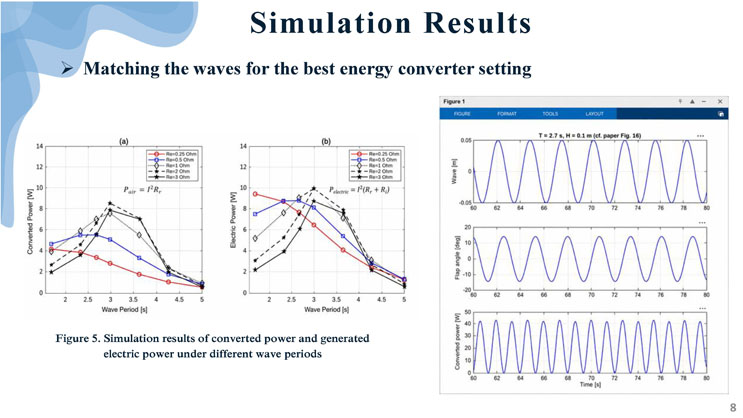
Matching the waves for the best energy converter setting
Figure 5: Simulation results of converted power and generated electric power under different wave periods, presented as two line charts labeled (a) and (b), each plotting five curves for load resistances Re = 0.25, 0.5, 1, 2, and 3 Ohm across a wave period range of roughly 1.5 to 5 seconds.
Chart (a) plots Converted Power (P_air = I²R_r) in watts, ranging from 0 to 14 W, against Wave Period in seconds. The higher-resistance curves (Re = 2 and 3 Ohm) peak near a wave period of about 3 seconds at roughly 8 W, then decline toward higher periods. The Re = 0.5 Ohm curve peaks around 5.5 W near a 2 to 2.5 second period. The Re = 0.25 Ohm curve stays lowest, peaking around 4 W near a 1.5 to 2 second period, and all curves converge toward low power (under 2 W) by a 5 second wave period.
Chart (b) plots Electric Power (P_electric = I²(R_r + R_i)) in watts, also ranging from 0 to 14 W, against Wave Period in seconds. The Re = 0.25 Ohm curve peaks highest and earliest, around 9.5 W near a 1.5 second wave period, while the other curves (Re = 0.5, 1, 2, and 3 Ohm) peak later, around 7.5 to 8 W near a 2.5 to 3 second wave period. All curves converge to low power by a 4.5 to 5 second wave period.
A MATLAB figure window on the right shows three stacked time-series subplots for a wave period T = 2.7 s and wave height H = 0.1 m (referencing paper Figure 16), over a time window of 60 to 80 seconds: the top subplot shows Wave height in meters oscillating smoothly between about -0.05 and 0.05 m; the middle subplot shows Flap angle in degrees oscillating between about -15 and 15 degrees; and the bottom subplot shows Converted power in watts oscillating between 0 and about 45 W with sharp periodic peaks, consistent with power generation occurring twice per wave cycle.
Ideal Locations for Deployment
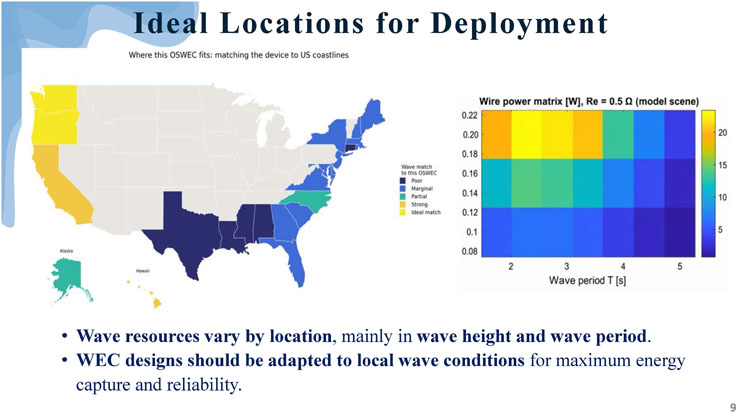
Where this OSWEC fits: matching the device to US coastlines
A map of the United States is color-coded by "Wave match to this OSWEC" using five categories: Poor, Marginal, Partial, Strong, and Ideal match. Poor match (dark navy) covers Gulf Coast states including Texas, Louisiana, Mississippi, and Alabama. Marginal match (blue) covers much of the East Coast, including Florida, Georgia, the Carolinas, Virginia, and states further north. Partial match (teal) applies to a portion of the East Coast and to Alaska. Strong match (orange) applies to California. Ideal match (yellow) applies to the Pacific Northwest (Washington and Oregon) and to Samoa among the Pacific territories; Hawaii is also shown in yellow/ideal-match coloring.
A heatmap titled "Wire power matrix [W], Re = 0.5 Ω (model scene)" plots wave period T in seconds (x-axis, 2 to 5) against wave height in meters (y-axis, 0.08 to 0.22), with color representing wire power in watts on a scale from about 0 (dark blue) to over 20 (bright yellow). The brightest region, indicating the highest power output (around 20+ W), occurs at low wave periods (about 2 to 3 seconds) combined with high wave heights (about 0.18 to 0.22 m). Power drops off toward longer wave periods and lower wave heights, shown in darker blue.
- Wave resources vary by location, mainly in wave height and wave period.
- WEC designs should be adapted to local wave conditions for maximum energy capture and reliability.
Project II: Ocean Current Turbine (OCT)
Overview
- Converts ocean current flow into electricity.
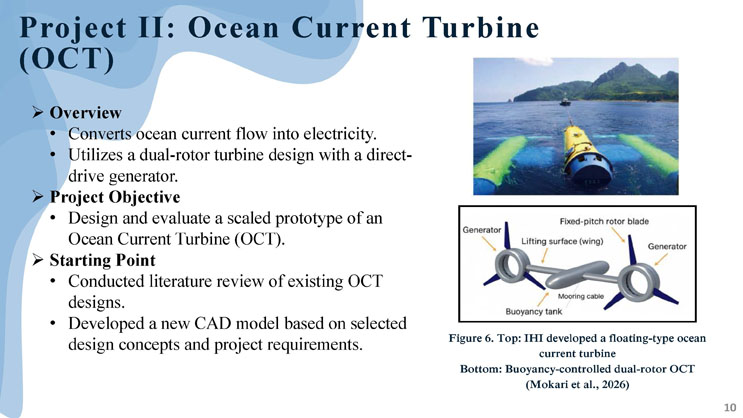
- Utilizes a dual-rotor turbine design with a direct-drive generator.
Project Objective
- Design and evaluate a scaled prototype of an Ocean Current Turbine (OCT).
Starting Point
- Conducted literature review of existing OCT designs.
- Developed a new CAD model based on selected design concepts and project requirements.
Figure 6, top: a photograph of a yellow floating-type ocean current turbine developed by IHI, shown partially submerged near a rocky coastline. Figure 6, bottom: a labeled diagram of the buoyancy-controlled dual-rotor OCT (Mokari et al., 2026), showing two generators driving fixed-pitch rotor blades connected by a central lifting surface (wing), a buoyancy tank, and a mooring cable.
Engineering Design Process
Generator Selection
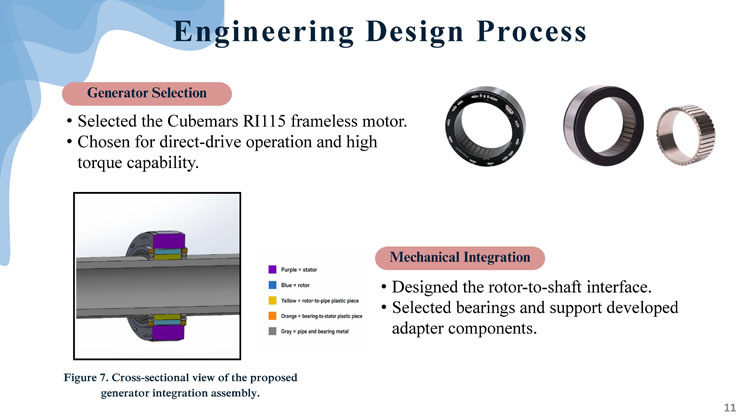
- Selected the Cubemars RI115 frameless motor.
- Chosen for direct-drive operation and high torque capability.
Photos show three views of ring-shaped bearing and motor components.
Figure 7: Cross-sectional view of the proposed generator integration assembly. A CAD rendering of a pipe section shows color-coded components: purple represents the stator, blue represents the rotor, yellow represents the rotor-to-pipe plastic piece, orange represents the bearing-to-stator plastic piece, and gray represents the pipe and bearing metal.
Mechanical Integration
- Designed the rotor-to-shaft interface.
- Selected bearings and support developed adapter components.
Rotor Blade Design
Design Considerations
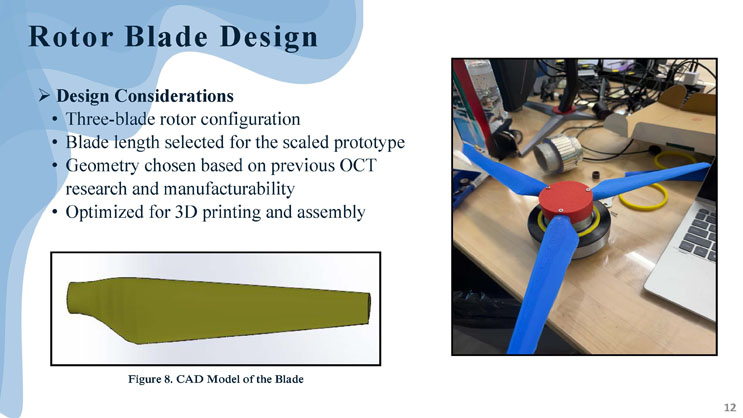
- Three-blade rotor configuration
- Blade length selected for the scaled prototype
- Geometry chosen based on previous OCT research and manufacturability
- Optimized for 3D printing and assembly
Figure 8: CAD Model of the Blade, shown in olive/yellow, depicting a tapered airfoil-shaped blade profile viewed from above.
A photograph shows the assembled prototype: a red central hub with three blue three-dimensional printed blades mounted on a bearing, sitting on a desk near a laptop and other lab equipment.
Final OCT Assembly
Outcome
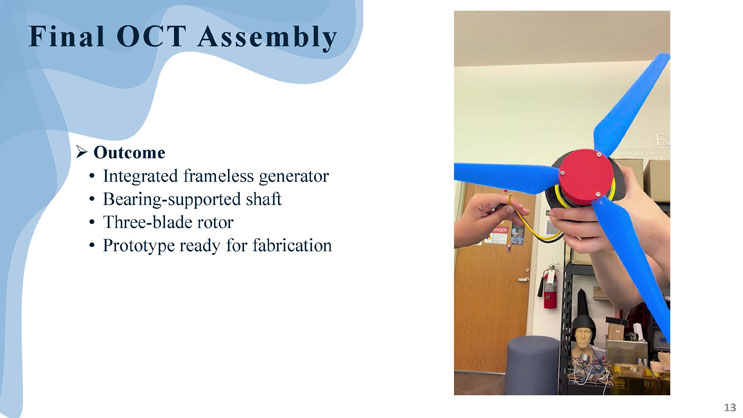
- Integrated frameless generator
- Bearing-supported shaft
- Three-blade rotor
- Prototype ready for fabrication
A photograph shows a person's hands holding the completed OCT rotor assembly: a red central hub with three blue blades and a yellow wire connection, photographed indoors near a doorway, fire extinguisher, and a mannequin head used for lab equipment.
Conclusions
Oscillating Surge Wave Energy Converter
- Improved existing prototype
- Demonstrated electrical generation
- Validated through testing
Ocean Current Turbine
- Developed generator integration concept
- Designed complete prototype assembly
- Established foundation for future fabrication
Both projects advanced the development of practical marine renewable energy systems.
References
Mi, X., et al. (2024). Oscillating Surge Wave Energy Converter Using a Novel Above-Water Power Takeoff with Belt-Arc Speed Amplification.
VanZwieten, J., et al. (2006). Design of a Prototype Ocean Current Turbine—Part I: Mathematical Modeling and Dynamics Simulation.
VanZwieten, J., et al. (2019). A Modeling Approach for a Buoyancy-Controlled Dual-Rotor Ocean Current Turbine.
Mokari, A., et al. (2026). Modeling, Dynamic Simulation, and Loading Assessment of a Buoyancy-Controlled Dual-Rotor Ocean Current Turbine.
Acknowledgments
We would like to sincerely thank:
- Dr. Yufei Tang for his guidance, mentorship, and continuous support throughout this research.
- FAU I-SENSE REU Program for providing this valuable research opportunity.
- I-SENSE for providing laboratory resources and facilities.
- Previous researchers whose work served as the foundation for this project.
- This work was supported through the NSF REU Site in Sensing and Smart Systems, funded through NSF Award CNS-2447437.
- This work was supported through the NSF Engineering Research Center for Smart Streetscapes (CS3), funded through NSF Cooperative Agreement EEC-2133516.
Thank you!
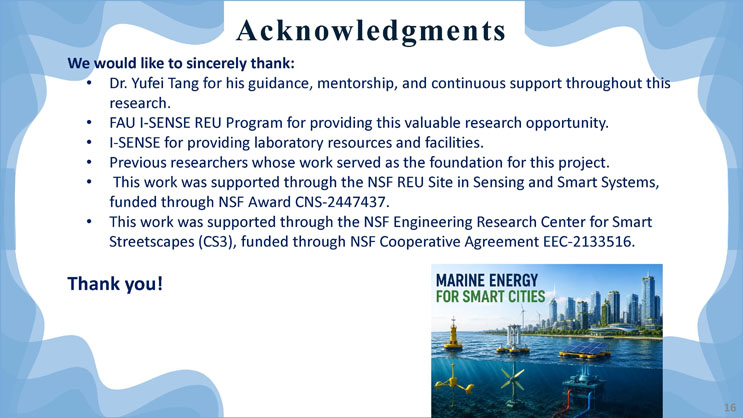
An illustration titled "Marine Energy for Smart Cities" depicts a coastal city skyline with wind turbines and buildings, a solar-panel-topped buoy floating on the water, and underwater turbines and equipment beneath the surface.

End of Presentation
Click the right arrow to return to the beginning of the slide show.
For a downloadable version of this presentation, email: I-SENSE@FAU.