From 3D Skeletons to Walking Events: Detecting Heel Strikes and Toe-Offs from Ordinary Video
From 3D Skeletons to Walking Events
Detecting heel strikes and toe-offs from ordinary video
Suhao Jeffrey Huang
Mentors: John Forde, Prof. Ghoraani

Florida Atlantic University
Florida Atlantic University owl logo. Text reads: FLORIDA ATLANTIC UNIVERSITY. I-SENSE: The Institute for Smarter Cities, Spaces, and Health.
The overall picture
- The timing of each step provides useful information about how a person walks.
- Traditionally, these measurements may require specialized equipment such as pressure-sensitive walkways or wearable sensors.
- Video-based systems could offer a more accessible alternative.
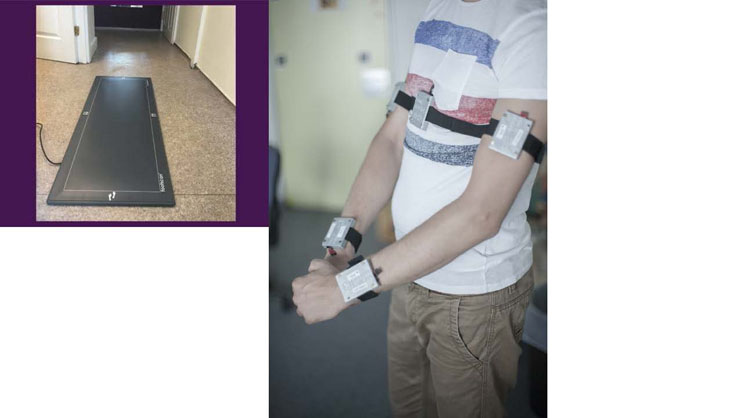
This slide contains no title text, only two photographs illustrating traditional gait-measurement equipment.
Left photograph: a long, rectangular pressure-sensitive walkway mat (a Footscan-brand mat) laid on a tile hallway floor in front of a doorway, used to measure footstep pressure and timing as a person walks across it.
Right photograph: a person's torso and arms, shown wearing several rectangular wireless motion sensor units strapped to the upper arms, forearms, and waist with elastic bands, representing wearable inertial sensors used to track body movement.
What the lab already developed
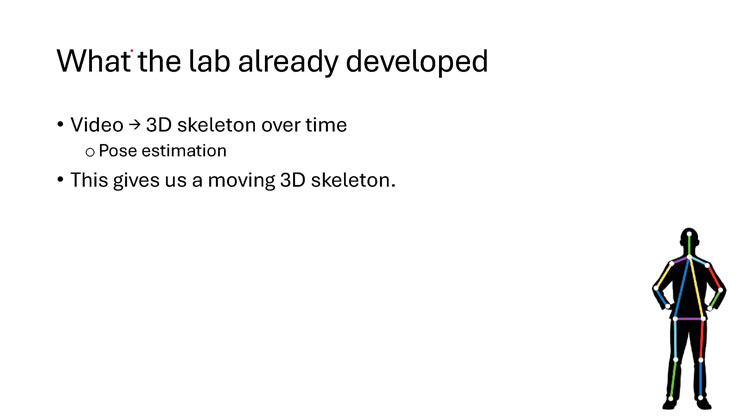
- Video → 3D skeleton over time
- Pose estimation
- This gives us a moving 3D skeleton.
Illustration: a black silhouette of a standing person overlaid with a colored skeletal diagram, showing white dots at the head, shoulders, elbows, hands, hips, knees, and feet, connected by colored lines (red, green, yellow, blue, purple) representing the joints and limb segments tracked by the pose estimation system.
The missing step: finding step events
- Heel strike (initial contact): the foot makes contact with the ground.
- Toe-off (final contact): the foot leaves the ground.
- Can heel strikes and toe-offs be detected accurately from the 3D skeleton?
Two possible approaches
- Kinematic methods
- Use interpretable rules based on how the feet and legs move.
- Machine learning
- Use a pretrained model to recognize events from examples.
How the methods were evaluated
- Run each method on the 3D skeleton data.
- Compare its predicted events with events measured by the reference system.
- Measure:
- Timing error: How early or late was the prediction?
- Missed events: How often was a real step not detected?
- False positives: How often was an extra event predicted?
Phase shift issue in Zeni
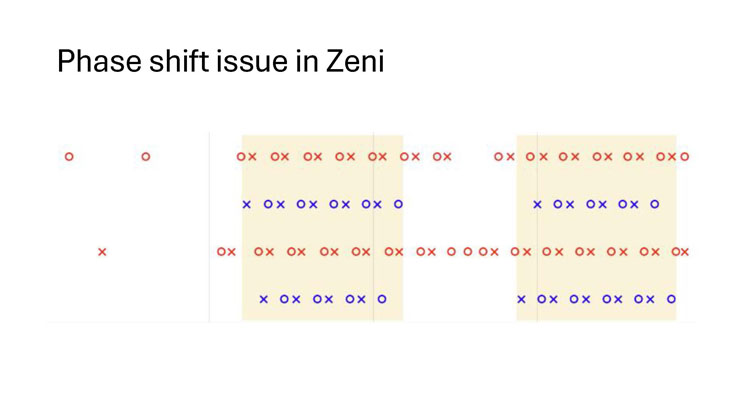
Chart description: a scatter/timeline plot with several horizontal rows of markers. Each row contains a sequence of circle markers (O, in red or blue, representing ground-truth events) and cross markers (X, representing predicted events from the Zeni method). Two rectangular regions in the plot are shaded yellow to highlight windows where the pattern of O and X markers becomes progressively offset from one another moving left to right, illustrating that the Zeni method's predicted events gradually drift out of phase with the true events over time within each highlighted window.
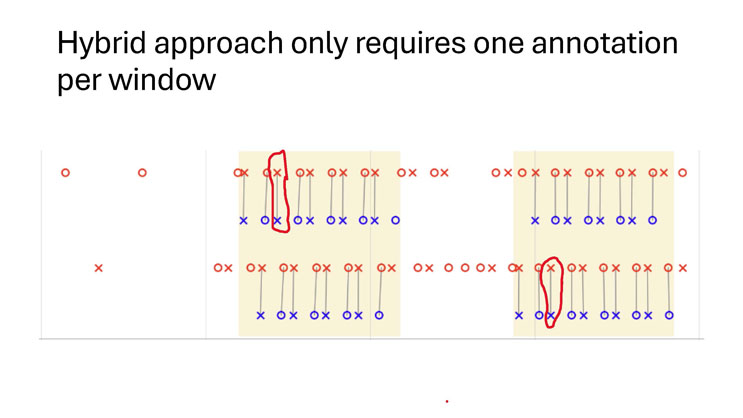
Hybrid approach only requires one annotation per window
Chart description: the same scatter/timeline plot of O (ground-truth) and X (predicted) markers as the previous slide, now with thin vertical connecting lines drawn between paired markers within each shaded yellow window, and a red hand-drawn circle highlighting a single anchor pair of markers near the start of each window. This illustrates that by manually annotating just one corresponding O and X pair per window, the rest of the predicted events in that window can be re-aligned to the ground truth, correcting the phase shift with minimal manual effort.
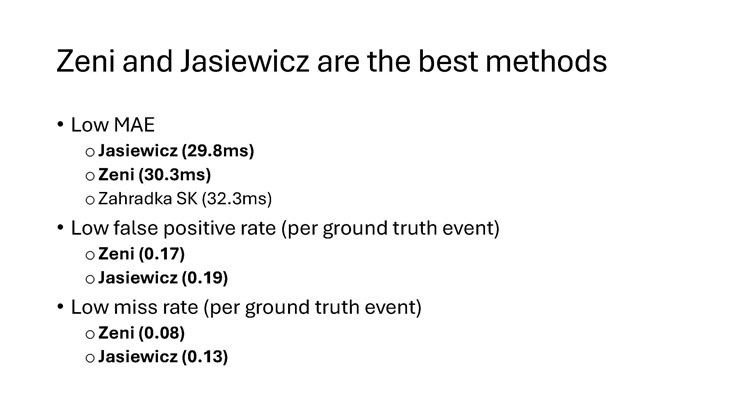
Zeni and Jasiewicz are the best methods
- Low MAE
- Jasiewicz (29.8ms)
- Zeni (30.3ms)
- Zahradka SK (32.3ms)
- Low false positive rate (per ground truth event)
- Zeni (0.17)
- Jasiewicz (0.19)
- Low miss rate (per ground truth event)
- Zeni (0.08)
- Jasiewicz (0.13)
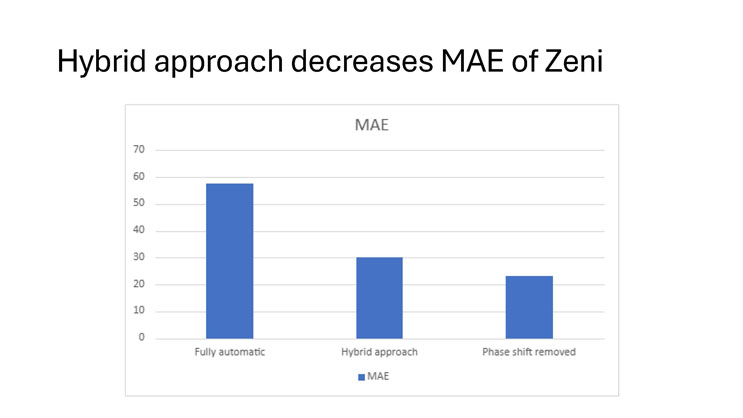
Hybrid approach decreases MAE of Zeni
Bar chart titled "MAE" with a vertical axis ranging from 0 to 70 and three categories on the horizontal axis, each with a single blue bar labeled "MAE" in the legend. "Fully automatic" is approximately 57. "Hybrid approach" is approximately 30. "Phase shift removed" is approximately 23. The chart shows that the mean absolute error of the Zeni method decreases substantially when moving from a fully automatic approach to the hybrid approach, and decreases further when the phase shift is removed.
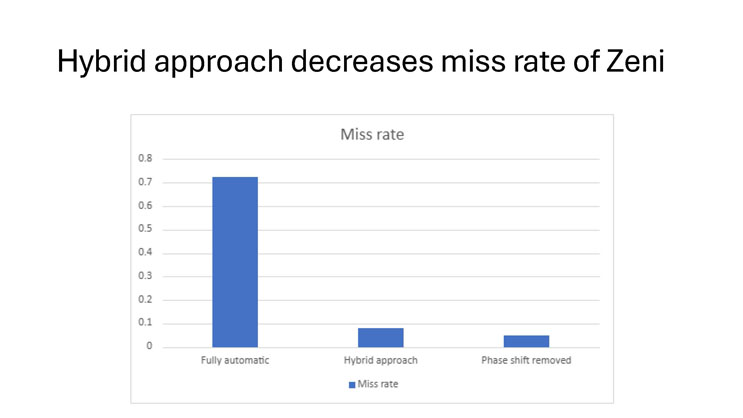
Hybrid approach decreases miss rate of Zeni
Bar chart titled "Miss rate" with a vertical axis ranging from 0 to 0.8 and three categories on the horizontal axis, each with a single blue bar labeled "Miss rate" in the legend. "Fully automatic" is approximately 0.71. "Hybrid approach" is approximately 0.08. "Phase shift removed" is approximately 0.07. The chart shows that the miss rate of the Zeni method drops sharply once the hybrid approach is applied, with only a small further improvement once the phase shift is removed.
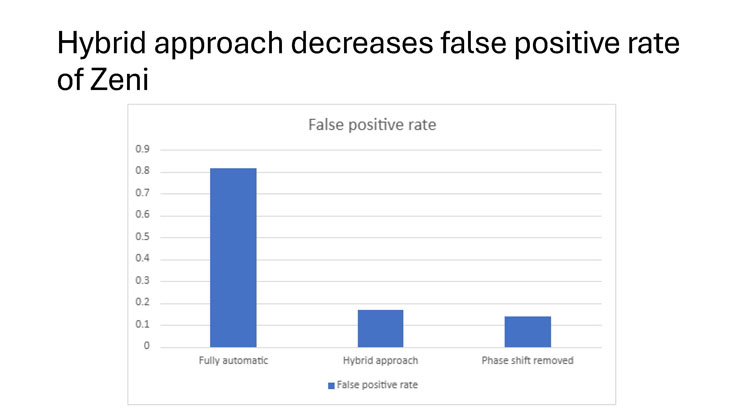
Hybrid approach decreases false positive rate of Zeni
Bar chart titled "False positive rate" with a vertical axis ranging from 0 to 0.9 and three categories on the horizontal axis, each with a single blue bar labeled "False positive rate" in the legend. "Fully automatic" is approximately 0.80. "Hybrid approach" is approximately 0.17. "Phase shift removed" is approximately 0.14. The chart shows that the false positive rate of the Zeni method drops sharply once the hybrid approach is applied, with a small further decrease once the phase shift is removed.
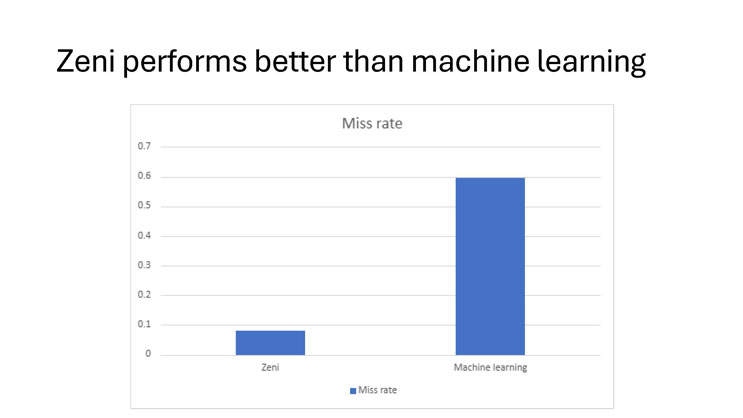
Zeni performs better than machine learning
Bar chart titled "Miss rate" with a vertical axis ranging from 0 to 0.7 and two categories on the horizontal axis, each with a single blue bar labeled "Miss rate" in the legend. "Zeni" is approximately 0.08. "Machine learning" is approximately 0.58. The chart shows that the Zeni method has a substantially lower miss rate than the machine learning method.
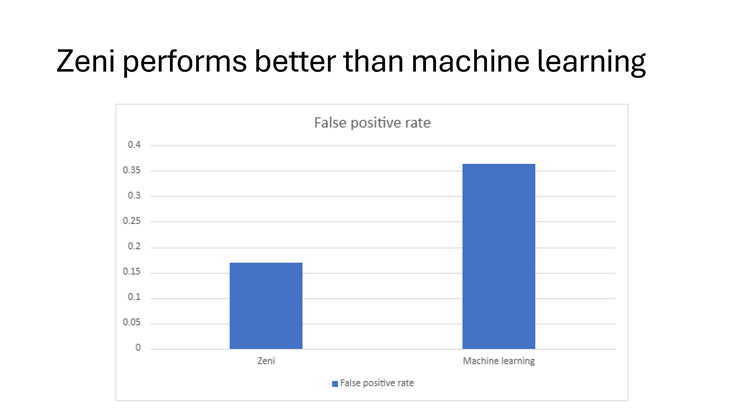
Zeni performs better than machine learning
Bar chart titled "False positive rate" with a vertical axis ranging from 0 to 0.4 and two categories on the horizontal axis, each with a single blue bar labeled "False positive rate" in the legend. "Zeni" is approximately 0.17. "Machine learning" is approximately 0.35. The chart shows that the Zeni method has a lower false positive rate than the machine learning method.
Limitations
- The dataset was small (~20 subjects)
- Some published algorithm descriptions leave implementation details ambiguous.
Next steps
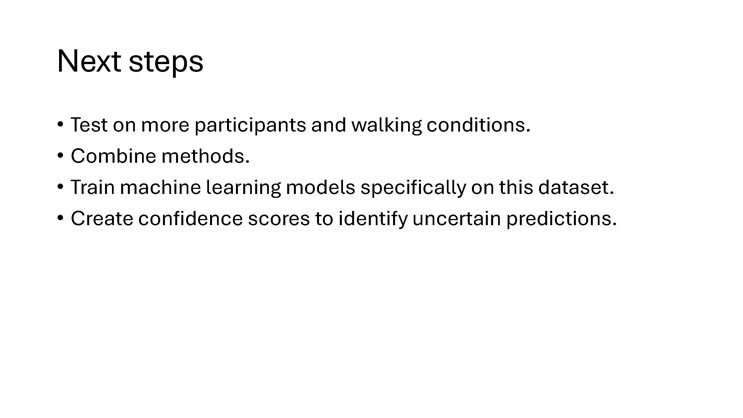
- Test on more participants and walking conditions.
- Combine methods.
- Train machine learning models specifically on this dataset.
- Create confidence scores to identify uncertain predictions.
Acknowledgments
This work was supported through the NSF REU Site in Sensing and Smart Systems, funded through NSF Award CNS-2447437.
End of Presentation
Click the right arrow to return to the beginning of the slide show.
For a downloadable version of this presentation, email: I-SENSE@FAU.