Surface Reconstruction of Urban Photogrammetry for Wind Simulation: Developing QuASAR, a Quality Adaptive Reconstruction Method
FAU REU · SUMMER 2026
Surface Reconstruction for Large-Scale Urban Wind Simulation
Development of a Quality-Adaptive Reconstruction Workflow
Vedant Sundriyal
Lehman College
REU Mentor: Dr. Jinwoo Jang · REU Co-Mentor: Mojtaba
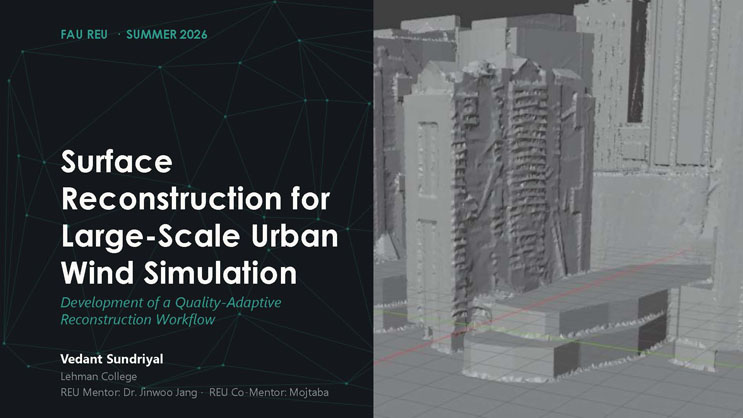
A dense grayscale 3D photogrammetric scan of downtown high-rise buildings fills the right side of the slide, showing textured facades and rooftop structures.
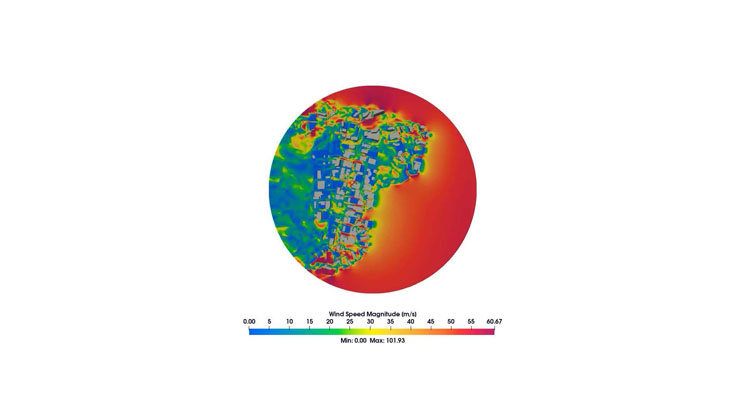
A circular CFD (computational fluid dynamics) visualization shows wind flow around a cluster of city buildings viewed from above. A color scale labeled "Wind Speed Magnitude (m/s)" ranges from 0.00 (dark blue) through green, yellow, and orange to 60.67+ (magenta/pink), with the legend noting a data range of Min: 0.00, Max: 101.93. Gray building footprints are visible within the circular field, surrounded by a large red/orange region indicating high ambient wind speed, with a mix of blue, green, and yellow turbulent zones threading between the buildings, indicating localized areas of slower and more chaotic airflow within the urban canyon.
Outline
- Introduction
- Surface-Reconstruction Methods Investigated
- The Source-Quality Problem
- Understanding the Urban Surface
- QuASAR Method and Pipeline
- Results and Validation
- Comparison with the State of the Art
- Conclusions, Limitations, and Future Work
01 Introduction
Why city-scale wind simulation is now within reach — and what it needs from geometry.
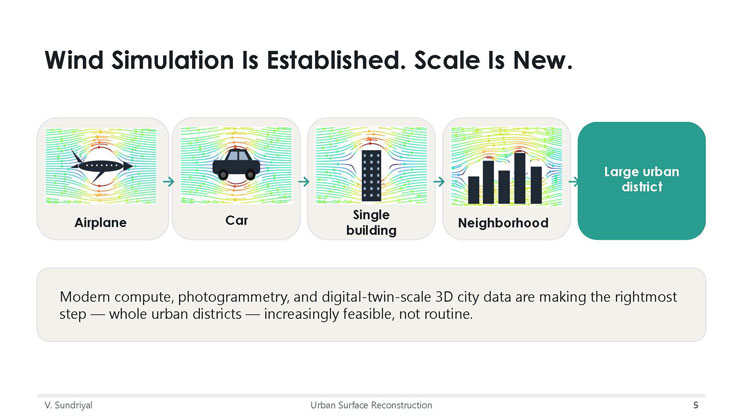
Wind Simulation Is Established. Scale Is New.
A horizontal sequence of five icons, each showing a streamline flow pattern around an object, illustrates increasing simulation scale: Airplane, Car, Single building, Neighborhood, and finally a highlighted box labeled "Large urban district."
Modern compute, photogrammetry, and digital-twin-scale 3D city data are making the rightmost step — whole urban districts — increasingly feasible, not routine.
METHODS
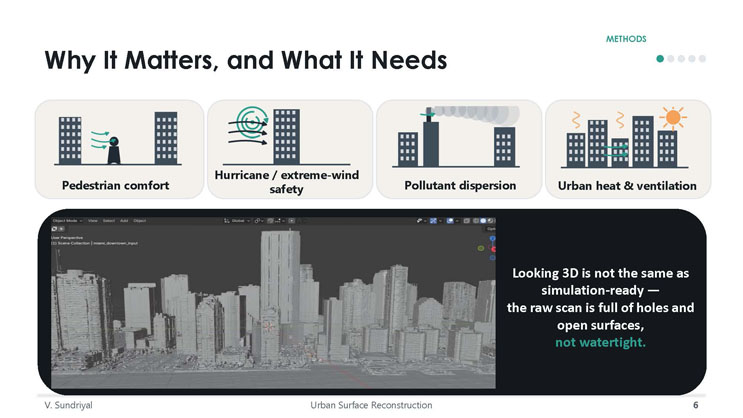
Why It Matters, and What It Needs
Four icon boxes list applications of urban wind simulation: Pedestrian comfort, Hurricane / extreme-wind safety, Pollutant dispersion, and Urban heat & ventilation.
A screenshot of a 3D modeling application (Blender) shows a grayscale photogrammetric scan titled "miami_downtown_input" in the scene outliner, displaying a skyline of high-rise buildings from a low perspective view.
Looking 3D is not the same as simulation-ready — the raw scan is full of holes and open surfaces, not watertight.
METHODS
Research Goal
How can large-scale urban photogrammetry be reconstructed into simulation-ready geometry while preserving reliable captured detail?
Transform photogrammetric urban geometry into a watertight, usable surface for future wind simulation — geometry preparation only; the simulation itself is future work.
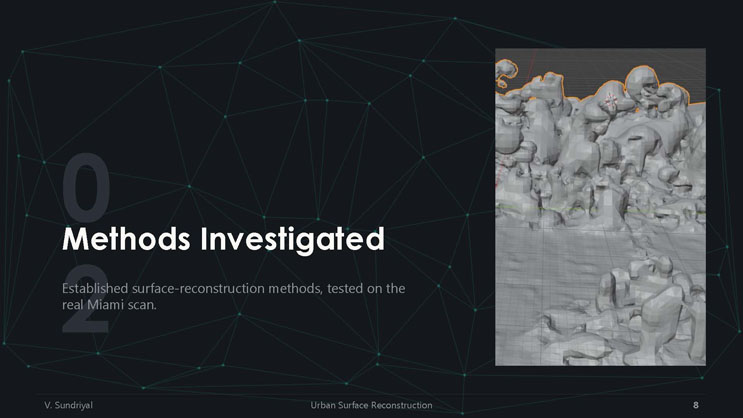
02 Methods Investigated
Established surface-reconstruction methods, tested on the real Miami scan.
An accompanying screenshot shows a rough, bumpy, terrain-like 3D mesh with an orange selection outline along its upper boundary, representing an early reconstruction attempt.
METHODS
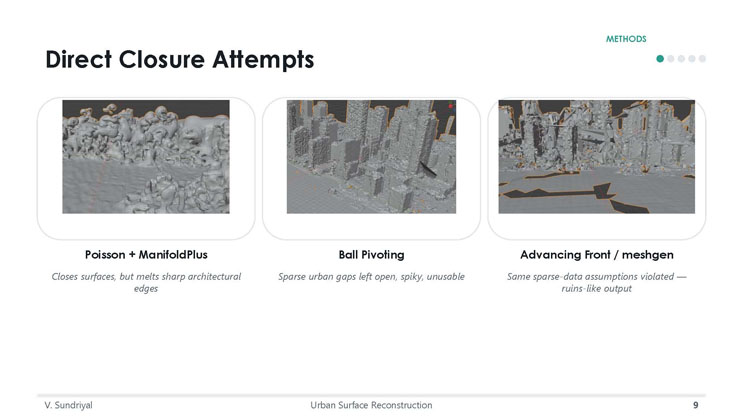
Direct Closure Attempts
Three example screenshots illustrate the results of different mesh-closure methods applied to the raw urban scan:
Poisson + ManifoldPlus: an image shows a smoothed, blobby, melted-looking building mass. Closes surfaces, but melts sharp architectural edges.
Ball Pivoting: an image shows spiky, jagged tower shapes with visible gaps. Sparse urban gaps left open, spiky, unusable.
Advancing Front / meshgen: an image shows a broken, ruins-like cityscape with fragmented, collapsed-looking structures. Same sparse-data assumptions violated — ruins-like output.
METHODS
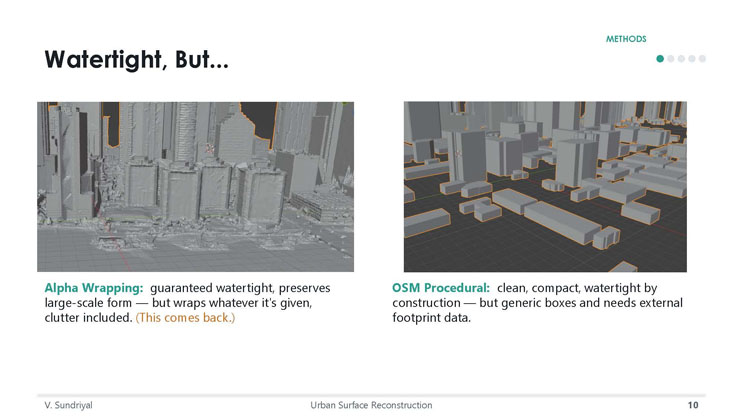
Watertight, But...
Alpha Wrapping: an image shows a city skyline scan with visible rubble and debris fused at the base of the towers. Guaranteed watertight, preserves large-scale form — but wraps whatever it's given, clutter included. (This comes back.)
OSM Procedural: an image shows a set of simple, generic box-shaped buildings with orange outlines arranged in a grid-like street layout. Clean, compact, watertight by construction — but generic boxes and needs external footprint data.

03 What the Experiments Revealed
The results themselves pointed to a deeper, unequal-quality problem in the source scan.
DISCOVERY
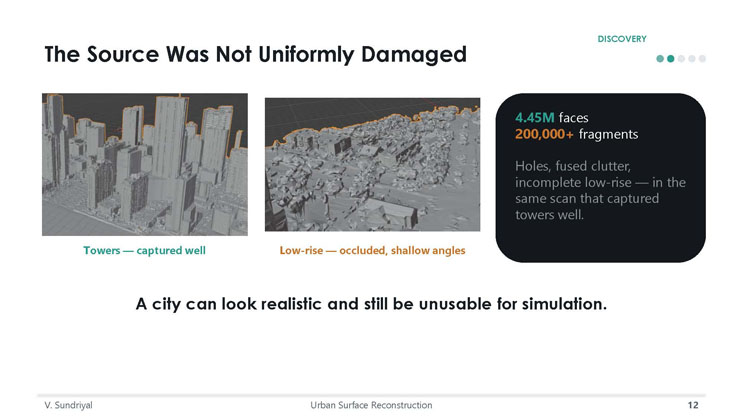
The Source Was Not Uniformly Damaged
Towers — captured well: an image shows a clean, well-defined skyline of tall buildings.
Low-rise — occluded, shallow angles: an image shows rubble-like, broken, and incomplete low-rise structures at street level.
A statistics box reports: 4.45M faces, 200,000+ fragments. Holes, fused clutter, incomplete low-rise — in the same scan that captured towers well.
A city can look realistic and still be unusable for simulation.
METHODS
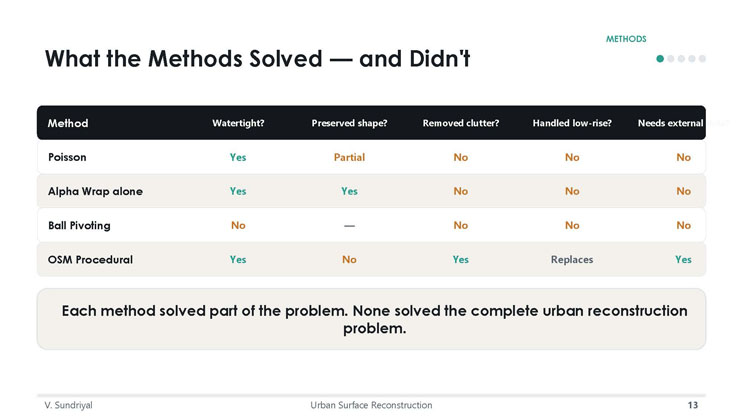
What the Methods Solved — and Didn't
| Method | Watertight? | Preserved shape? | Removed clutter? | Handled low-rise? | Needs external data? |
|---|---|---|---|---|---|
| Poisson | Yes | Partial | No | No | No |
| Alpha Wrap alone | Yes | Yes | No | No | No |
| Ball Pivoting | No | — | No | No | No |
| OSM Procedural | Yes | No | Yes | Replaces | Yes |
Each method solved part of the problem. None solved the complete urban reconstruction problem.
The task was not simply to close holes.
It was to treat different parts of the scan differently.
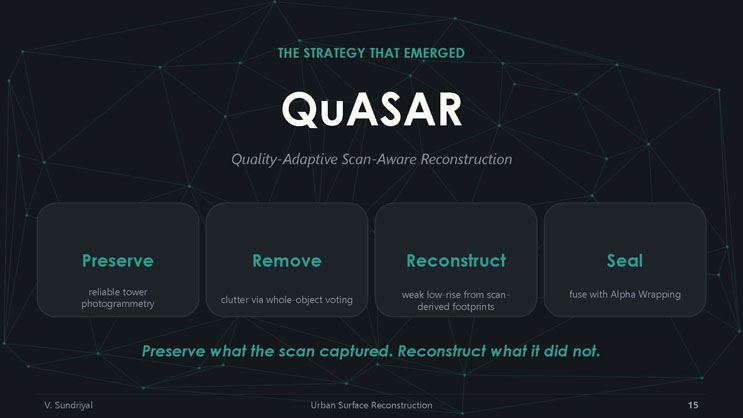
THE STRATEGY THAT EMERGED
QuASAR
Quality-Adaptive Scan-Aware Reconstruction
Four boxes describe the core strategy:
- Preserve: reliable tower photogrammetry
- Remove: clutter via whole-object voting
- Reconstruct: weak low-rise from scan-derived footprints
- Seal: fuse with Alpha Wrapping
Preserve what the scan captured. Reconstruct what it did not.
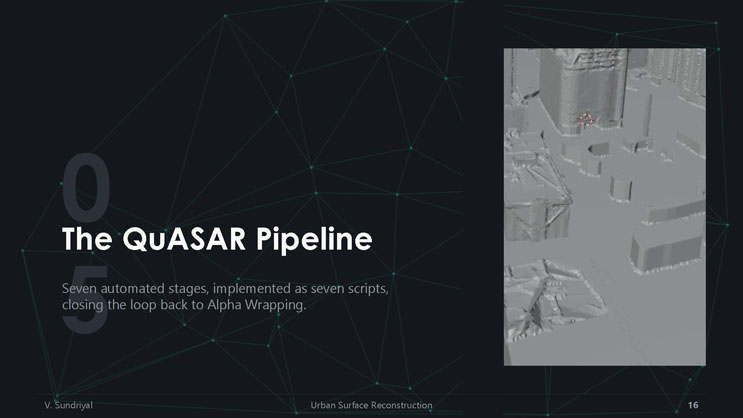
05 The QuASAR Pipeline
Seven automated stages, implemented as seven scripts, closing the loop back to Alpha Wrapping.
An accompanying grayscale aerial-view 3D scan shows a downtown area with towers and lower surrounding structures.
QUASAR
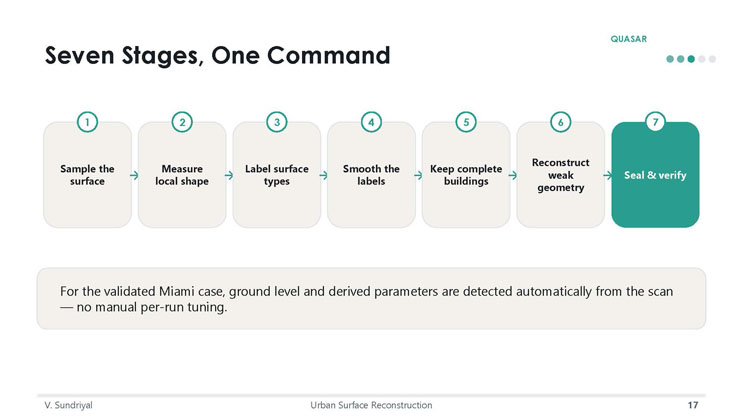
Seven Stages, One Command
- Sample the surface
- Measure local shape
- Label surface types
- Smooth the labels
- Keep complete buildings
- Reconstruct weak geometry
- Seal & verify
For the validated Miami case, ground level and derived parameters are detected automatically from the scan — no manual per-run tuning.
QUASAR
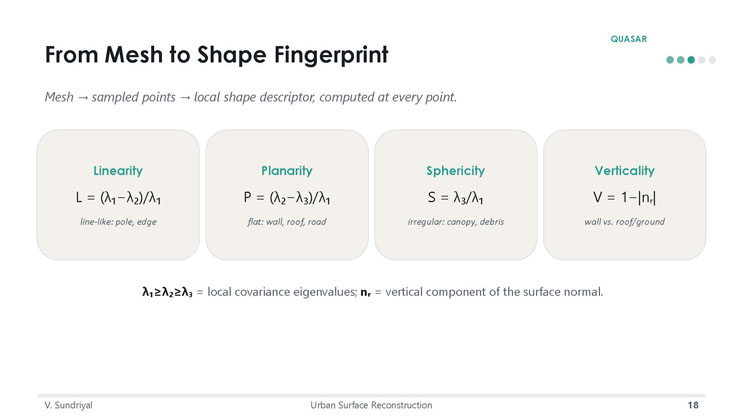
From Mesh to Shape Fingerprint
Mesh → sampled points → local shape descriptor, computed at every point.
- Linearity: L = (λ₁−λ₂)/λ₁ — line-like: pole, edge
- Planarity: P = (λ₂−λ₃)/λ₁ — flat: wall, roof, road
- Sphericity: S = λ₃/λ₁ — irregular: canopy, debris
- Verticality: V = 1−|n_r| — wall vs. roof/ground
λ₁≥λ₂≥λ₃ = local covariance eigenvalues; n_r = vertical component of the surface normal.
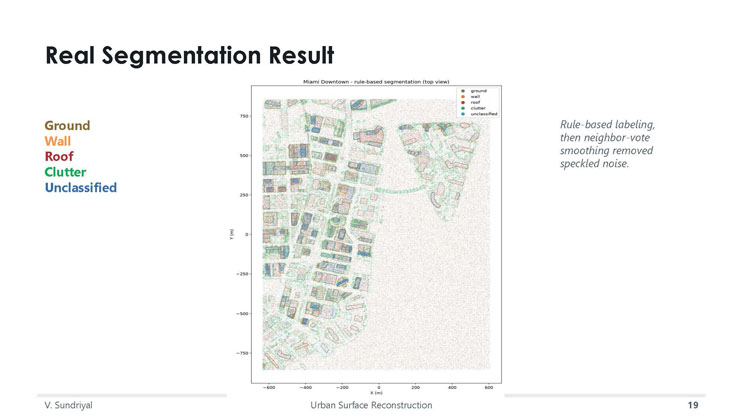
Real Segmentation Result
A legend identifies five surface-type categories by color: Ground, Wall, Roof, Clutter, and Unclassified.
A top-view scatter plot titled "Miami Downtown - rule-based segmentation (top view)" plots point positions with X (m) on the horizontal axis (ranging roughly from -600 to 600) and Y (m) on the vertical axis (ranging roughly from -750 to 750). Colored clusters of points trace out building footprints and street layouts across the downtown area, with the bulk of the point cloud rendered as light gray background points and colored (ground, wall, roof, clutter, unclassified) points concentrated along building outlines.
Rule-based labeling, then neighbor-vote smoothing removed speckled noise.
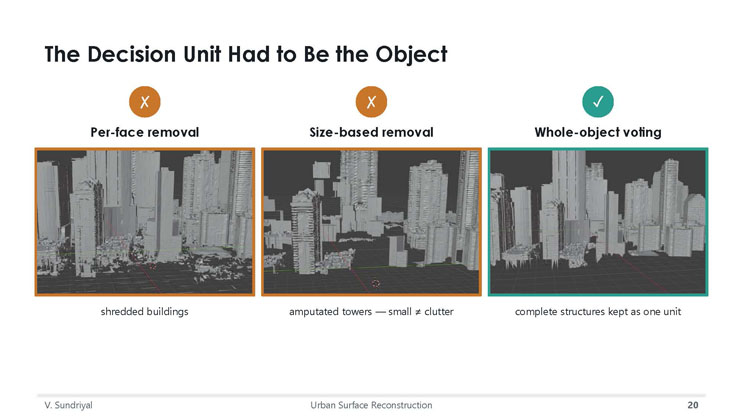
The Decision Unit Had to Be the Object
Per-face removal (marked with an X, indicating failure): an image shows shredded, incomplete buildings.
Size-based removal (marked with an X, indicating failure): an image shows amputated towers, illustrating that small objects are not necessarily clutter.
Whole-object voting (marked with a checkmark, indicating success): an image shows complete structures kept as one unit.
QUASAR
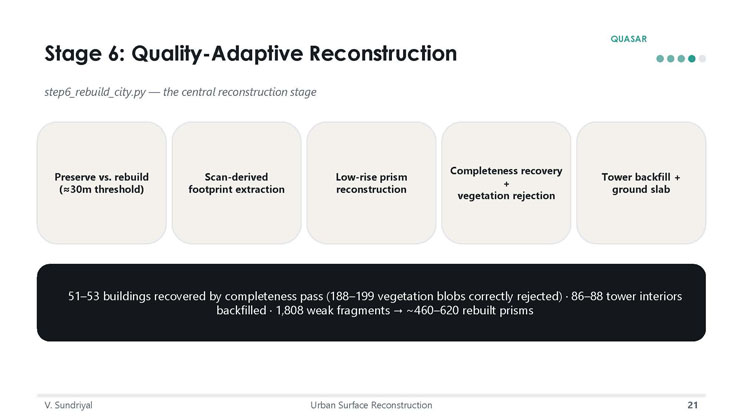
Stage 6: Quality-Adaptive Reconstruction
step6_rebuild_city.py — the central reconstruction stage
Five processing steps are listed: Preserve vs. rebuild (≈30m threshold); Scan-derived footprint extraction; Low-rise prism reconstruction; Completeness recovery + vegetation rejection; Tower backfill + ground slab.
A statistics box reports: 51–53 buildings recovered by completeness pass (188–199 vegetation blobs correctly rejected); 86–88 tower interiors backfilled; 1,808 weak fragments → approximately 460–620 rebuilt prisms.
QUASAR
Stage 7: Seal and Verify
step7_wrap_and_verify.ps1
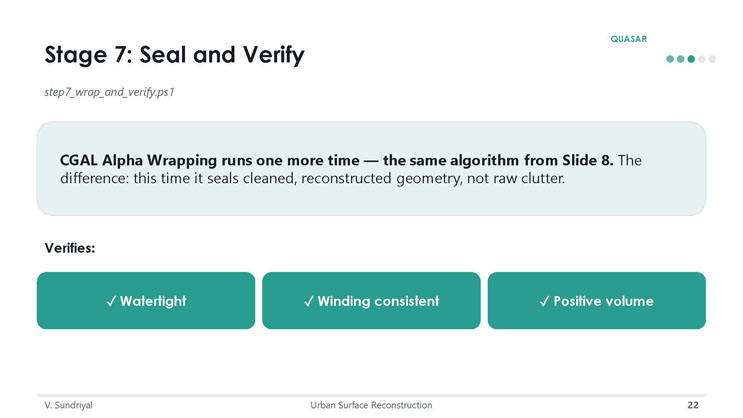
CGAL Alpha Wrapping runs one more time — the same algorithm from Slide 8. The difference: this time it seals cleaned, reconstructed geometry, not raw clutter.
Verifies: Watertight; Winding consistent; Positive volume.
06 Results and Validation
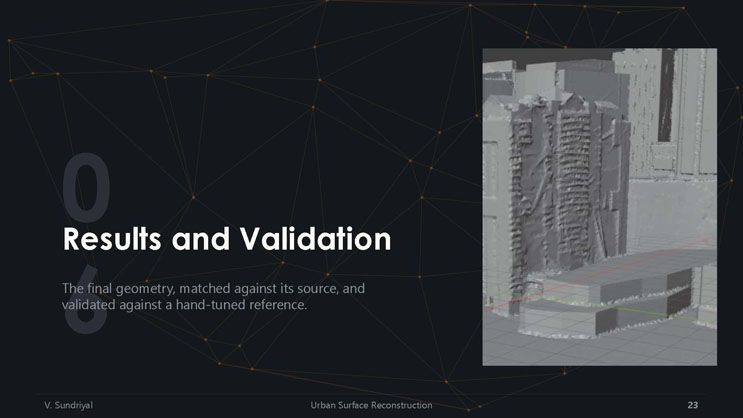
The final geometry, matched against its source, and validated against a hand-tuned reference.
An accompanying grayscale close-up 3D scan shows the textured facade of a tower building alongside a shorter podium structure.
RESULTS
Real Before and After
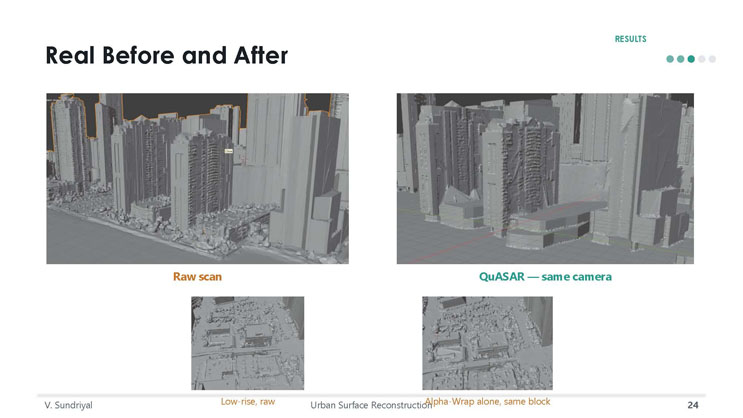
Raw scan: an image with an orange outline shows a skyline with visible rubble and debris fused at the base of the towers.
QuASAR — same camera: a corresponding image from the same viewpoint shows a cleaner reconstruction with a simplified, solid low-rise structure in place of the rubble.
Below, a second comparison shows Low-rise, raw (an image of jumbled, rubble-like low-rise structures) versus Alpha-Wrap alone, same block (an image showing the same block wrapped but still retaining much of the clutter).
RESULTS
Validated Against the Hand-Tuned Reference
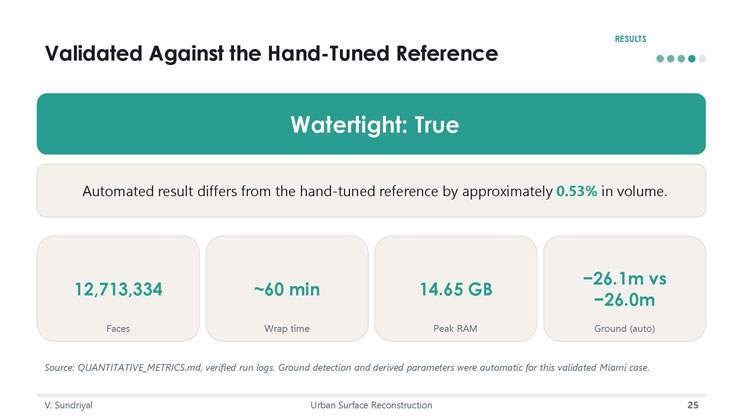
A highlighted banner reads: "Watertight: True"
Automated result differs from the hand-tuned reference by approximately 0.53% in volume.
Four statistic boxes report: 12,713,334 Faces; approximately 60 minutes Wrap time; 14.65 GB Peak RAM; and Ground (auto) of -26.1 meters versus -26.0 meters (comparing the automated detection to the hand-tuned reference).
Source: QUANTITATIVE_METRICS.md, verified run logs. Ground detection and derived parameters were automatic for this validated Miami case.
07 Comparison with the State of the Art
Only now, with the method understood, does the comparison mean something.
RESULTS
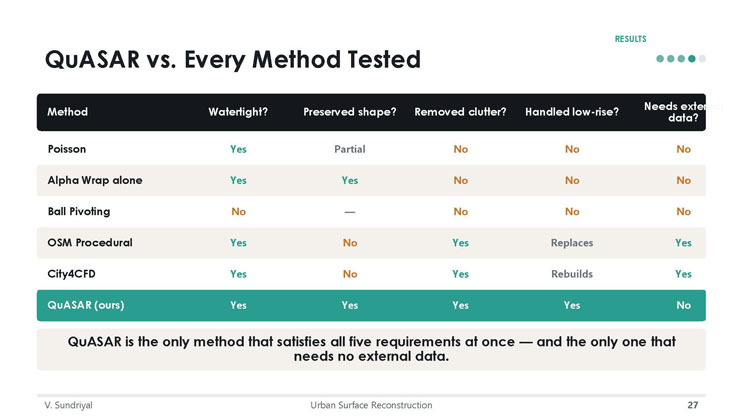
QuASAR vs. Every Method Tested
| Method | Watertight? | Preserved shape? | Removed clutter? | Handled low-rise? | Needs external data? |
|---|---|---|---|---|---|
| Poisson | Yes | Partial | No | No | No |
| Alpha Wrap alone | Yes | Yes | No | No | No |
| Ball Pivoting | No | — | No | No | No |
| OSM Procedural | Yes | No | Yes | Replaces | Yes |
| City4CFD | Yes | No | Yes | Rebuilds | Yes |
| QuASAR (ours) | Yes | Yes | Yes | Yes | No |
QuASAR is the only method that satisfies all five requirements at once — and the only one that needs no external data.
08 Conclusions
Broader surface-reconstruction findings — not just "QuASAR works."
RESULTS
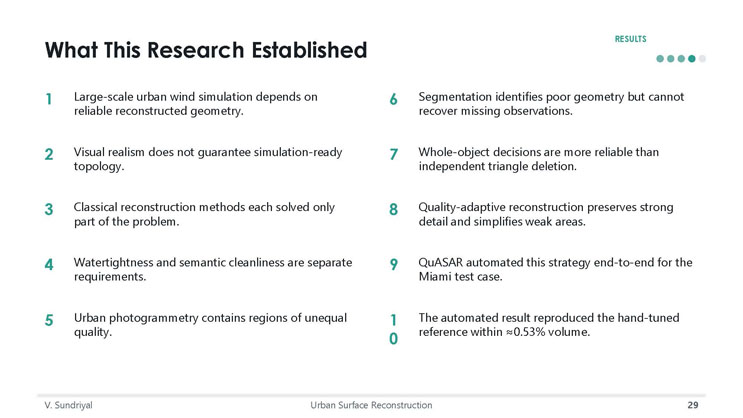
What This Research Established
- Large-scale urban wind simulation depends on reliable reconstructed geometry.
- Visual realism does not guarantee simulation-ready topology.
- Classical reconstruction methods each solved only part of the problem.
- Watertightness and semantic cleanliness are separate requirements.
- Urban photogrammetry contains regions of unequal quality.
- Segmentation identifies poor geometry but cannot recover missing observations.
- Whole-object decisions are more reliable than independent triangle deletion.
- Quality-adaptive reconstruction preserves strong detail and simplifies weak areas.
- QuASAR automated this strategy end-to-end for the Miami test case.
- The automated result reproduced the hand-tuned reference within approximately 0.53% volume.

09 Limitations and Future Expansion
Honest about what remains, organized toward what comes next — including the wind simulation itself.
RESULTS
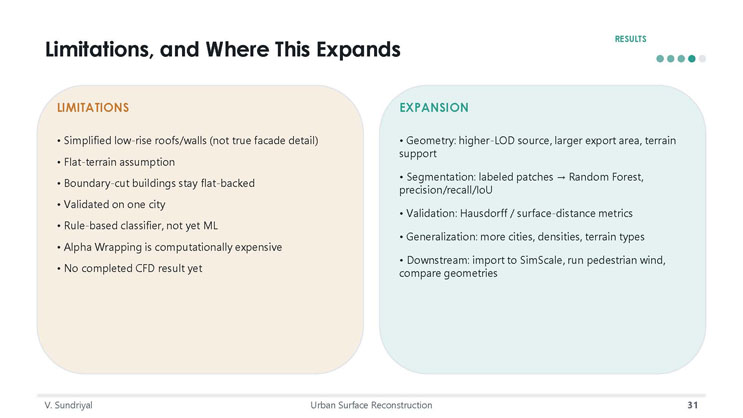
Limitations, and Where This Expands
LIMITATIONS
- Simplified low-rise roofs/walls (not true facade detail)
- Flat-terrain assumption
- Boundary-cut buildings stay flat-backed
- Validated on one city
- Rule-based classifier, not yet ML
- Alpha Wrapping is computationally expensive
- No completed CFD result yet
EXPANSION
- Geometry: higher-LOD source, larger export area, terrain support
- Segmentation: labeled patches → Random Forest, precision/recall/IoU
- Validation: Hausdorff / surface-distance metrics
- Generalization: more cities, densities, terrain types
- Downstream: import to SimScale, run pedestrian wind, compare geometries
Wind simulation can now be attempted at increasingly larger urban scales — but only if the city surface is trustworthy.
QuASAR was developed to preserve reliable urban geometry, reconstruct incomplete regions, and prepare one watertight model for future simulation.
Acknowledgment: This work was supported by the National Science Foundation (NSF) as part of the Center for Smart Streetscapes, under NSF Cooperative Agreement EEC-2133516.
Project repository: github.com/Vedant-Sundriyal/quasar-urban-geometry-reconstruction
Logos shown: Florida Atlantic University and I-SENSE: The Institute for Smarter Cities, Spaces, and Health.
End of Presentation
Click the right arrow to return to the beginning of the slide show.
For a downloadable version of this presentation, email: I-SENSE@FAU.