Underwater Direction Finding Using a Single Hydrophone
Underwater Direction Finding Using a Single Hydrophone
Steven Cohen, George Sklivanitis PhD.
National Science Foundation: I-SENSE REU 2026
Center for Connected Autonomy and Artificial Intelligence
FAU Department of Electrical Engineering and Computer Science
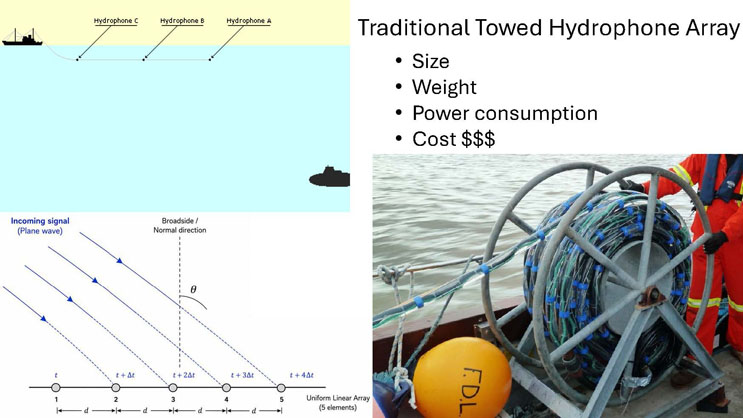
Traditional Towed Hydrophone Array
- Size
- Weight
- Power consumption
- Cost $$$
Diagram 1: A ship on the water surface tows a cable underwater connected to three hydrophones labeled "Hydrophone C", "Hydrophone B", and "Hydrophone A" (ordered from farthest to nearest the ship), with a submarine shown submerged nearby as the target being tracked.
Diagram 2: An illustration titled with an incoming plane wave signal arriving at an angle theta relative to the "Broadside / Normal direction" of a uniform linear array of 5 elements, numbered 1 through 5, evenly spaced by distance d. Dashed lines show the wavefront reaching each array element at successive time instants t, t+Δt, t+2Δt, t+3Δt, and t+4Δt, illustrating how the time delay between elements is used to estimate the angle of arrival.
Photograph: Two crew members in orange safety gear on a boat deck, winding or handling a large cable reel of hydrophone array cable, with an orange buoy marked "F.D.L." in the foreground.
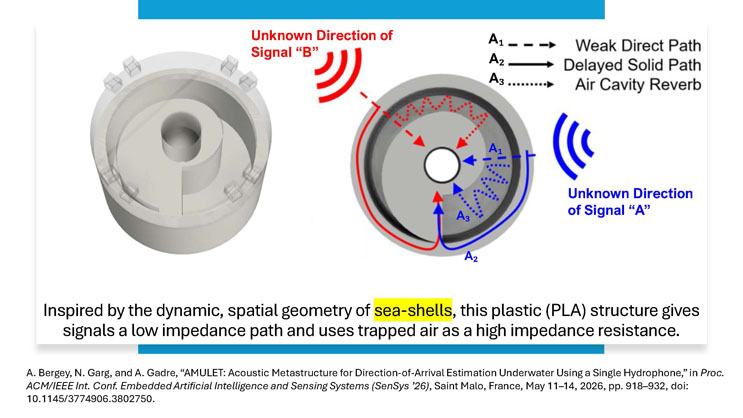
Inspired by the dynamic, spatial geometry of sea-shells, this plastic (PLA) structure gives signals a low impedance path and uses trapped air as a high impedance resistance.
Diagram description: On the left, a 3D-rendered gray cylindrical structure with an internal spiral chamber and a central hole, representing the physical acoustic metastructure design. On the right, a cross-section of the same structure shows two incoming signals arriving from unknown directions: signal "B" (red) and signal "A" (blue). Each signal travels along three labeled path types through the structure to reach the central hole: A1, a dashed line representing "Weak Direct Path"; A2, a solid line representing "Delayed Solid Path"; and A3, a dotted line representing "Air Cavity Reverb". The diagram shows both signals spiraling through the structure's chamber via these three path types before converging at the central sensor opening.
Citation: A. Bergey, N. Garg, and A. Gadre, "AMULET: Acoustic Metastructure for Direction-of-Arrival Estimation Underwater Using a Single Hydrophone," in Proc. ACM/IEEE Int. Conf. Embedded Artificial Intelligence and Sensing Systems (SenSys '26), Saint Malo, France, May 11-14, 2026, pp. 918-932, doi: 10.1145/3774906.3802750.
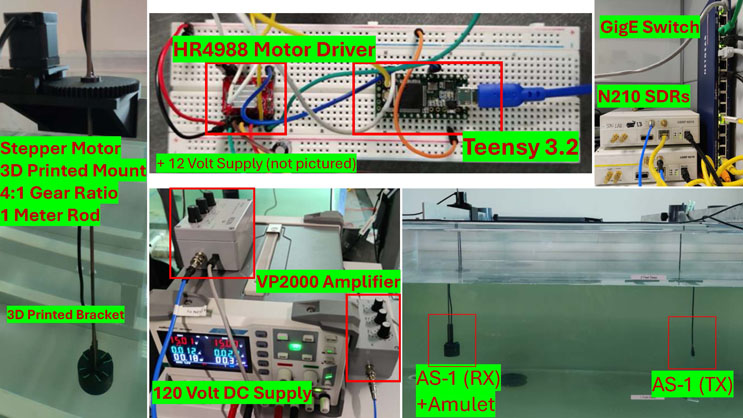
Hardware setup collage, labeled components:
- Stepper Motor, 3D Printed Mount, 4:1 Gear Ratio, 1 Meter Rod, 3D Printed Bracket — shown in a photo of a motorized rotating arm mechanism used to position the transducer.
- HR4988 Motor Driver and Teensy 3.2 — shown wired together on a breadboard, powered by a 12 Volt supply (not pictured).
- GigE Switch and N210 SDRs (software-defined radios) — shown mounted in an equipment rack.
- VP2000 Amplifier and 120 Volt DC Supply — shown as benchtop lab equipment with connected cables and digital readouts.
- AS-1 (RX) + Amulet and AS-1 (TX) — shown as two hydrophone transducers, one fitted with the 3D-printed acoustic metastructure ("Amulet"), suspended in a long rectangular water test tank.
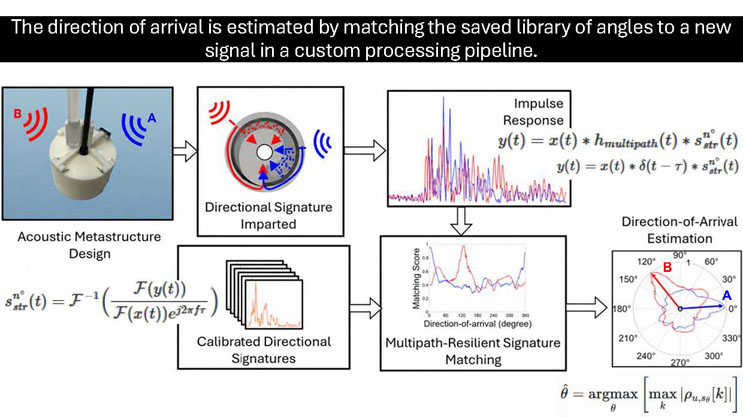
Heading: The direction of arrival is estimated by matching the saved library of angles to a new signal in a custom processing pipeline.
Pipeline diagram, left to right:
- Acoustic Metastructure Design: a photo of the physical device with two incoming signals labeled "B" (red) and "A" (blue) arriving from different directions. An accompanying equation defines the directional signature: s superscript n degrees subscript str of t equals the inverse Fourier transform of the Fourier transform of y(t) divided by the Fourier transform of x(t) times e to the power j2πfτ.
- Directional Signature Imparted: a cross-section of the metastructure showing signals A and B spiraling through the internal chamber toward the center, similar to the path diagram on the previous slide.
- Impulse Response: a line graph plotting two overlapping noisy waveforms (red and blue) over time, representing the impulse response y(t). Two equations are shown: y(t) = x(t) * h_multipath(t) * s_str^n°(t), and a simplified version y(t) = x(t) * δ(t-τ) * s_str^n°(t).
- Calibrated Directional Signatures: a stacked set of small line-graph "cards", each showing a distinct signature waveform, representing a library of pre-calibrated signatures at different angles.
- Multipath-Resilient Signature Matching: a line graph titled with y-axis "Matching Score" (0 to 1) and x-axis "Direction-of-arrival (degree)" ranging from 0 to 360. Two curves (red for signal B, blue for signal A) are plotted, each showing a peak at a distinct angle corresponding to the true direction of that signal.
- Direction-of-Arrival Estimation: a polar plot with angle labels from 0° to 330° around the circle. Two irregular closed-loop shapes are plotted: a red loop with an arrow pointing toward roughly 120° labeled "B", and a blue loop with an arrow pointing toward roughly 0°/360° labeled "A", representing the estimated directions of the two signals.
Final equation: theta-hat equals the argmax over theta of the maximum over k of the absolute value of rho subscript u, s_theta, at index k.
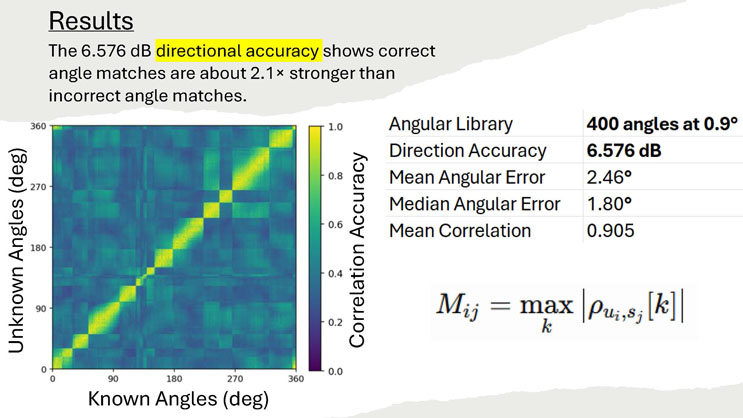
Results
The 6.576 dB directional accuracy shows correct angle matches are about 2.1× stronger than incorrect angle matches.
Heatmap chart: y-axis "Unknown Angles (deg)" ranging from 0 to 360; x-axis "Known Angles (deg)" ranging from 0 to 360. A color scale on the right labeled "Correlation Accuracy" runs from 0.0 (dark purple) to 1.0 (bright yellow). The heatmap shows a bright yellow diagonal band running from the bottom-left (0,0) to the top-right (360,360), indicating strong correlation when unknown and known angles match, with darker, lower-correlation values elsewhere off the diagonal.
Summary table:
| Metric | Value |
|---|---|
| Angular Library | 400 angles at 0.9° |
| Direction Accuracy | 6.576 dB |
| Mean Angular Error | 2.46° |
| Median Angular Error | 1.80° |
| Mean Correlation | 0.905 |
Equation: M subscript ij equals the maximum over k of the absolute value of rho subscript u_i, s_j, at index k.
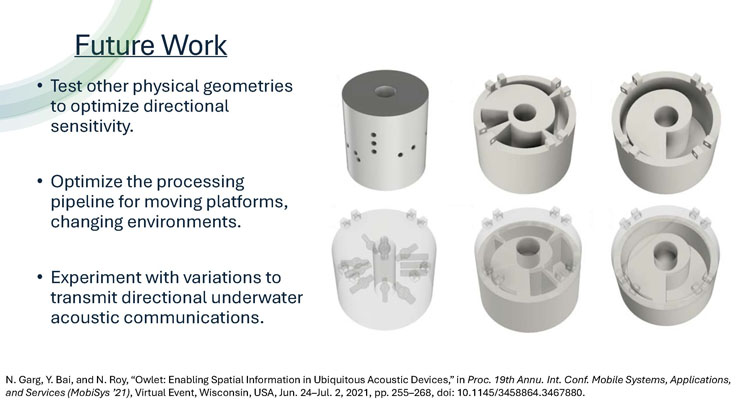
Future Work
- Test other physical geometries to optimize directional sensitivity.
- Optimize the processing pipeline for moving platforms, changing environments.
- Experiment with variations to transmit directional underwater acoustic communications.
Image description: Six 3D-rendered gray models of candidate acoustic metastructure designs, arranged in two rows of three. The top row shows: a solid cylinder with a pattern of small holes along its side; a cutaway view revealing an internal spiral chamber with mounting clips; and a similar cutaway from a different angle. The bottom row shows: a semi-transparent rendering revealing internal components and clips; a solid cylinder with a central spiral cavity and mounting clips visible from above; and another angled view of the same spiral cavity design.
Citation: N. Garg, Y. Bai, and N. Roy, "Owlet: Enabling Spatial Information in Ubiquitous Acoustic Devices," in Proc. 19th Annu. Int. Conf. Mobile Systems, Applications, and Services (MobiSys '21), Virtual Event, Wisconsin, USA, Jun. 24-Jul. 2, 2021, pp. 255-268, doi: 10.1145/3458864.3467880.

Thank you!
Questions?
This work was supported through the NSF REU Site in Sensing and Smart Systems, funded through NSF Award CNS-2447437.
End of Presentation
Click the right arrow to return to the beginning of the slide show.
For a downloadable version of this presentation, email: I-SENSE@FAU.