TIDE: Testing Intermittent Devices for Energy Harvesting

TIDE
Testing Intermittent Devices for Energy Harvesting
REU Scholar: Ashlynn Vick
REU Mentor: Dr. George Sklivanitis
Center for Connected Autonomy and AI
Summer 2026
REU Scholar: Research Intern
REU Mentor: Faculty Advisor
Bottom right logos: Florida Atlantic University, I-SENSE: The Institute for Smarter Cities, Spaces, and Health, and the National Science Foundation.
Motivation
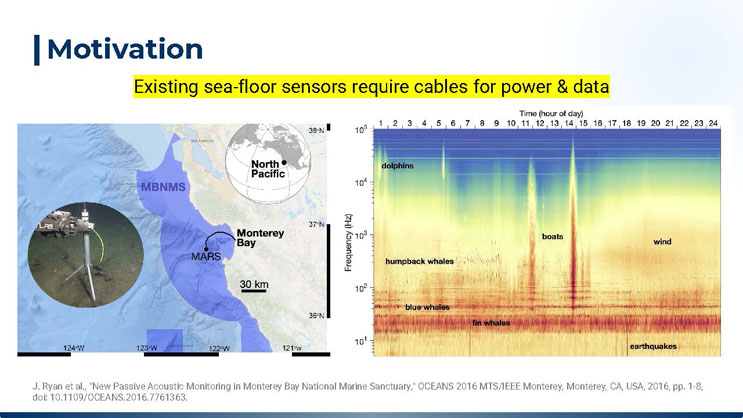
Existing sea-floor sensors require cables for power & data
Left image: a map of the Monterey Bay area along the California coast, showing the Monterey Bay National Marine Sanctuary (MBNMS) boundary, the location of the MARS underwater observatory, a 30 km scale bar, and an inset globe highlighting the North Pacific region. An inset photo shows a cabled underwater sensor instrument (labeled LRS) mounted on the sea floor.
Right image: a spectrogram chart with "Time (hour of day)" from 1 to 24 on the horizontal axis and "Frequency (Hz)" on a logarithmic vertical axis from about 10 to 10^5. Labeled bands and streaks identify sound sources including dolphins and boats at high frequencies, wind across mid-to-high frequencies in the afternoon and evening, humpback whales, blue whales, and fin whales at low frequencies, and earthquakes at the lowest frequencies. Distinct vertical streaks around midday and early afternoon correspond to boat noise.
Citation: J. Ryan et al., "New Passive Acoustic Monitoring in Monterey Bay National Marine Sanctuary," OCEANS 2016 MTS/IEEE Monterey, Monterey, CA, USA, 2016, pp. 1-8, doi: 10.1109/OCEANS.2016.7761363.
Potential Solutions
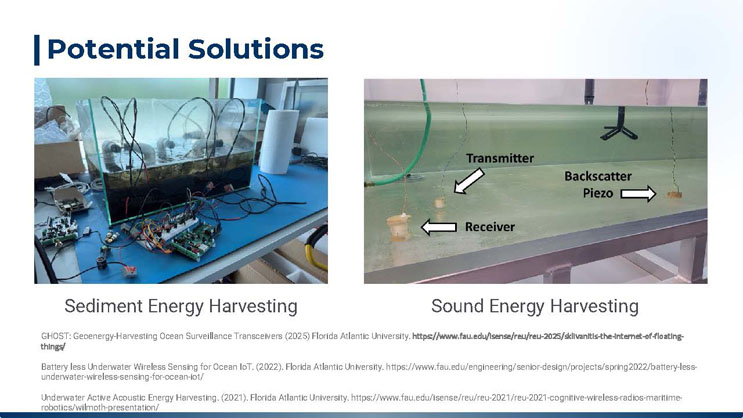
Left image, captioned "Sediment Energy Harvesting": a glass tank filled with sediment and wires on a lab bench, connected to circuit boards and cables for data collection.
Right image, captioned "Sound Energy Harvesting": a glass tank of water with a labeled underwater acoustic setup showing a "Transmitter," a "Receiver," and a "Backscatter Piezo" element, each marked with arrows.
Citations: GHOST: Geoenergy-Harvesting Ocean Surveillance Transceivers (2025) Florida Atlantic University; Battery less Underwater Wireless Sensing for Ocean IoT (2022), Florida Atlantic University; Underwater Active Acoustic Energy Harvesting (2021), Florida Atlantic University.
Challenge: Intermittent Energy
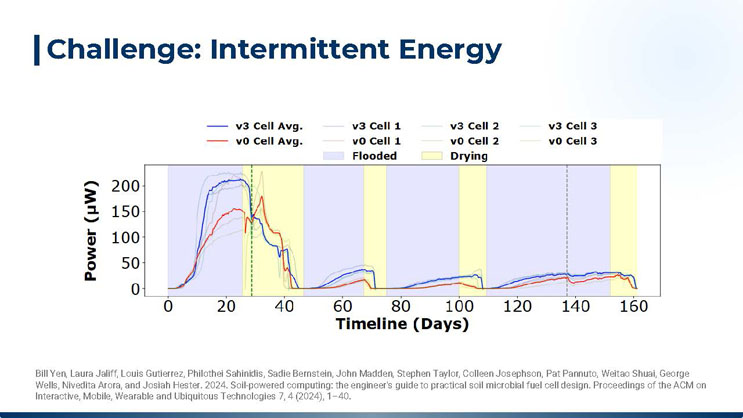
A line chart shows "Power (µW)" on the vertical axis, ranging from 0 to over 200, plotted against "Timeline (Days)" on the horizontal axis, ranging from 0 to about 160. Two main traces are shown: "v3 Cell Avg." in blue and "v0 Cell Avg." in red, each averaged from three individual cell measurements shown as thinner lines in similar colors (v3 Cell 1, v3 Cell 2, v3 Cell 3, v0 Cell 1, v0 Cell 2, v0 Cell 3). The background is shaded in alternating blue "Flooded" and yellow "Drying" periods. Power output rises sharply during flooded periods, peaking around 200 microwatts for v3 and 150 microwatts for v0 in the first cycle, then declines during drying periods, with the pattern repeating at lower peak power in later cycles (around 30-40 microwatts) as the timeline progresses toward 160 days.
Citation: Bill Yen, Laura Jaliff, Louis Gutierrez, Philothei Sahinidis, Sadie Bernstein, John Madden, Stephen Taylor, Colleen Josephson, Pat Pannuto, Weitao Shuai, George Wells, Nivedita Arora, and Josiah Hester. 2024. Soil-powered computing: the engineer's guide to practical soil microbial fuel cell design. Proceedings of the ACM on Interactive, Mobile, Wearable and Ubiquitous Technologies 7, 4 (2024), 1-40.
This project: How a Batteryless System Stores and Uses Energy
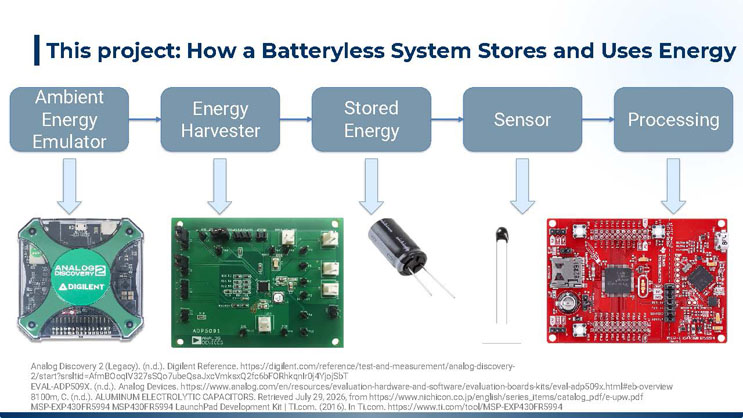
A horizontal flow diagram shows five stages connected by arrows: "Ambient Energy Emulator," "Energy Harvester," "Stored Energy," "Sensor," and "Processing."
Below "Ambient Energy Emulator": a photo of a green Digilent Analog Discovery 2 device used to emulate ambient power input.
Below "Energy Harvester": a photo of a green circuit board labeled ADP5091, an Analog Devices energy harvesting evaluation board.
Below "Stored Energy": a photo of a black cylindrical aluminum electrolytic capacitor with two leads.
Below "Sensor": a photo of a small white bead thermistor temperature sensor with two thin wire leads.
Below "Processing": a photo of a red MSP-EXP430FR5994 MSP430FR5994 LaunchPad development board.
Citations: Analog Discovery 2 (Legacy), Digilent Reference; EVAL-ADP509X, Analog Devices; Aluminum Electrolytic Capacitors, Nichicon; MSP-EXP430FR5994 MSP430FR5994 LaunchPad Development Kit, TI.com (2016).
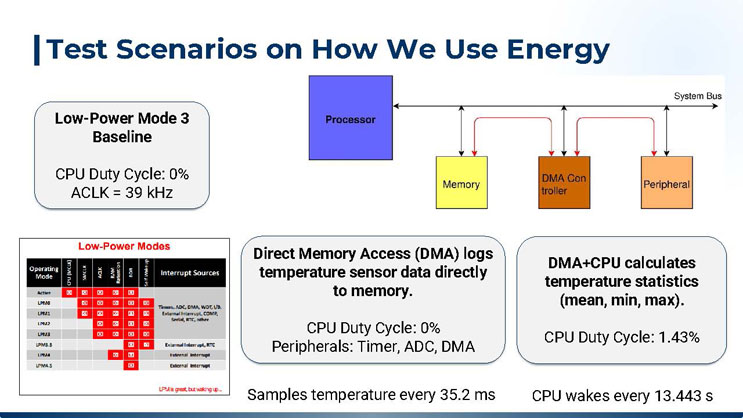
Test Scenarios on How We Use Energy
Box 1, "Low-Power Mode 3 Baseline": CPU Duty Cycle 0%, ACLK = 39 kHz.
Box 2: "Direct Memory Access (DMA) logs temperature sensor data directly to memory." CPU Duty Cycle: 0%, Peripherals: Timer, ADC, DMA. Samples temperature every 35.2 ms.
Box 3: "DMA+CPU calculates temperature statistics (mean, min, max)." CPU Duty Cycle: 1.43%. CPU wakes every 13.443 s.
Diagram: a block diagram showing a "Processor" connected via a "System Bus" to "Memory," a "DMA Controller," and a "Peripheral" block, with arrows indicating data flow between the processor and each component and between the DMA controller and the other blocks.
Table, titled "Low-Power Modes": lists operating modes (Active, LPM0, LPM1, LPM2, LPM3, LPM3.5, LPM4, LPM4.5) against which system clocks and functions remain active (CPU/MCLK, SMCLK, ACLK, RAM Retention, BOR, Self Wakeup), and lists available interrupt sources for each mode (e.g., Timers, ADC, DMA, WDT, I/O, External Interrupt, COMP, Serial, RTC for Active/LPM0/LPM1; narrowing to External Interrupt and RTC for LPM3.5; External Interrupt only for LPM4 and LPM4.5). A note below the table reads "LPM is great, but waking up..."
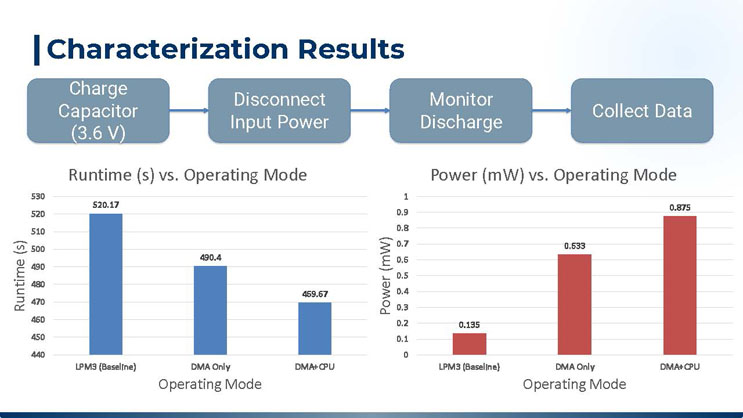
Characterization Results
Process diagram: four sequential steps connected by arrows: "Charge Capacitor (3.6 V)," "Disconnect Input Power," "Monitor Discharge," and "Collect Data."
Left bar chart, titled "Runtime (s) vs. Operating Mode": vertical axis "Runtime (s)" ranging from about 440 to 530. Three bars: LPM3 (Baseline) at 520.17 seconds, DMA Only at 490.4 seconds, and DMA+CPU at 469.67 seconds, showing runtime decreasing as more processing is added.
Right bar chart, titled "Power (mW) vs. Operating Mode": vertical axis "Power (mW)" ranging from 0 to 1. Three bars: LPM3 (Baseline) at 0.135 mW, DMA Only at 0.633 mW, and DMA+CPU at 0.875 mW, showing power consumption increasing as more processing is added.
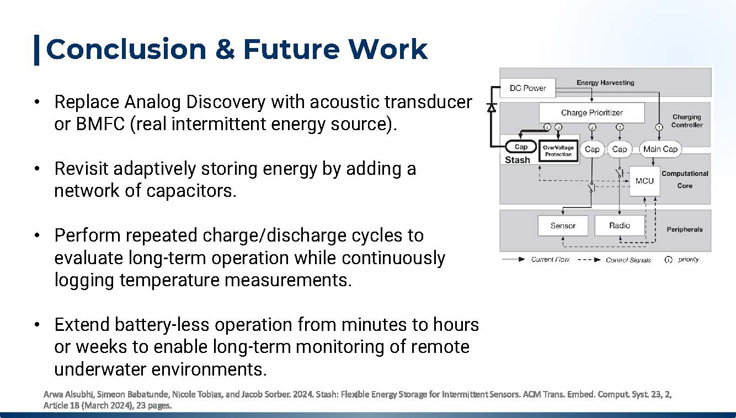
Conclusion & Future Work
- Replace Analog Discovery with acoustic transducer or BMFC (real intermittent energy source).
- Revisit adaptively storing energy by adding a network of capacitors.
- Perform repeated charge/discharge cycles to evaluate long-term operation while continuously logging temperature measurements.
- Extend battery-less operation from minutes to hours or weeks to enable long-term monitoring of remote underwater environments.
Diagram: a labeled block diagram of a proposed energy storage and charging system. A "DC Power" source feeds into an "Energy Harvesting" section containing a "Charge Prioritizer," which distributes current (numbered priority order 1 through 5) to a "Main Cap," two additional "Cap" storage elements, a "Cap Stash," and an "OverVoltage Protection" block, all part of a "Charging Controller" section. The charging controller connects to an "MCU" in a "Computational Core" section, which in turn connects to "Sensor" and "Radio" blocks in a "Peripherals" section. Solid arrows represent current flow and dashed arrows represent control signals, with numbered circles indicating charging priority order.
Citation: Arwa Alsubhi, Simeon Babatunde, Nicole Tobias, and Jacob Sorber. 2024. Stash: Flexible Energy Storage for Intermittent Sensors. ACM Trans. Embed. Comput. Syst. 23, 2, Article 18 (March 2024), 23 pages.

Thank you! Questions?
This work was supported through the NSF REU Site in Sensing and Smart Systems, funded through NSF Award CNS-2447437.
Bottom right logos: Florida Atlantic University, I-SENSE: The Institute for Smarter Cities, Spaces, and Health, and the National Science Foundation.
End of Presentation
Click the right arrow to return to the beginning of the slide show.
For a downloadable version of this presentation, email: I-SENSE@FAU.